
How Is MACD Calculated? The Complete Formula and Math
Most traders use MACD every day. Few actually understand how it's built. That gap matters — because when you know the math, you stop misreading the signals.
MACD stands for Moving Average Convergence Divergence. Gerald Appel developed it in the late 1970s, and it remains one of the most widely used momentum indicators in technical analysis. The reason it endures? The formula is elegant. It captures trend direction, momentum strength, and momentum shifts — all from price alone.
Here's the core insight before we go deeper: Stocks365 backtested 2,310 MACD Bullish Cross signals across equities, commodities, crypto, and forex — and found a 49.7% win rate over a 10-day holding period (profit factor: 0.94). That number is honest, and it tells you something critical. MACD alone isn't an edge. Used with context, it becomes one. More on that shortly.
The MACD Formula: Breaking It Down Step by Step
MACD is built from three components. Understand each one individually, then see how they interact.
Component 1: The MACD Line
The MACD Line is the foundation. It's calculated by subtracting a longer-period EMA from a shorter-period EMA:
MACD Line = 12-period EMA − 26-period EMA
When the 12-period EMA is above the 26-period EMA, MACD is positive. When it's below, MACD is negative. The distance between the two EMAs represents momentum — a widening gap signals accelerating momentum, a narrowing gap signals deceleration.
For a deep dive into how EMAs are constructed mathematically, read our guide on Exponential Moving Average (EMA) Explained With Examples. Understanding EMA smoothing is essential before you can truly internalize MACD behavior.
Component 2: The Signal Line
The Signal Line is a 9-period EMA of the MACD Line itself:
Signal Line = 9-period EMA of MACD Line
This smooths the MACD Line to reduce noise. Crossovers between the MACD Line and Signal Line generate the buy and sell signals most traders recognize. MACD Line crossing above the Signal Line is bullish. Crossing below is bearish.
Component 3: The Histogram
The Histogram visualizes the gap between the MACD Line and Signal Line:
MACD Histogram = MACD Line − Signal Line
Positive histogram bars mean the MACD Line is above the Signal Line. Negative bars mean it's below. The histogram's slope — whether bars are growing or shrinking — often signals a crossover before it happens.
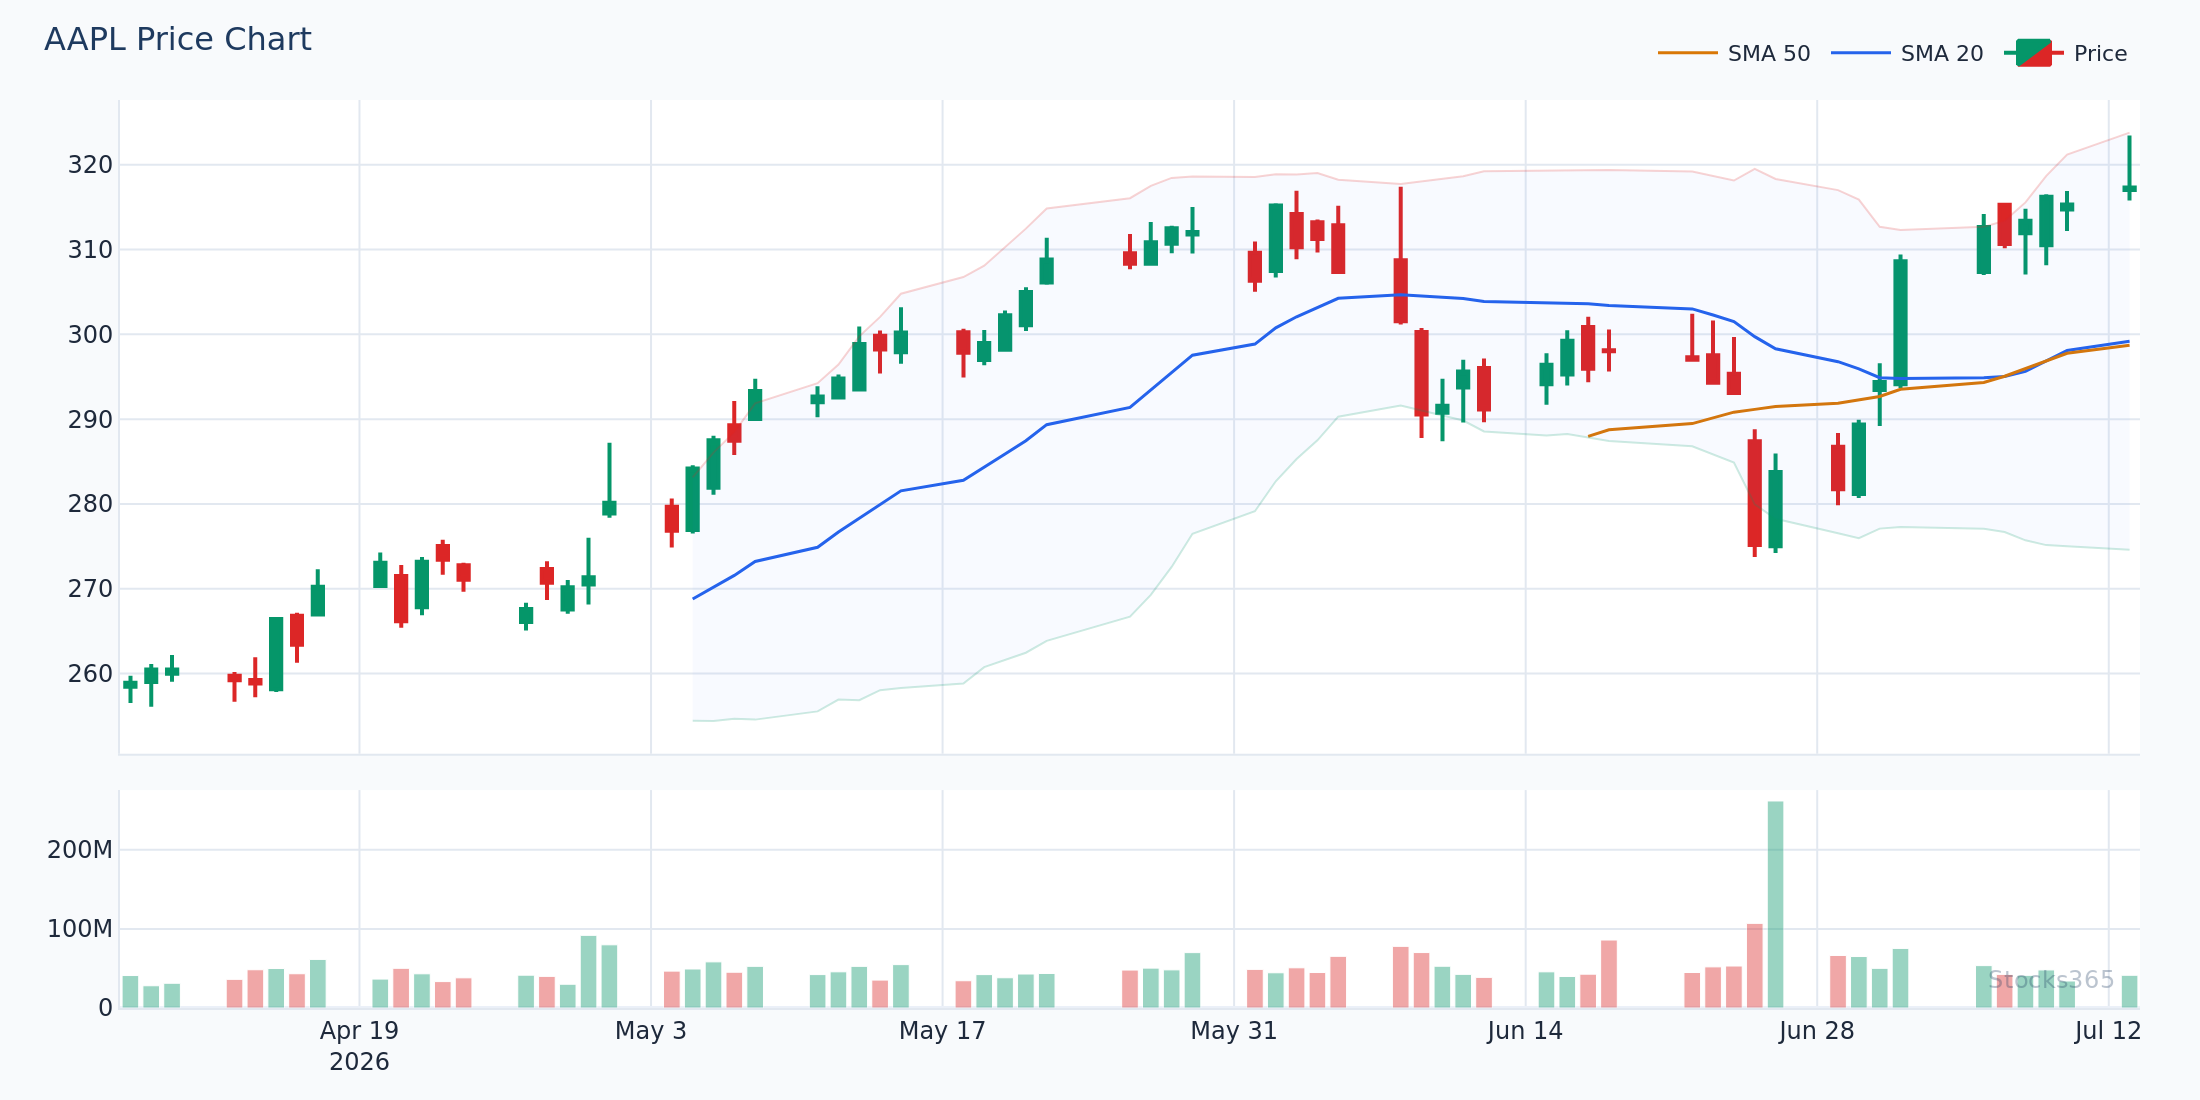
This chart shows the three MACD components layered on price. When the histogram bars begin shrinking after a bullish extension, it typically signals weakening momentum before the MACD Line actually crosses the Signal Line. A confirmed crossover below the zero line with expanding negative histogram bars strengthens the bearish case. Pattern invalidation: if price holds above a rising 20-period EMA while MACD pulls back, the dip is likely shallow.
The Full EMA Math: How Exponential Moving Averages Are Built
Since MACD is entirely EMA-based, you need to understand exactly how an EMA is calculated. It's not complicated — but it is precise.
Step 1: Calculate the Initial SMA
The first EMA value uses a Simple Moving Average as its seed. For a 12-period EMA, sum the first 12 closing prices and divide by 12. That's your starting point.
Step 2: Apply the Multiplier
Every subsequent EMA value applies a smoothing multiplier:
Multiplier = 2 ÷ (Period + 1)
- 12-period EMA multiplier: 2 ÷ (12 + 1) = 0.1538
- 26-period EMA multiplier: 2 ÷ (26 + 1) = 0.0741
- 9-period EMA multiplier: 2 ÷ (9 + 1) = 0.2000
Step 3: Calculate Each EMA Value
EMA = (Current Close − Previous EMA) × Multiplier + Previous EMA
The higher multiplier on the 12-period EMA means it reacts faster to recent price changes. The 26-period EMA moves slower, anchored to a longer history. The gap between them — that's your MACD Line. When price accelerates, the fast EMA pulls away from the slow EMA, and MACD rises.
This is also why the 20-Day EMA is a critical short-term signal — EMA sensitivity to period length is the same mathematical principle driving MACD's behavior.
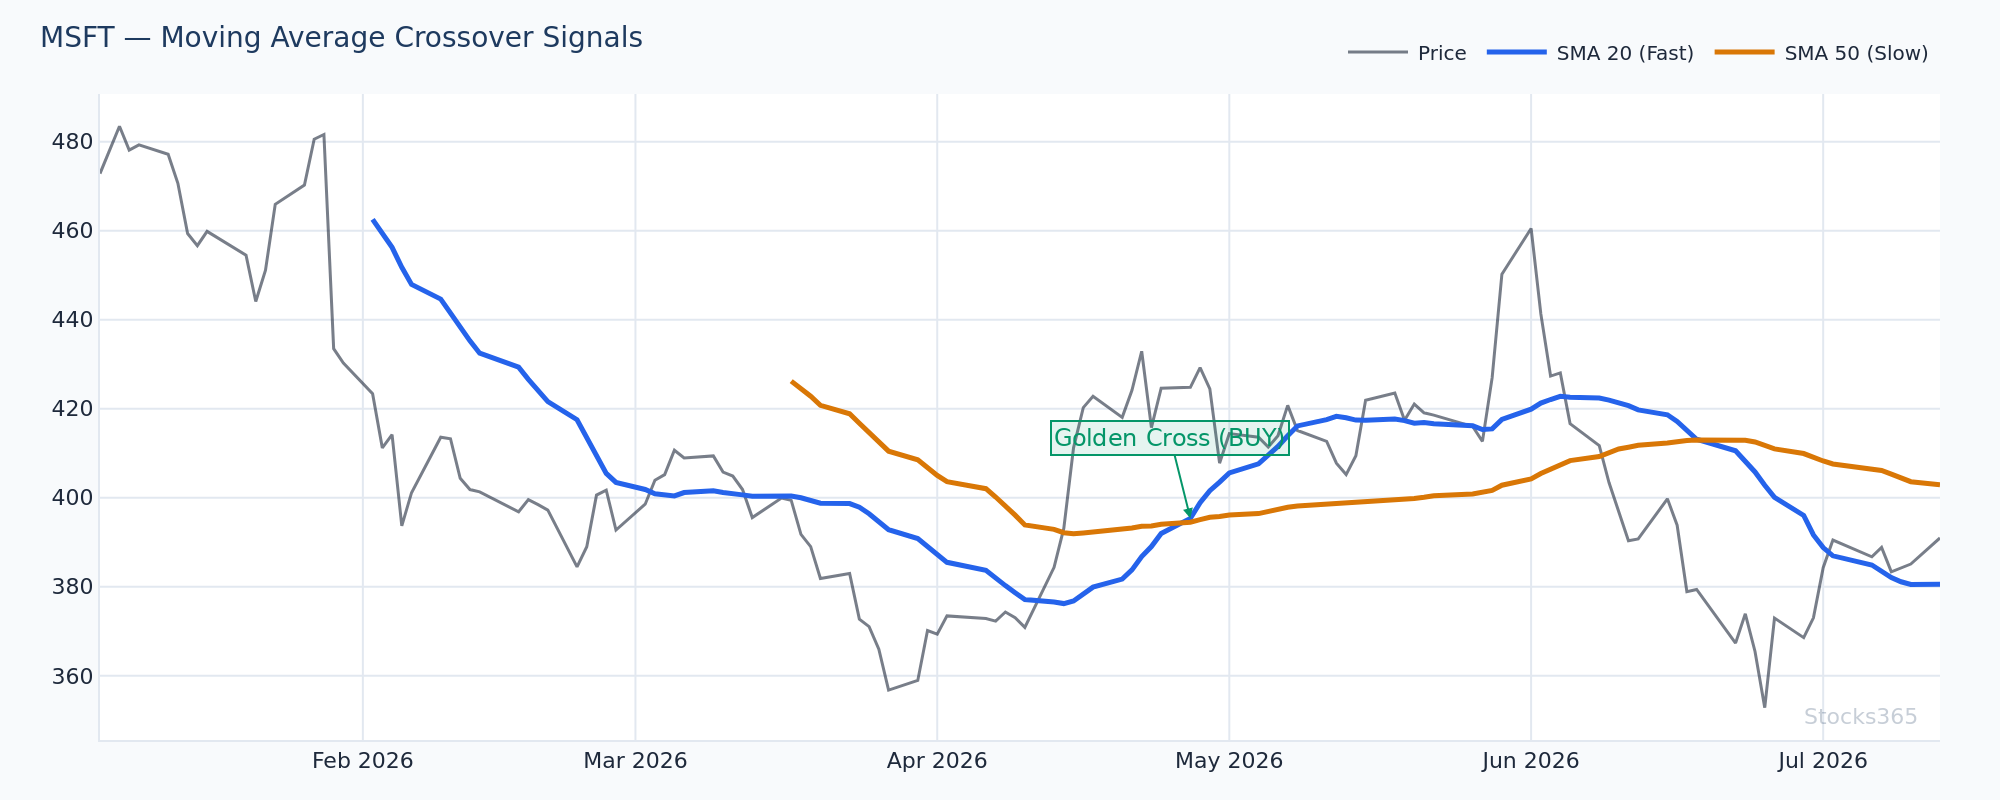
When the 12 EMA crosses above the 26 EMA on the price chart, MACD simultaneously crosses the zero line. This zero-line crossover is often more significant than a simple Signal Line crossover. A setup where price breaks above a key moving average at the same moment MACD crosses zero adds confluence. Invalidation: MACD crossing zero while price remains below a declining 50-period EMA is a low-confidence setup.
MACD Default Settings: Why 12, 26, and 9?
Appel chose these values to approximate two-week and one-month trading cycles based on a five-day trading week. The 12-period covers roughly two trading weeks. The 26-period covers roughly one calendar month. The 9-period signal line adds a week-and-a-half of smoothing.
These defaults have persisted for decades. That persistence matters — because so many traders use them, MACD crossovers on default settings become self-reinforcing. That's market reflexivity working in your favor.
Some traders adjust settings for different timeframes. Shorter periods (5, 13, 6) make MACD more sensitive on intraday charts. Longer periods (21, 55, 9) reduce noise on weekly charts. The math scales — but the logic stays the same.
Reading MACD Signals: What the Math Actually Tells You
The Bullish Crossover
When the MACD Line crosses above the Signal Line, that's a bullish signal. The most powerful version: crossover occurs below the zero line (both values negative), and histogram bars have been shrinking for several periods before the cross. This shows momentum exhaustion on the downside followed by a directional shift.
The Bearish Crossover
The inverse: MACD Line crosses below the Signal Line. Strongest when it occurs above zero after a prolonged uptrend and histogram bars have been shrinking. You're seeing momentum roll over before price fully commits to the move down.
Zero Line Crossovers
When MACD crosses zero from below, the 12-period EMA has just crossed above the 26-period EMA — a trend change on the price chart itself. Many institutional algorithms trigger on this event. It's not a subtle signal. It's a structural shift in momentum.
MACD Divergence
Price makes a higher high, but MACD makes a lower high. That's bearish divergence — price momentum is weakening even as price rises. The inverse is bullish divergence. Divergence doesn't predict timing, but it warns you a trend is running out of fuel.
The divergence concept works across indicators. RSI Divergence uses the same underlying logic — and combining RSI divergence with MACD divergence on the same bar creates a high-conviction signal.
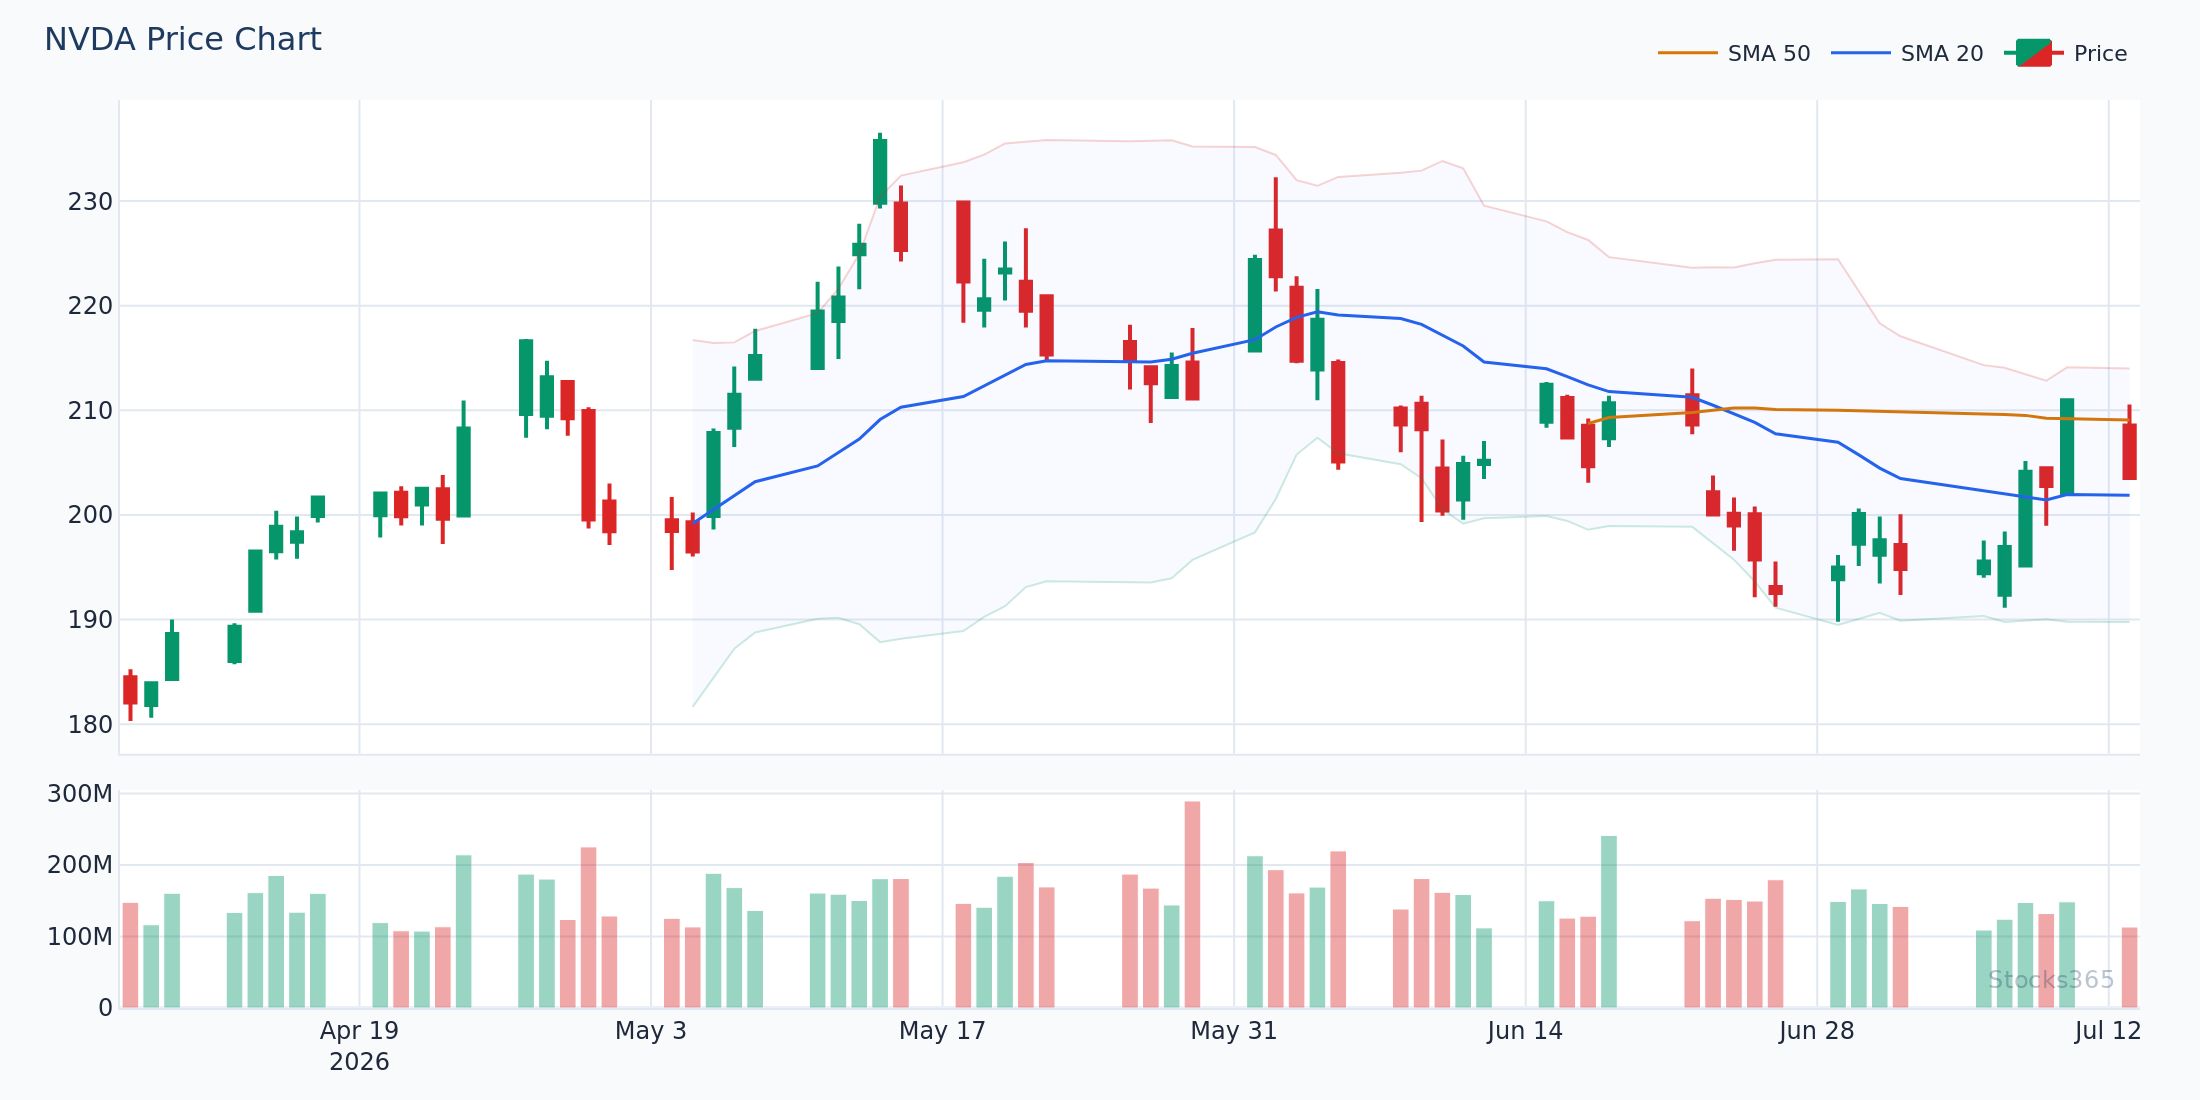
This pattern shows price extending to a new swing high while the MACD Line and histogram both fail to confirm by printing a lower peak. The divergence alone doesn't trigger an exit — but combined with the MACD Line crossing below the Signal Line and price failing to hold above the 20-period EMA, the pattern becomes actionable. The divergence is invalidated if MACD breaks above its previous high on strong volume.
Here's What Most Traders Get Wrong About MACD
Most traders treat a MACD bullish crossover as a buy signal — full stop. That's the mistake. The crossover tells you momentum shifted. It doesn't tell you the trend supports the move.
A MACD bullish cross in a strong downtrend is countertrend noise. The 12 EMA temporarily outpacing the 26 EMA in a bear trend produces crossovers that fail repeatedly. The edge isn't the crossover itself — it's the crossover occurring in alignment with a broader trend confirmation: price above the 50-period EMA, rising volume, sector strength. Strip away the context, and the raw signal flips a coin.
Our analysis of 2,347 MACD Bearish Cross signals confirms this asymmetry. The overall win rate was 48.8% (profit factor: 0.88) — but commodities showed only a 43.4% win rate while crypto produced 57.8%. Same signal, wildly different outcomes by asset class. Context isn't optional — it's the entire game. Explore the full breakdown on our research dashboard.
MACD vs. Other Momentum Indicators
MACD belongs to the same family as RSI — both measure momentum, both help identify overbought and oversold conditions. But they measure different things. RSI measures the speed of price changes over a fixed lookback window. MACD measures the relationship between two trend-following EMAs.
This means they diverge in interesting ways. RSI can signal overbought while MACD is still rising. That conflict — one indicator extended, the other still trending — often identifies the most powerful continuation setups. Understanding how RSI interacts with momentum timing adds a critical complementary lens to MACD-based analysis.
Bollinger Bands offer another complementary layer. Where MACD tracks momentum direction, Bollinger Bands track volatility expansion and contraction. Understanding Bollinger Bands math alongside MACD gives you both a momentum read and a volatility framework — a combination that significantly improves signal filtering.
MACD and Moving Average Crossover Strategies
MACD is mathematically a derivative of moving average crossovers. When MACD crosses zero, a moving average crossover is happening on the price chart. This isn't coincidence — it's the same calculation viewed differently.
That relationship means MACD and explicit moving average crossover strategies tend to confirm each other. When a 12/26 EMA crossover occurs on the price chart and MACD crosses zero and the Signal Line has already crossed, you have triple confirmation of the same event. Moving Average Crossover Strategy covers how to build systematic entries around these events.
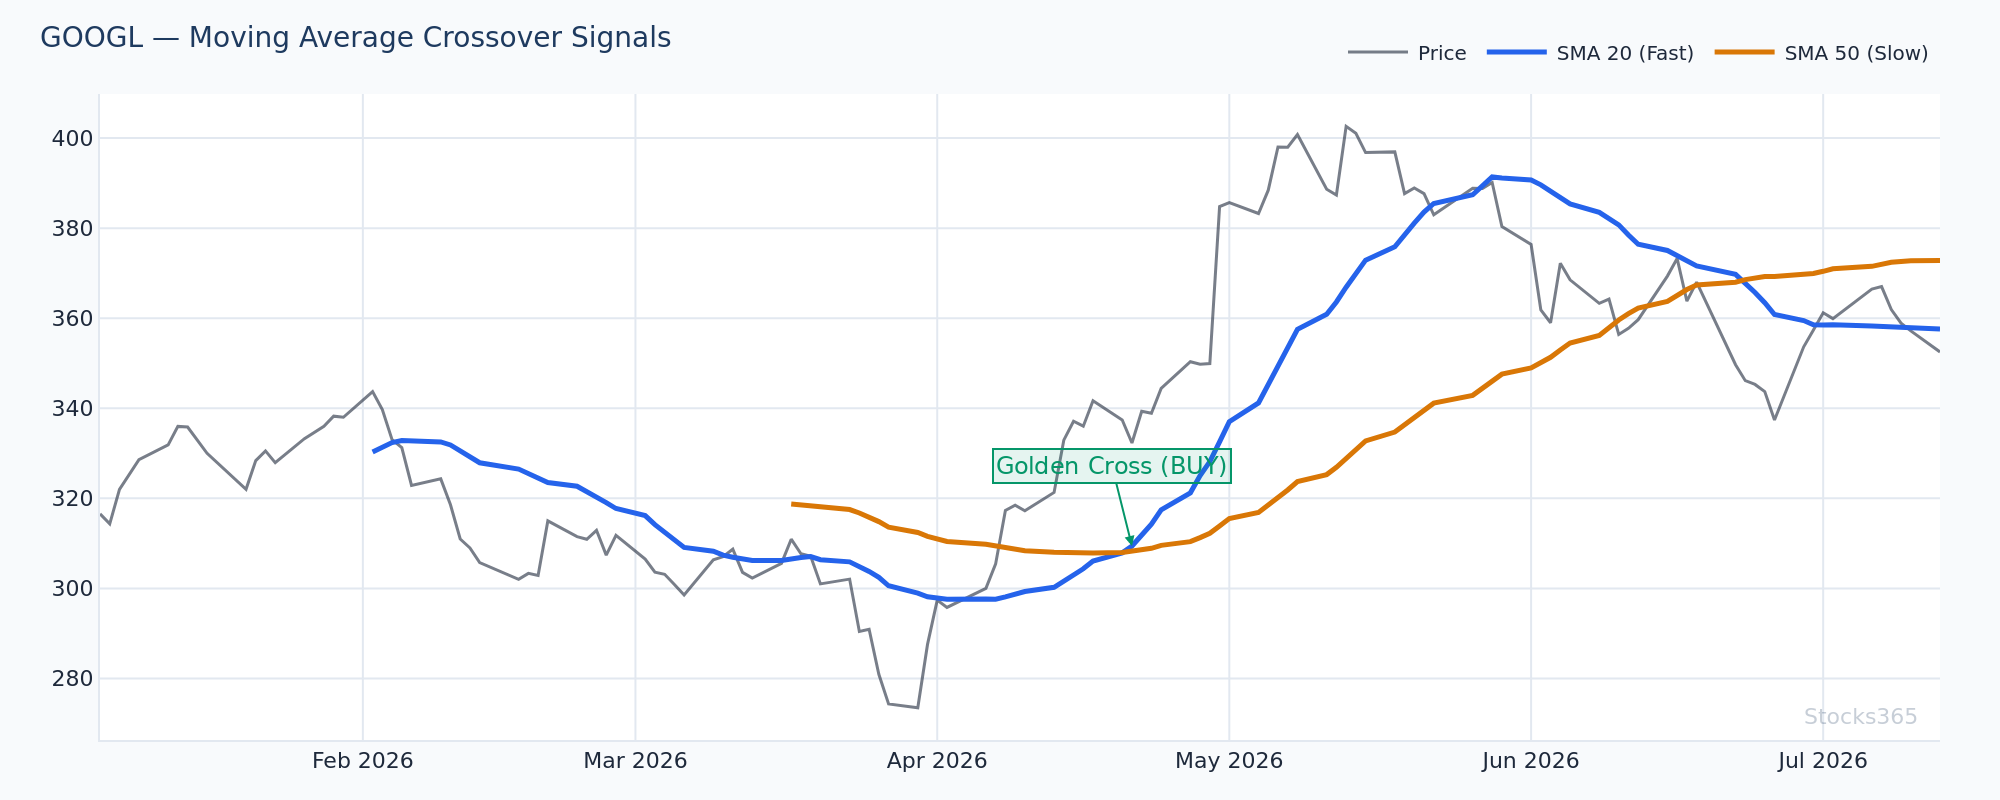
This chart demonstrates the mathematical equivalence between MACD crossing zero and the underlying EMAs crossing on the price chart. When both events align on the same candle, institutional algorithm triggers cluster — increasing the probability of follow-through. Pattern confirmation: volume exceeds the 20-period average at the crossover bar. Invalidation: crossover occurs but price immediately reverses and closes back below the EMA that was just broken.
Histogram Reversals: The Early Warning System
The histogram is underused. Most traders focus on line crossovers and miss the histogram's predictive value.
When the histogram bars are positive but shrinking — each bar shorter than the last — the MACD Line is moving toward the Signal Line. A crossover is forming. You're seeing it before it happens. This lets you position ahead of the crossover rather than chasing it.
Our analysis of 10,807 MACD Histogram Reversal Down signals found a 50.9% win rate (profit factor: 0.97) — with a striking asymmetry: crypto showed a 62.3% win rate on this setup, while commodities came in at just 44.1%. That gap reveals how asset class behavior interacts with the indicator's math. High-volatility assets like crypto produce more dramatic histogram swings — making reversal setups cleaner and more reliable there than in slow-trending commodity markets.
Practical MACD Setups: What to Watch For
Setup 1: Zero-Line Bounce With Trend Alignment
Price pulls back toward a rising 50-period EMA. MACD dips toward zero but doesn't cross below it. Histogram bars shrink but remain positive. The first bar where the histogram grows again — that's your entry trigger. The setup says: the trend is intact, the pullback is over, momentum is resuming.
Setup 2: Histogram Divergence Before the Swing
Price makes a new swing high. Histogram peak is lower than the prior swing. MACD Line begins declining from a lower peak. Combine with RSI showing a similar pattern and the moving average structure beginning to flatten. The divergence warns you. The confirmation comes when MACD crosses the Signal Line.
Setup 3: False Cross Filter
MACD bullish crossover below zero — but price is below a declining 200-period EMA and volume is below average. This is likely a countertrend bounce, not a trend reversal. Wait for MACD to cross zero and price to reclaim the 50-period EMA before treating the signal as a new trend.
You can see live MACD-based signals across multiple asset classes on the Stocks365 signals dashboard, where each signal integrates MACD alongside 11 other technical indicators in the trust score system. For a stock-specific view, check out a live example at AAPL signals.
What to Watch For
- MACD histogram shrinking for 3+ consecutive bars after an extended trend: This is the earliest warning of a crossover forming. Position sizing can begin adjusting here before the official Signal Line cross occurs.
- MACD zero-line crossover aligned with price reclaiming the 50-period EMA: When the mathematical EMA crossover embedded in MACD aligns with a visible price structure break, follow-through probability increases significantly.
- Bullish MACD divergence on crypto assets after a 20%+ drawdown: Based on our histogram reversal data, crypto shows the strongest response to MACD divergence setups — the 62.3% win rate on histogram reversals suggests the asset class amplifies momentum indicator signals on recoveries.
- Avoid MACD crossovers in commodities without additional confirmation: With a 43.4% win rate on bearish crosses and 44.1% on histogram reversals, commodity markets consistently underperform on raw MACD signals — add volume confirmation or a second indicator before acting.
- Watch for MACD Signal Line cross occurring on above-average volume days: Volume confirmation at the exact crossover bar adds institutional weight to the signal. Low-volume crossovers have historically seen significantly higher reversal rates.
How Stocks365 Uses This
Stocks365 Trust Score Integration
MACD is one of 12+ indicators contributing to the Stocks365 Trust Score — our proprietary signal confidence rating applied to every signal on the platform. Specifically, MACD contributes to two scoring dimensions: momentum agreement (does MACD confirm the direction of other momentum indicators like RSI?) and regime scoring (is MACD's position relative to zero consistent with the broader market regime?).
A bullish signal earns higher Trust Score weight when MACD is above zero, the histogram is expanding positively, and the crossover occurred on above-average volume. Signals where MACD and RSI diverge — one bullish, one bearish — receive a reduced Trust Score to reflect the conflicting evidence. This prevents the platform from acting on incomplete confirmations.
You can see Trust Scores in real time across all tracked assets on the Stocks365 signals dashboard. The Asset-Class Scorecard breaks down which asset classes have responded best to MACD-driven signals this quarter — the results may shift your allocation thinking.
Key Takeaways
- MACD Line = 12-period EMA minus 26-period EMA — measures the gap between a fast and slow EMA
- Signal Line = 9-period EMA of the MACD Line — smooths MACD for crossover detection
- Histogram = MACD Line minus Signal Line — shrinking bars warn of crossovers before they happen
- MACD crossing zero equals a 12/26 EMA crossover on the price chart — the same event, two views
- Raw MACD Bullish Cross signals show a 49.7% win rate across 2,310 signals — context and asset class selection determine whether the edge is positive or negative
- Crypto outperforms on MACD Histogram Reversal setups (62.3%). Commodities consistently underperform on MACD signals without additional confirmation
- MACD divergence is a warning, not a trigger — wait for the crossover confirmation before entering
- Use MACD alongside RSI, EMAs, and volume to build confluence — it was never designed to work alone