
ما هو المتوسط المتحرك الأسي (EMA)؟
المتوسط المتحرك الأسي (EMA) هو نوع من المتوسطات المتحركة يعطي وزنًا أكبر للبيانات السعرية الحديثة. على عكس المتوسط المتحرك البسيط الذي يتعامل مع جميع نقاط البيانات بالتساوي، يستجيب EMA بسرعة أكبر للمعلومات السعرية الجديدة — وهذه السرعة هي ما يجعله أداة قيّمة في التحليل الفني.
يستخدم المتداولون EMA لتحديد اتجاه الترند، رصد تحولات الزخم، وتوقيت نقاط الدخول والخروج بدقة عالية. يُعد من أكثر المؤشرات الفنية استخدامًا عالميًا — عبر الأسهم والعملات المشفرة والفوركس والسلع.
الفكرة الأساسية بسيطة: الأسعار الحديثة أهم من القديمة، وعلى هذا الأساس بُني المتوسط المتحرك الأسي.
معادلة EMA: كيفية الحساب
يعتمد حساب EMA على عنصرين رئيسيين: المُضاعِف (أو عامل التمهيد) وقيمة EMA السابقة.
المعادلة كالتالي:
EMA = (السعر الحالي × المُضاعِف) + (EMA السابق × (1 − المُضاعِف))
حيث: المُضاعِف = 2 ÷ (N + 1)
N = عدد الفترات
بالنسبة لمتوسط EMA لفترة 10، يكون المُضاعِف: 2 ÷ (10 + 1) = 0.1818. أما لفترة 20، فيصبح 2 ÷ (20 + 1) = 0.0952. كلما قصرت الفترة، ارتفع المُضاعِف — ما يعني أن الأسعار الحديثة تحمل وزنًا أكبر.
لبدء الحساب، استخدم المتوسط المتحرك البسيط كقيمة EMA الأولى، ثم طبّق المعادلة أعلاه على القيم التالية.
مثال خطوة بخطوة لحساب EMA
لنفترض أنك تحسب EMA لفترة 3 على سلسلة أسعار إغلاق:
- اليوم 1: 100
- اليوم 2: 102
- اليوم 3: 104 → SMA = (100+102+104)/3 = 102 (أول قيمة EMA)
- اليوم 4: 106 → EMA = (106 × 0.5) + (102 × 0.5) = 104
- اليوم 5: 108 → EMA = (108 × 0.5) + (104 × 0.5) = 106
المُضاعِف لفترة 3 = 2 ÷ (3 + 1) = 0.5. لاحظ كيف يلتقط EMA الأسعار الصاعدة بسرعة — هذه الاستجابة السريعة هي الميزة الكاملة للمؤشر.
يُظهر الرسم البياني المتوسط الأقصر (9 فترات) يلاصق السعر عن كثب، بينما المتوسط الأطول (21 فترة) يوفر خط اتجاه أكثر استقرارًا. عندما يرتد السعر إلى 21 EMA بعد اتجاه صاعد قوي، راقب أنماط الشموع الصعودية كتأكيد للاستمرار. إغلاق تحت 21 EMA — خاصة على حجم تداول أعلى من المتوسط — يُبطل الإعداد ويشير إلى ضعف محتمل في الترند.
الفرق الحقيقي بين EMA و SMA
المتوسط المتحرك البسيط (SMA) يحسب متوسط جميع الأسعار في فترته بالتساوي. إذا كنت تستخدم SMA لـ20 فترة، فإن كل شمعة من هذه الـ20 لها التأثير ذاته على الناتج. هذا ينشئ تأخرًا — أحيانًا تأخرًا كبيرًا.
يعالج EMA هذه المشكلة بإعطاء وزن أكبر لأسعار الإغلاق الحديثة. النتيجة: خط ينعطف مبكرًا، يتتبع السعر بإحكام أكبر، وينتج إشارات أسرع. المقايضة هي الحساسية: ينتج EMA إشارات خاطئة أكثر في الأسواق المتذبذبة الجانبية.
متى تستخدم EMA أو SMA
- EMA: أفضل في الأسواق ذات الاتجاهات الواضحة، التداول بالزخم، والإعدادات قصيرة إلى متوسطة الأجل
- SMA: أفضل لتحديد بنية الاتجاه طويل الأمد، تصفية الضوضاء، التداول المتأرجح في ظروف النطاقات
- معًا: استخدام EMA للدخول وSMA لتأكيد الاتجاه يشكّل مزيجًا قويًا
لا يوجد أفضلية مطلقة لأحدهما — السياق هو ما يحدد الأداة الأنسب.
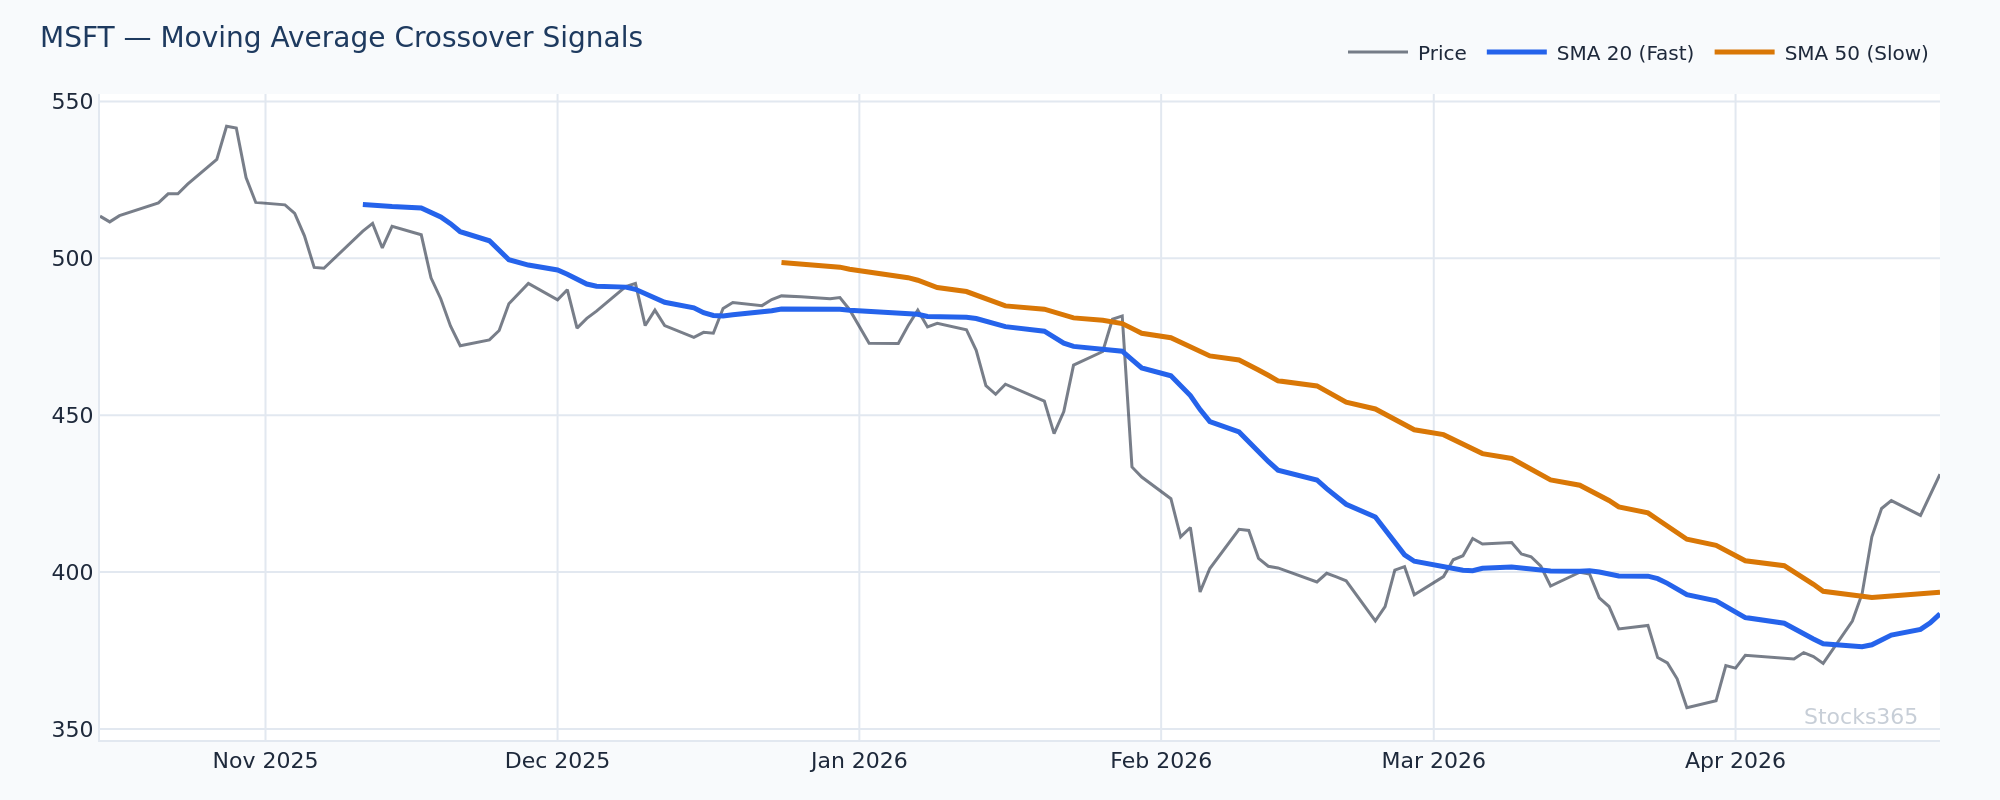
تُظهر المقارنة EMA ينعطف قبل SMA خلال مرحلة تسارع السعر. ينتج EMA إشارة تقاطع قبل عدة شموع من استجابة SMA، ما يمنح المتداولين دخولًا أبكر إلى الحركة. إذا انعكس السعر بسرعة بعد إشارة EMA لكن SMA لم يتقاطع بعد، فهذا غالبًا يشير إلى اختراق كاذب — استخدم هذا التباين كإشارة تحذيرية.
فترات EMA الأكثر شيوعًا ودلالاتها
تخدم فترات EMA المختلفة أغراضًا استراتيجية متنوعة. إليك الإعدادات الأكثر استخدامًا:
فترات EMA القصيرة (5، 9، 10)
تستجيب هذه المتوسطات فورًا تقريبًا لتغيرات السعر. يستخدمها متداولو اليوم والمضاربون السريعون للتقاط تحولات الزخم اللحظية. تولّد إشارات متكررة — ما يعني أيضًا ضوضاء أكثر. استخدمها فقط في ظروف اتجاهات واضحة.
فترات EMA المتوسطة (20، 21، 50)
متوسطات 20 و21 فترة هي أدوات العمل الأساسية للتداول المتأرجح. يستخدم السعر هذه المستويات بانتظام كدعم ومقاومة ديناميكية في الأسواق ذات الاتجاهات. أما 50 EMA فيحدد الاتجاه المتوسط — يراقبه كثير من المتداولين المؤسسيين عن كثب.
فترات EMA الطويلة (100، 200)
يُعتبر 200 EMA على الأرجح المتوسط المتحرك الأكثر مراقبة على أي إطار زمني. تداول السعر فوق 200 EMA = بنية سوق صعودية عمومًا. تحته = هبوطية. بسيط، قوي، محترم على نطاق واسع.
للحصول على سياق أعمق حول دمج المتوسطات المتحركة مع مذبذبات الزخم، راجع دليلنا حول كيفية استخدام RSI في التداول: الدليل الشامل خطوة بخطوة.
استراتيجيات التداول بـEMA مع أمثلة حقيقية
الاستراتيجية الأولى: التقاطع بين متوسطين
تقاطع EMA هو الإشارة الكلاسيكية للدخول. استخدم متوسطين — واحد أسرع وآخر أبطأ. عندما يتقاطع السريع فوق البطيء، تلك إشارة صعودية؛ وعندما يتقاطع تحته، إشارة هبوطية.
إعداد شائع: تقاطع 9 EMA مع 21 EMA على الرسم البياني اليومي. عندما يتقاطع 9 EMA فوق 21 EMA بينما السعر أيضًا فوق 50 EMA، يُؤكد التوافق الاتجاهي. انتظر إغلاق شمعة التقاطع قبل الدخول. تأكيد الحجم يعزز الإعداد بشكل كبير.
تجاهل التقاطعات التي تحدث داخل نطاق توحيد ضيق — تفشل في الغالب.
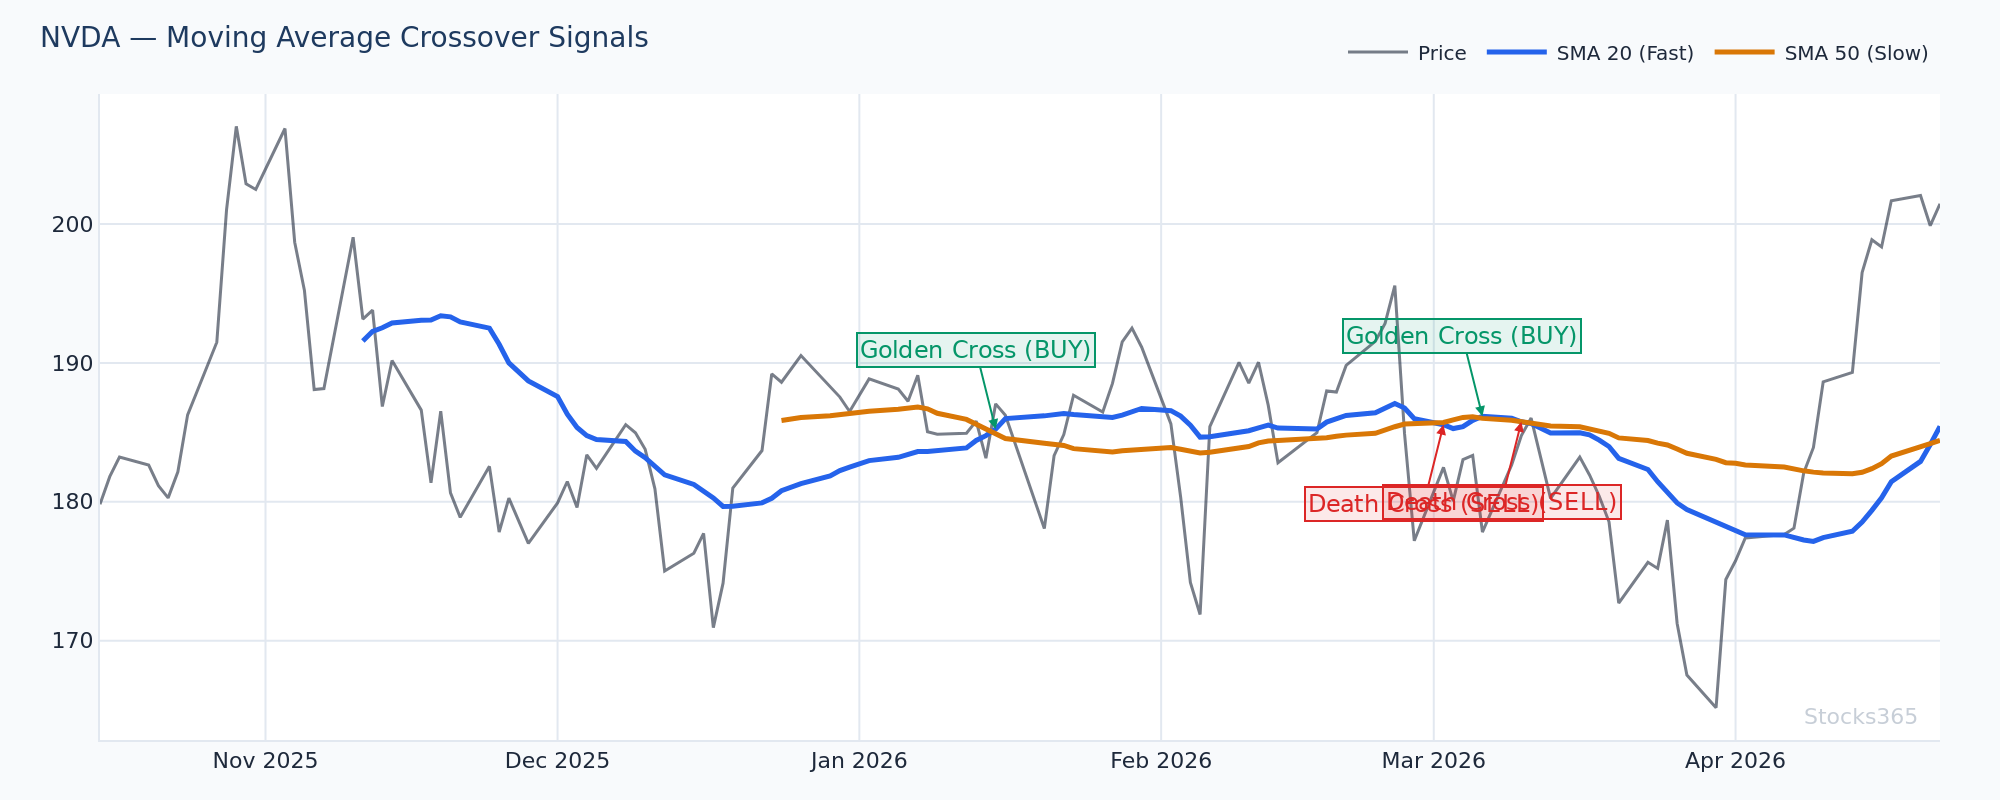
يبرز الرسم تقاطع صعودي بين 9/21 EMA يتشكل بعد فترة توحيد. استعاد السعر 50 EMA قبل اكتمال التقاطع — هذا التوافق عبر ثلاثة متوسطات هو المرشح عالي الاحتمالية. يأتي التأكيد عندما تُظهر الشمعة التي تُغلق فوق نقطة التقاطع حجمًا يتجاوز متوسط 20 فترة؛ بدون حجم، تبقى الإشارة مشكوكًا فيها.
الاستراتيجية الثانية: EMA كدعم ومقاومة ديناميكية
في اتجاه صاعد صحي، يرتد السعر مرارًا إلى متوسط EMA رئيسي — الـ20 أو 21 — ثم يرتد. يعمل هذا المتوسط كدعم ديناميكي. نمط الدخول: يرتد السعر إلى EMA، يشكل شمعة رفض صعودية (مطرقة، ابتلاع، شمعة دبوس)، ثم يستأنف الاتجاه.
المنطق نفسه ينطبق على الاتجاهات الهابطة. يرتفع السعر إلى 20 EMA، يُرفض، ويستمر في الانخفاض. يعمل EMA كمقاومة ديناميكية.
هذا من أنظف الإعدادات وأكثرها تكرارًا في التداول الفني. أتقنه أولًا على الرسم البياني اليومي.
الاستراتيجية الثالثة: شريط EMA
يجمع شريط EMA عدة متوسطات معًا — مثلًا 8، 13، 21، 34، 55. عندما ينفتح الشريط ويجلس السعر فوق جميع الخطوط، يكون الاتجاه قويًا. عندما تنضغط الأشرطة وتبدأ في التشابك، يتوقف الزخم ومن المحتمل حدوث انعكاس أو توحيد.
يمنحك الشريط قراءة بصرية فورية لصحة الاتجاه، دون حاجة لأي حساب إضافي.
دمج EMA مع مؤشرات أخرى
المتوسط المتحرك الأسي قوي بمفرده، لكن عند دمجه مع المؤشرات الصحيحة يصبح أداة عالية الدقة.
EMA + RSI
عندما يرتد السعر إلى 20 EMA في اتجاه صاعد وينخفض مؤشر القوة النسبية (RSI) في الوقت نفسه إلى منطقة 40-50 (إعادة ضبط RSI صعودية)، يزداد احتمال الارتداد بشكل ملحوظ. تحصل على توافق اتجاهي من EMA وتأكيد زخم من RSI — مرشحان، صفقة واحدة.
للحصول على تحليل كامل لآليات RSI، اقرأ دليلنا حول كيف يُحسب RSI: المعادلة موضحة خطوة بخطوة. فهم كلا المؤشرين على مستوى المعادلة يجعلك متداولًا أفضل.
تباعد RSI يضيف طبقة أخرى. عندما يصنع السعر قمة جديدة لكن RSI يفشل في التأكيد، والسعر ممتد فوق EMA، فإن هذا المزيج من التباعد والامتداد المفرط هو تحذير انعكاس عالي الجودة. راجع دليلنا الكامل حول تباعد RSI موضح: إتقان الإشارات الصعودية والهبوطية.
EMA + حجم التداول
الحجم يصدّق إشارات EMA. تقاطع EMA على حجم منخفض مشكوك فيه. نفس التقاطع على حجم 1.5x إلى 2x المتوسط؟ يستحق المراقبة. الحجم هو القناعة وراء حركة السعر — لا تتجاهله أبدًا.
EMA + بولينجر باند
خط بولينجر الأوسط عادة SMA لـ20 فترة. استبداله بـ20 EMA يمنحك نطاقًا أكثر استجابة يتتبع السعر بدقة أكبر في الأسواق السريعة. عندما يلمس السعر النطاق السفلي بينما يجلس على 20 EMA في اتجاه صاعد، يكون للإعداد دعم مزدوج — منطقة دخول عالية العائد.
أخطاء شائعة يرتكبها المتداولون مع EMA
معظم المتداولين يعاملون تقاطع EMA كإشارة دخول فورية. يرون 9 EMA يتقاطع فوق 21 EMA ويشترون على الفور — دون فحص سياق الاتجاه، دون فحص الحجم، دون فحص الإطار الزمني الأوسع. في سوق متذبذب عديم الاتجاه، تفشل تقاطعات EMA باستمرار. EMA أداة تتبع اتجاه — تعمل جيدًا فقط عندما يكون هناك اتجاه لتتبعه.
الحل هو مرشح بسيط من خطوتين: 1) تحقق مما إذا كان السعر فوق أو تحت 50 EMA أو 200 EMA. اقبل فقط إشارات EMA الصعودية عندما يكون الاتجاه الأكبر صعوديًا. 2) اشترط حجمًا أعلى من المتوسط على شمعة الإشارة. إن لم يتحقق هذان المرشحان، تجاوز الصفقة. هذا التعديل الواحد يزيل معظم الإشارات الخاطئة التي تدمر استراتيجيات EMA.
شيء آخر: تأخر EMA لا يزال موجودًا. مُخفّض مقارنة بـSMA، لكنه لا يختفي كليًا أبدًا. احسب دائمًا للتأخير.
يلتقط الرسم ارتدادًا نموذجيًا للدعم الديناميكي حيث يرتد السعر إلى 21 EMA في منتصف الاتجاه ويشكل شمعة ابتلاع صعودية. التفصيل الحاسم هو أن الاتجاه الأوسع يبقى سليمًا — الـ50 EMA ينحدر صعودًا ولم يُغلق السعر تحته أبدًا. لو اخترق السعر 50 EMA بقناعة، لبطلت فرضية الدعم الديناميكي فورًا.
EMA على أطر زمنية مختلفة
يعمل EMA على كل إطار زمني — لكن الإشارات تحمل وزنًا مختلفًا. تقاطع 20 EMA على الرسم البياني الأسبوعي يختلف كثيرًا عن التقاطع نفسه على رسم 5 دقائق.
التحليل متعدد الأطر الزمنية هو المنهج الاحترافي. حدد الاتجاه على الرسم الأسبوعي أو اليومي باستخدام متوسطات أطول (50، 200). ثم انزل إلى رسم 4 ساعات أو ساعة واحدة لإيجاد نقاط دخول دقيقة باستخدام متوسطات أقصر (9، 20). وافِق اتجاه صفقتك مع اتجاه الإطار الزمني الأعلى. اقبل فقط إشارات الإطار الأدنى التي تشير في الاتجاه نفسه.
التحليل من الأعلى للأسفل — دائمًا.
EMA في العملات المشفرة والأسهم والفوركس
يؤدي EMA بشكل مختلف حسب فئة الأصول وملف تقلبها.
في أسواق العملات المشفرة، تعمل فترات EMA القصيرة (9، 20) جيدًا لالتقاط حركات الزخم السريعة. تميل اتجاهات العملات المشفرة لأن تكون حادة وحاسمة — ميزة سرعة EMA تُعظّم هنا. في الأسهم، يراقب المتداولون المؤسسيون 20 و50 EMA عن كثب. تفاعلات السعر مع هذه المستويات غالبًا ما تنتج إعدادات موثوقة على الرسم اليومي. في الفوركس، الأكثر فعالية هو استخدام EMA على أطر زمنية أعلى بسبب الطبيعة المتقلبة لتحركات العملات قصيرة الأجل.
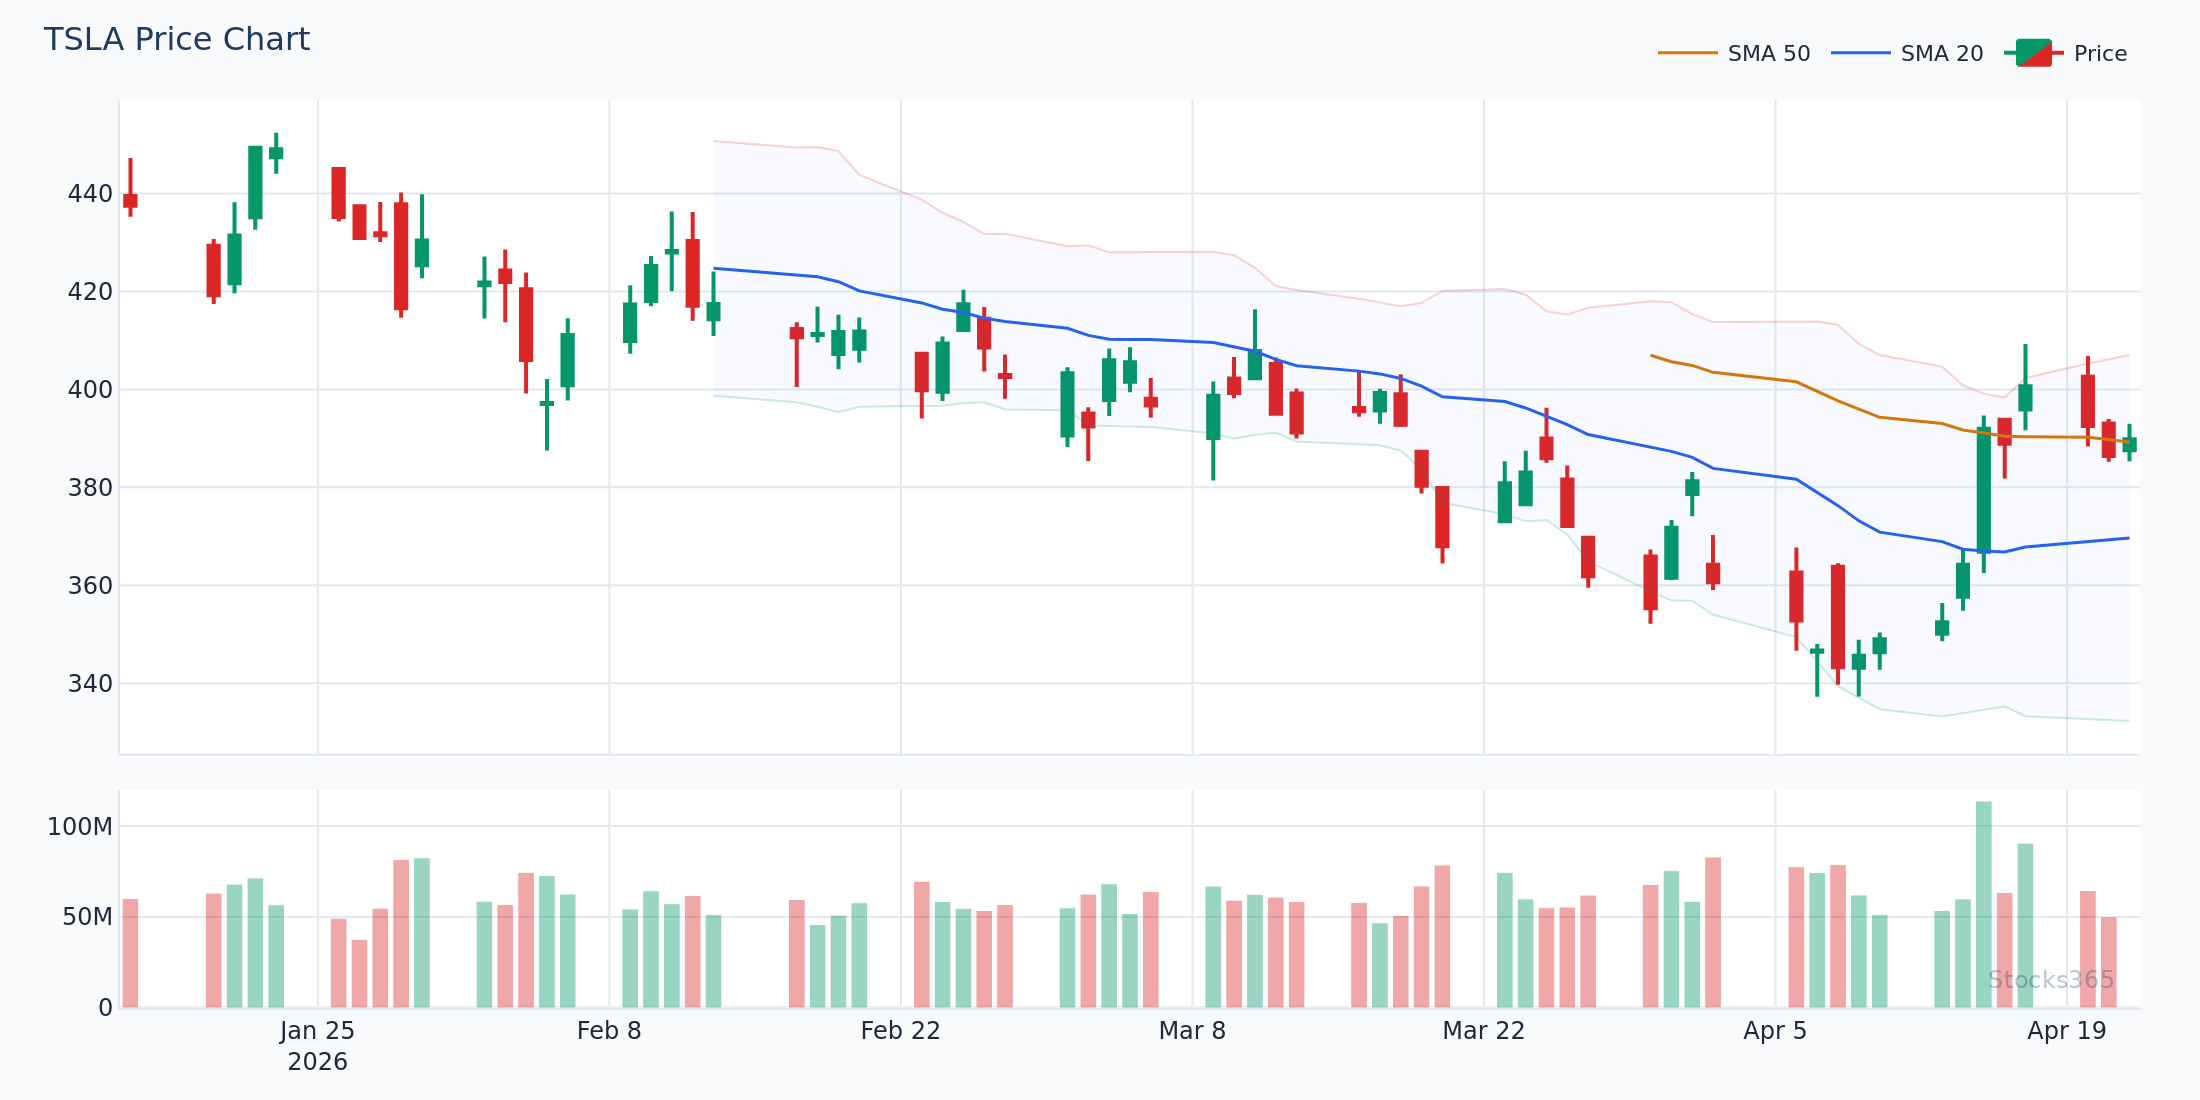
يُظهر تحليلنا لـ3,332 إشارة أن الاستراتيجيات القائمة على تقاطعات السعر حول مستوى SMA 20 تنتج نسبة فوز 50.9% إجمالًا — مع العملات المشفرة في المقدمة بنسبة 66.8% والفوركس متأخرًا عند 42.5% فقط. بينما تغطي هذه البيانات SMA وليس EMA تحديدًا، فإن ديناميكيات فئات الأصول ذات صلة مباشرة: الطبيعة الاتجاهية للعملات المشفرة تعزز جودة إشارات المتوسطات المتحركة. راجع مجموعة البيانات الكاملة في Stocks365 Insights.
إعدادات EMA الشائعة حسب أسلوب التداول
- المضاربة السريعة (رسوم 1-15 دقيقة): 5 EMA، 9 EMA، 20 EMA
- التداول اليومي (رسوم 15 دقيقة - ساعة): 9 EMA، 21 EMA، 50 EMA
- التداول المتأرجح (رسوم 4 ساعات - يومي): 20 EMA، 50 EMA، 200 EMA
- التداول المركزي (رسوم أسبوعية): 50 EMA، 100 EMA، 200 EMA
ابدأ بالإعدادات المناسبة لإطارك الزمني، ثم حسّن بناءً على نتائج اختبارات تاريخية فعلية — وليس ما يبدو مثيرًا على وسائل التواصل الاجتماعي.
للحصول على إرشادات حول تحسين فترات المؤشرات لاستراتيجيتك المحددة، يغطي مقالنا حول إعدادات RSI: إتقان أفضل فترة لاستراتيجيتك مبادئ التحسين نفسها التي تنطبق مباشرة على اختيار فترة EMA.
محددات EMA التي تحتاج معرفتها
المتوسط المتحرك الأسي ليس حلًّا سحريًا. اعرف نقاط ضعفه.
- مؤشر متأخر: يُشتق EMA دائمًا من الأسعار السابقة. يؤكد الاتجاهات — لا يتنبأ بها.
- مخاطر التذبذب الكاذب: في الأسواق الجانبية، ينتج EMA تقاطعات خاطئة متكررة. رشّح بسياق الاتجاه.
- مقايضة الحساسية مقابل الموثوقية: متوسطات EMA الأقصر أسرع لكن أقل موثوقية. الأطول أكثر موثوقية لكن أبطأ. لا يوجد إعداد مثالي.
- الاعتماد المفرط: استخدام EMA فقط دون حجم أو زخم أو سياق بنية السعر يؤدي لقرارات ضعيفة.
استخدم EMA كطبقة واحدة من تحليلك — وليس الأساس الكامل.
مقارنة مذبذبات الزخم إلى جانب تحليل EMA يصقل عملية اتخاذ القرار. دليل RSI مقابل Stochastic Oscillator مرجع مفيد لفهم أي مذبذب يتناسب أفضل مع أنظمة المتوسطات المتحركة.
ما يجب مراقبته
- توافق تراص EMA على الرسم اليومي: عندما يكون 9 EMA فوق 21 EMA، وهذا فوق 50 EMA، والسعر فوق الجميع، يبقى زخم الاتجاه سليمًا تمامًا. غالبًا ما تنتج هذه الإعدادات أنظف حركات الاستمرار — خاصة على الارتداد الأول إلى 21 EMA.
- استعادة السعر لـ200 EMA بعد فترة طويلة تحته: هذا النمط، خاصة عند مصاحبته لتوسع في الحجم، كثيرًا ما يشير إلى بداية اتجاه صاعد مستدام جديد. أول إغلاق فوق 200 EMA هو الإشارة التي يجب مراقبتها.
- ضغط EMA قبل الأرباح أو محفزات كبرى: عندما تتقارب 9، 20، و50 EMA وتتشدد على رسم يومي قبل حدث محفز، تميل الحركة اللاحقة لأن تكون حادة واتجاهية. اتجاه الاختراق بعد انفصال المتوسطات يحدد الصفقة.
- رفض EMA السريع عند 200 EMA في اتجاه هابط: عندما يرتفع متوسط قصير الفترة (9 أو 20) لاختبار 200 EMA من الأسفل خلال اتجاه هابط، ويشكل السعر شمعة انعكاس هبوطية عند ذلك المستوى، غالبًا ما يؤدي الإعداد إلى استئناف الاتجاه الهابط. هذا نمط دخول بيع عالي الجودة على الرسم اليومي أو 4 ساعات.
- تباعد RSI المخفي يؤكد دخول ارتداد EMA: عندما يرتد السعر إلى 20 EMA في اتجاه صاعد ويشكل قاعًا أعلى بينما يُظهر RSI قاعًا أدنى، فإن هذا التباعد الصعودي المخفي يؤكد إعداد استمرار الاتجاه. تعرّف على المزيد حول هذه الإشارة المتقدمة في دليلنا حول التباعد المخفي لـRSI.
كيف تستخدم Stocks365 المتوسط المتحرك الأسي
في Stocks365، يُعد المتوسط المتحرك الأسي أحد أكثر من 12 مؤشرًا فنيًا يغذي نظام درجة الثقة (Trust Score). تُقيّم درجة الثقة كل إشارة من حيث التوافق بين المؤشرات — وموضع EMA عنصر أساسي في طبقة حالة السوق.
على وجه التحديد، عندما تُطلق إشارة على سهم أو أصل، يفحص النظام توافق EMA عبر أطر زمنية متعددة: ما إذا كان السعر فوق أو تحت متوسطات رئيسية قصيرة ومتوسطة وطويلة الأجل. التوافق القوي — السعر فوق 20، 50، و200 EMA في آن واحد، مع ترتيب المتوسطات تصاعديًا — يرفع درجة ثقة الاتجاه. الإشارات المتضاربة عبر الأطر الزمنية تخفضها.
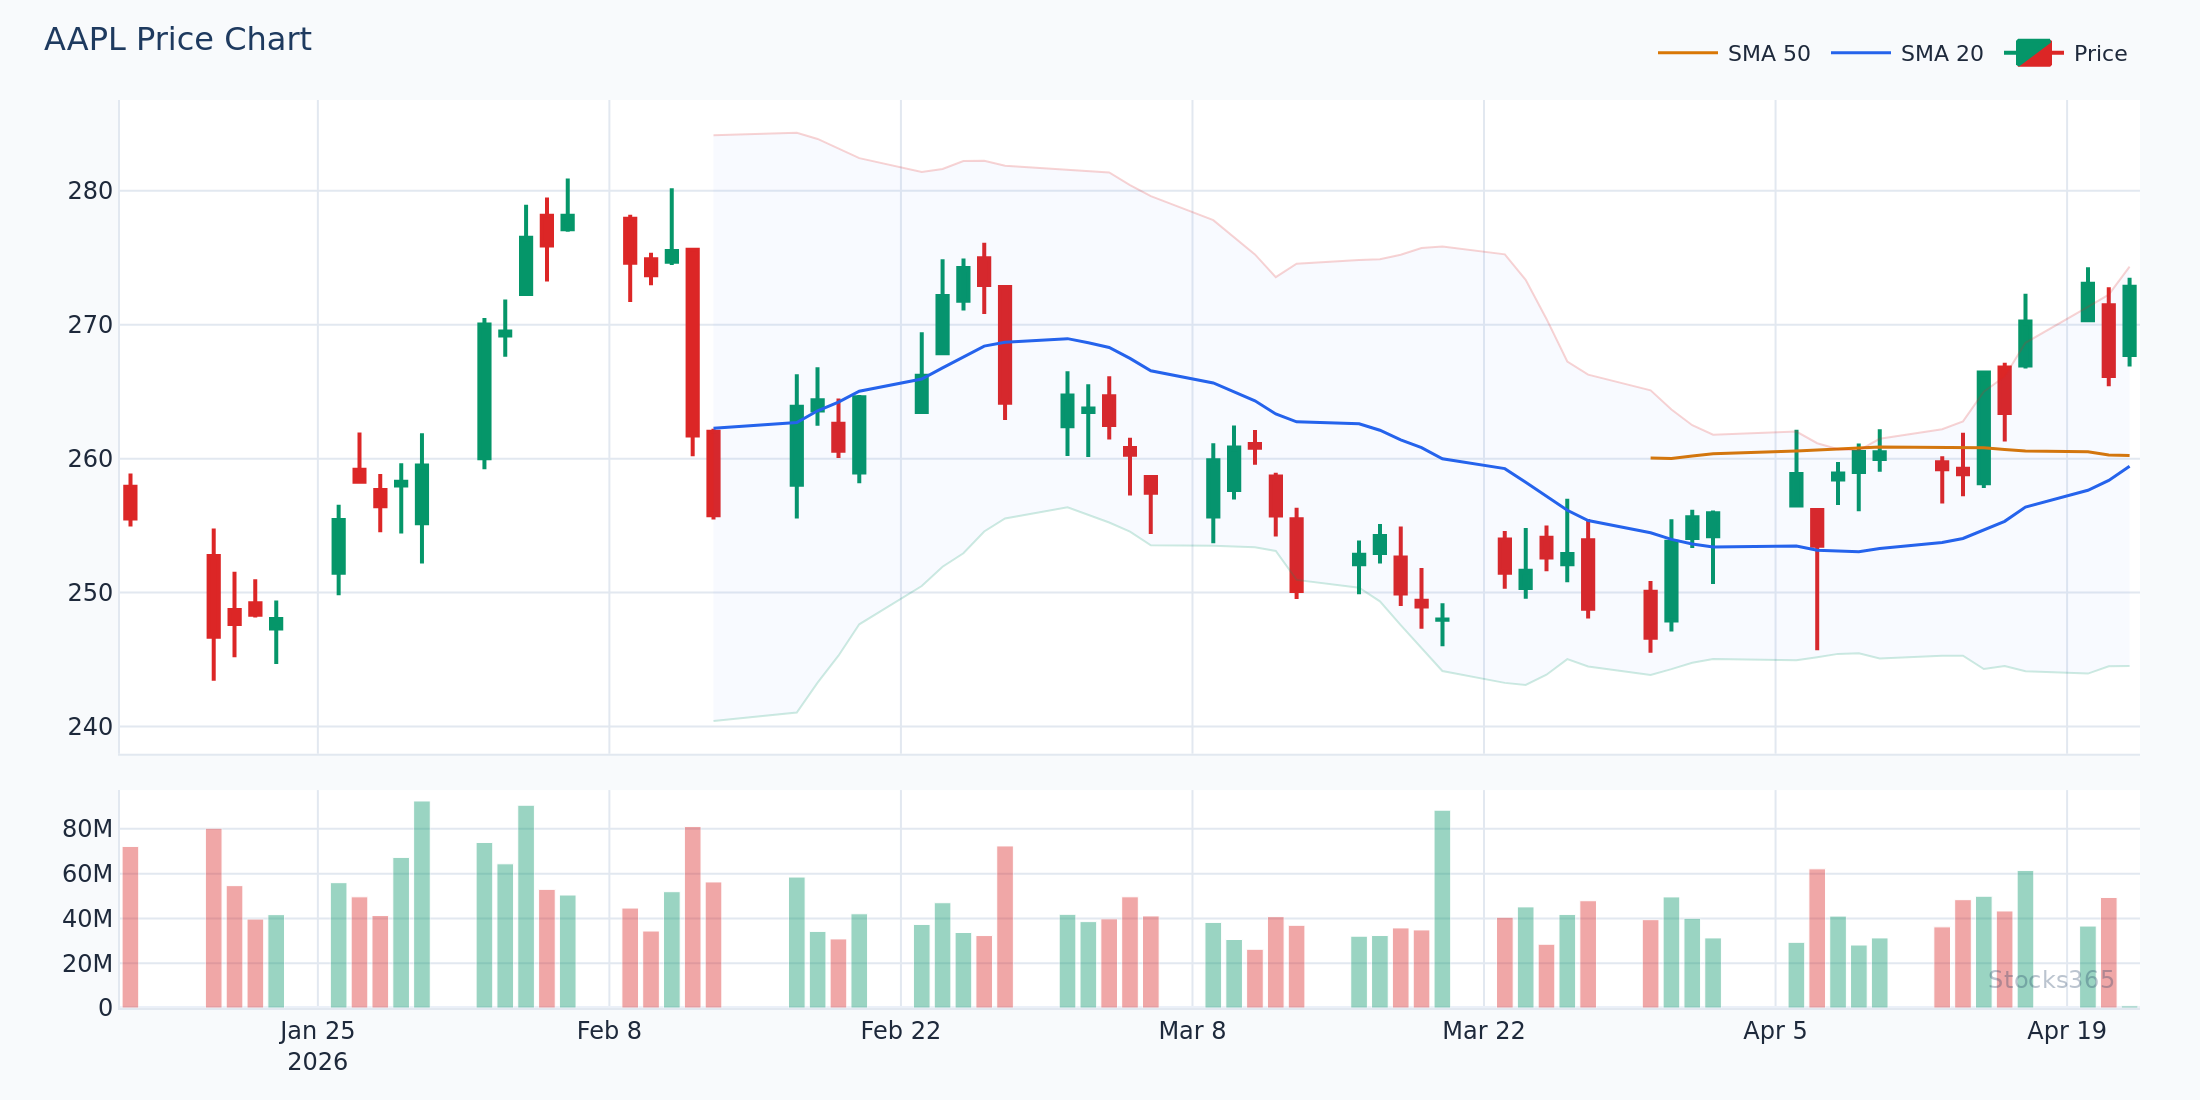
هذا مهم لأن بحث Stocks365 عبر 3,289 إشارة وجد أن تقاطع السعر فوق SMA 20 ينتج نسبة فوز 48.3% فقط إجمالًا (عامل الربح: 0.88) — لكن الأداء يتحسن بشكل ملحوظ عندما تحدث الإشارة مع تأكيد اتجاه أوسع. صُممت درجة الثقة لإظهار الإعدادات الأعلى قناعة فقط. يمكنك استكشاف الإشارات المباشرة مع بيانات درجة الثقة الكاملة في لوحة تحكم Stocks365 أو فحص إشارات فردية مثل إشارات AAPL لرؤية بيانات حالة EMA فعليًا.