
Why RSI Is a Game-Changer for Options Traders in 2026
Options trading rewards precision. Unlike buying or shorting shares outright, every options position is a race against time — and nothing destroys a well-reasoned directional bet faster than bad timing. That's exactly where the Relative Strength Index (RSI) earns its place in a serious options trader's toolkit.
RSI options trading isn't just about slapping an oscillator on a chart and hoping for the best. It's about using momentum data to identify when a move is overextended, when it's about to reverse, and when the conditions are right to enter a position with a defined risk/reward profile. In an environment where implied volatility can spike or collapse overnight, timing your options entries with RSI momentum signals can mean the difference between a 150% winner and a total wipeout.
If you're completely new to the indicator, start with What Is RSI? The Complete Beginner's Guide before diving into options-specific applications. For those already familiar with the basics, let's explore how RSI transforms options timing from guesswork into a systematic, repeatable process.
Understanding RSI Momentum in the Context of Options
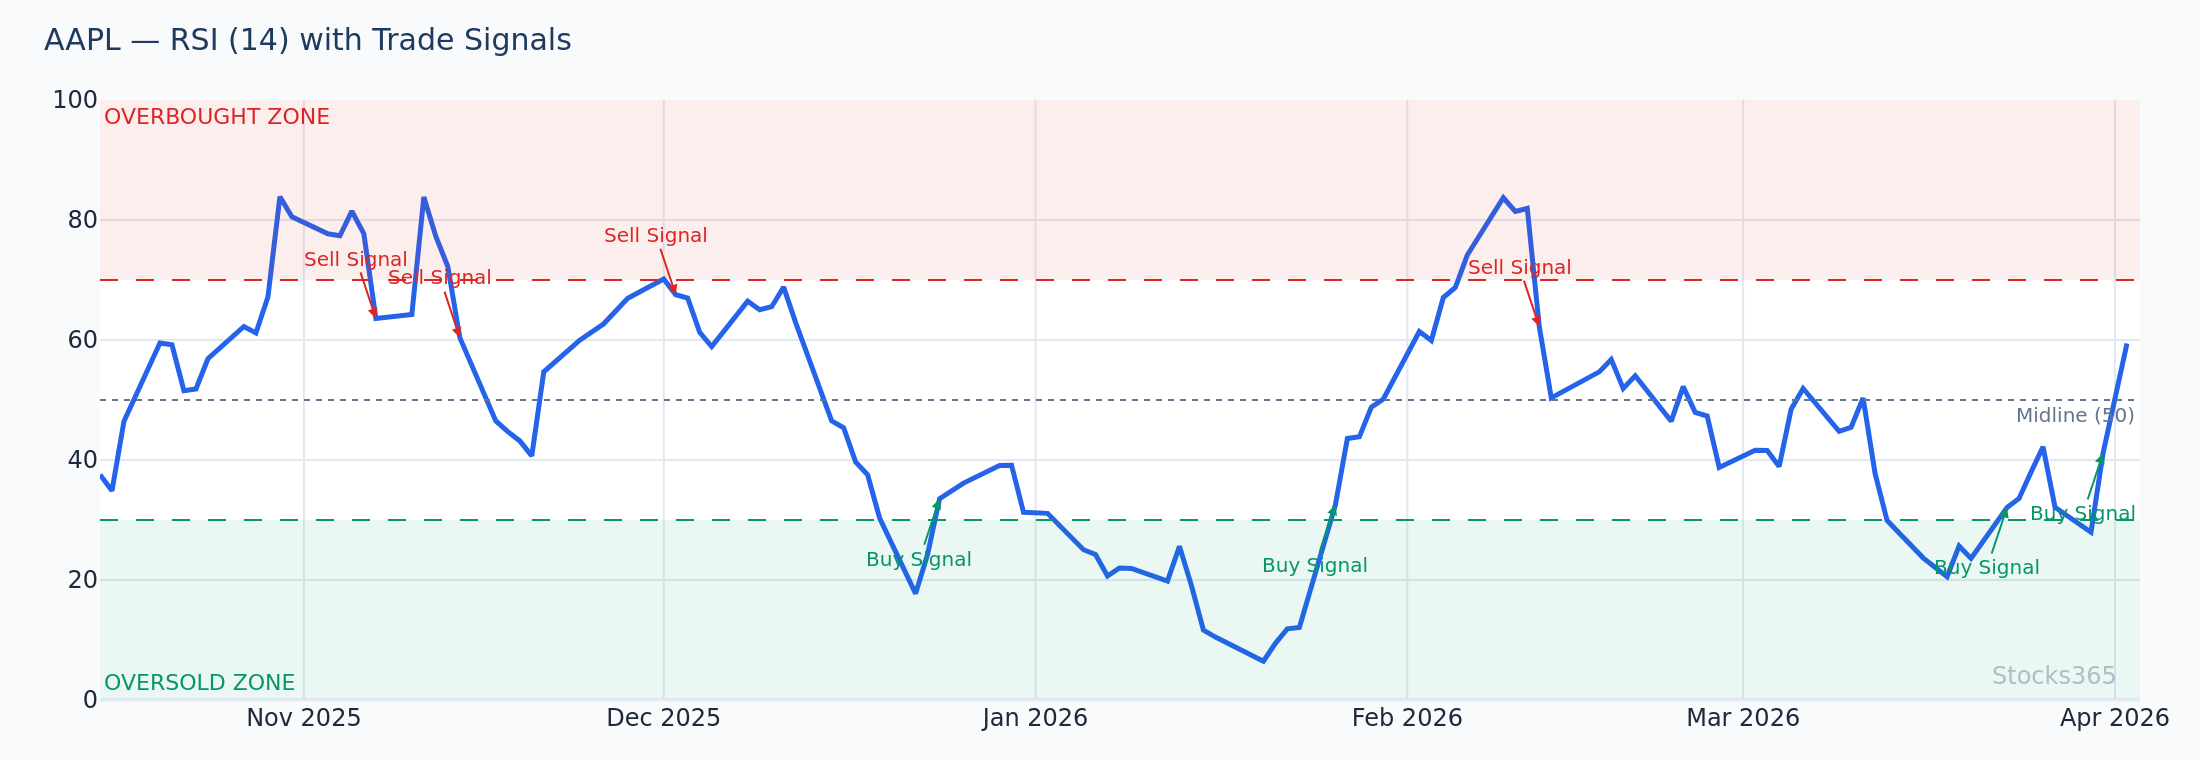
RSI measures the speed and magnitude of price changes on a scale from 0 to 100. When RSI climbs above 70, the asset is considered overbought — momentum is stretched, and a pullback or reversal becomes statistically more likely. When RSI drops below 30, the asset is oversold, and a bounce becomes increasingly probable.
For options traders, these signals carry a specific implication: overbought RSI conditions favor put purchases or call selling strategies, while oversold conditions favor call purchases or put selling strategies. But the application goes much deeper than that binary framework.
Understanding how RSI is calculated helps you interpret the signal with nuance. The default 14-period RSI smooths out enough noise to be actionable on daily charts — ideal for options with 30-60 day expirations — while shorter periods like RSI(7) generate faster signals suited to weekly options plays.
The Time-Decay Problem RSI Helps Solve
Theta decay — the erosion of an option's time value — accelerates as expiration approaches. An options trader who enters a position two weeks too early on a mean-reversion play might watch their premium evaporate even as the eventual move plays out perfectly. RSI helps compress that timing window by confirming momentum exhaustion before you commit capital.
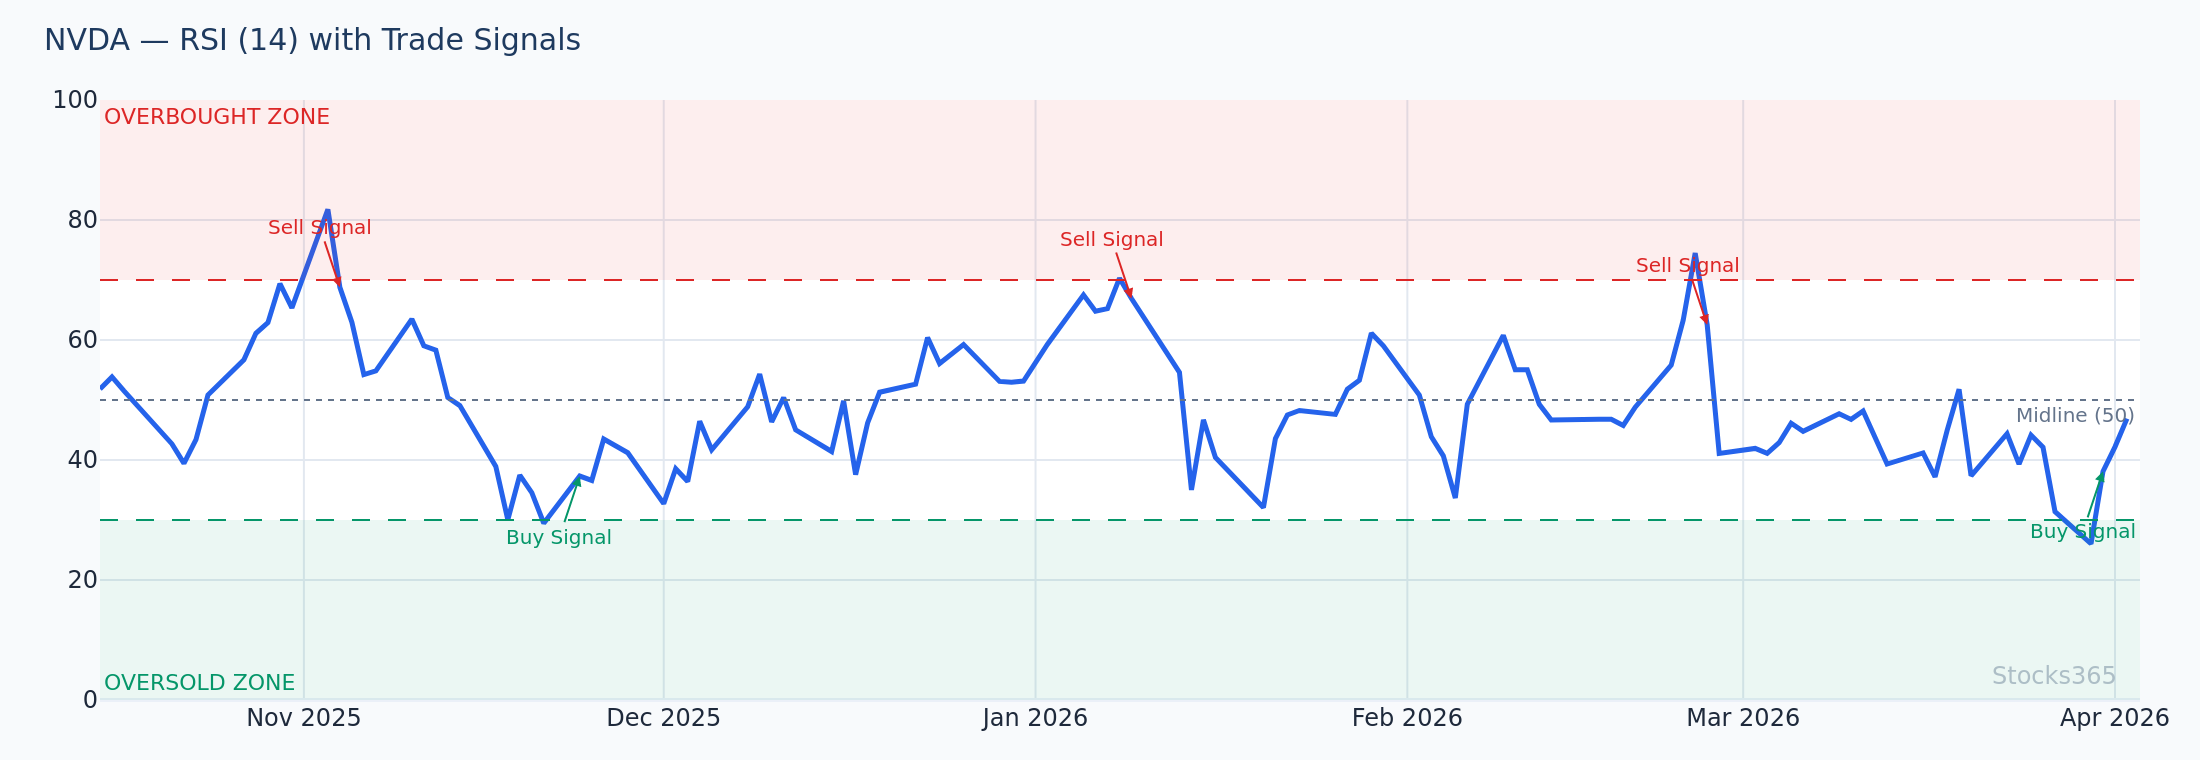
Consider a practical example: NVDA is trading at $142 in early 2026 after a three-week rally. RSI(14) on the daily chart reads 76 — firmly overbought. Rather than buying puts immediately based on the overbought reading alone, an experienced RSI options trader waits for RSI to cross back below 70 (the bearish RSI signal confirmation) before purchasing 30-day puts at the $138 or $135 strike. This cross below 70 adds confirmation that momentum is actually turning, not just pausing.
For a complete breakdown of overbought and oversold thresholds, see our guide on RSI Overbought and Oversold Levels.
Core RSI Options Trading Strategies
Strategy 1: RSI Reversal Plays with Directional Options
The most straightforward RSI options strategy involves buying directional options when RSI signals extreme conditions combined with a confirming price pattern. Here's the structured approach:
- Identify the extreme: Wait for RSI to reach above 75 (for puts) or below 25 (for calls) on the daily or 4-hour chart
- Confirm with price action: Look for a bearish engulfing candle, shooting star, or gap reversal (for puts) — or a hammer, bullish engulfing, or morning star (for calls)
- Enter on RSI confirmation: Trigger the options entry when RSI crosses back through the 70 or 30 threshold
- Select expiration: Choose 21-45 DTE (days to expiration) to give the trade time to develop while limiting excessive theta decay
- Strike selection: Buy slightly out-of-the-money options (1-2 strikes away from current price) to balance cost with delta exposure
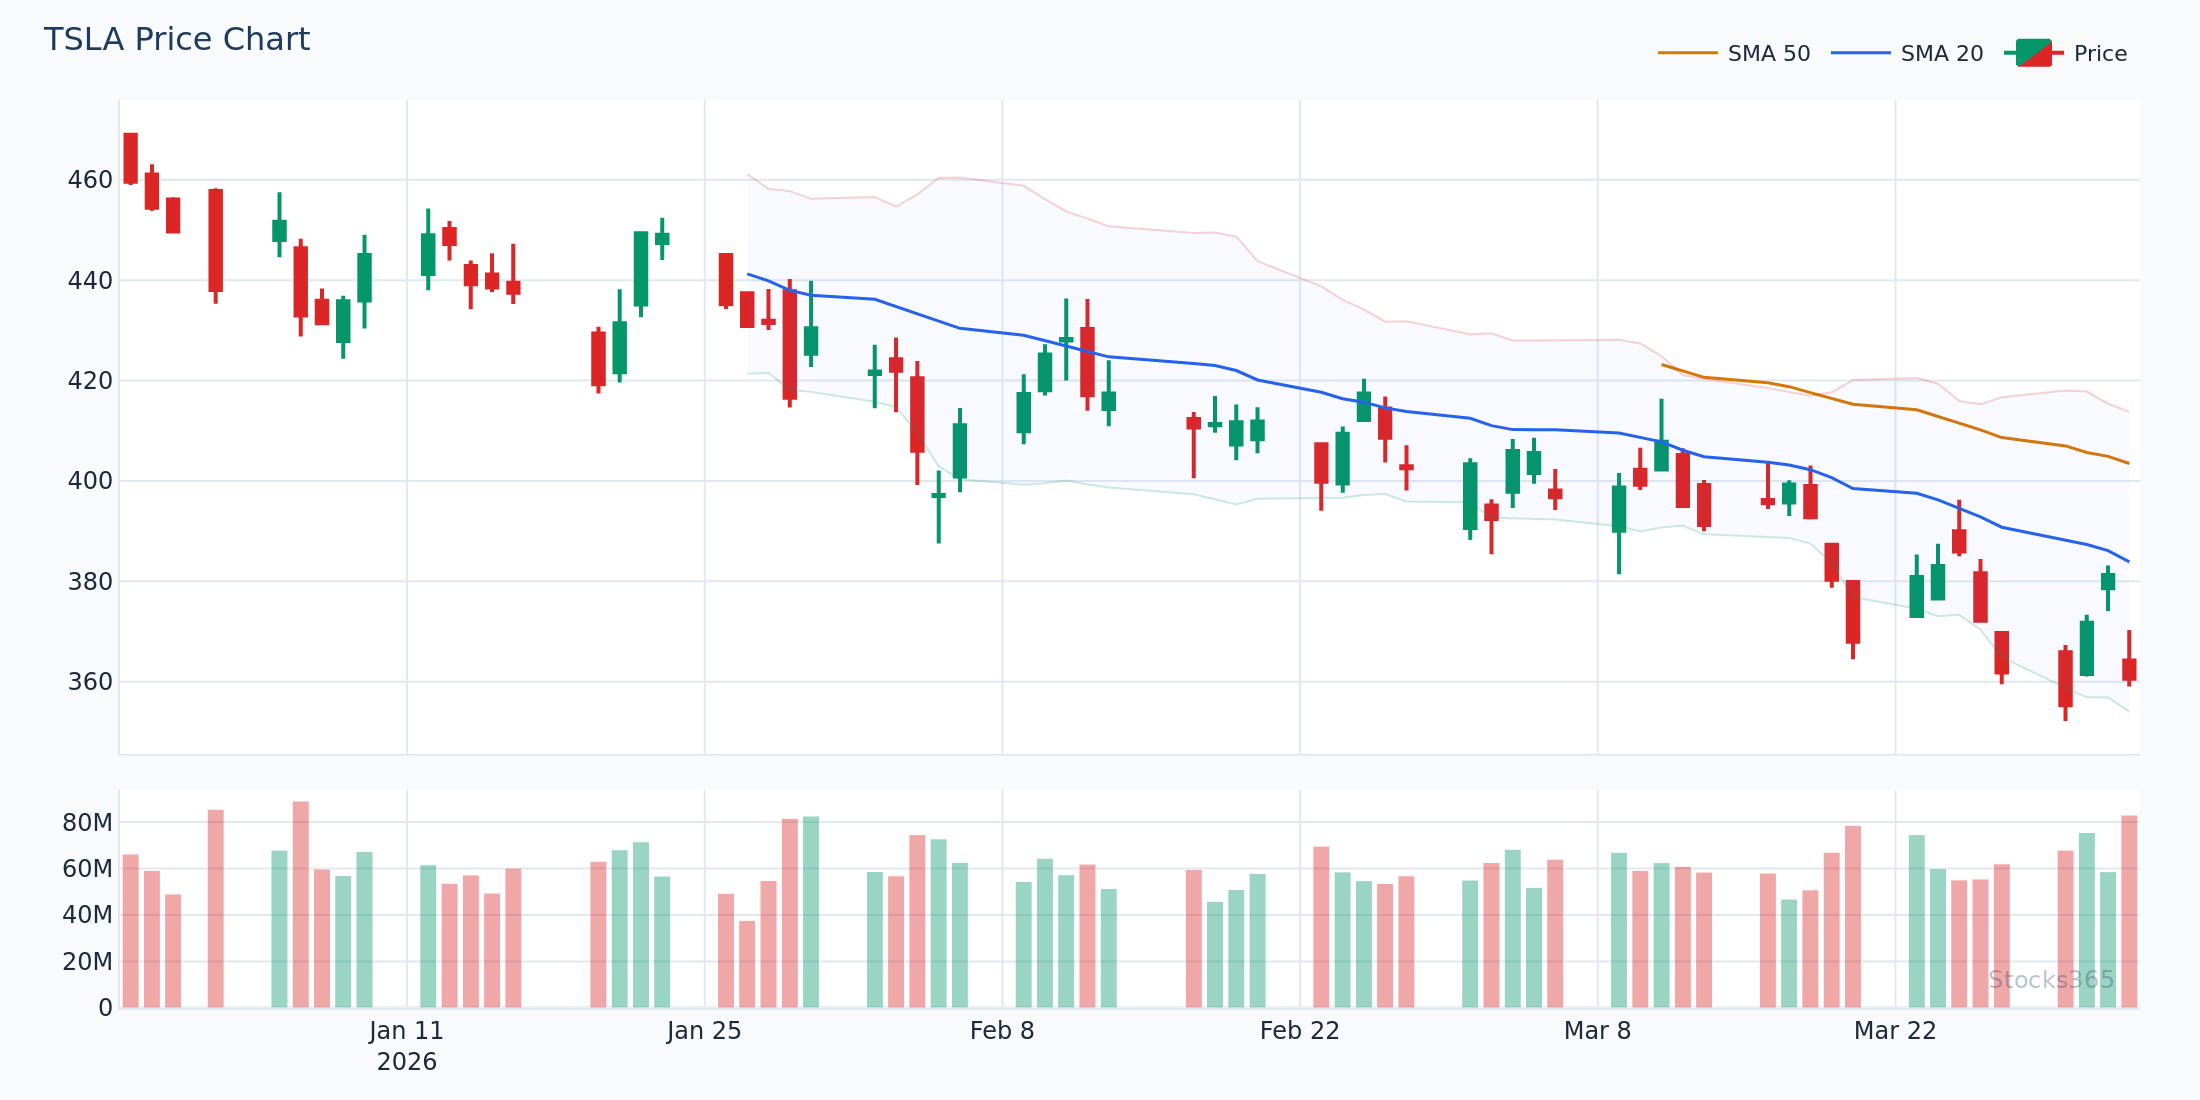
Example: In Q1 2026, TSLA rallied from $280 to $338 over 14 sessions. Daily RSI peaked at 82 before crossing back below 70. A trader buying the $325 put with 35 DTE at that RSI confirmation would have captured the subsequent $40 decline to $298 — turning a $3.20 premium into over $9.00, a 181% return.
Strategy 2: RSI Divergence as an Options Entry Trigger
RSI divergence is one of the most powerful — and underused — tools for options timing. Divergence occurs when price makes a new high (or low) but RSI fails to confirm it with a corresponding new high (or low). This disconnect signals weakening momentum beneath the surface price action.
Bearish divergence (price makes higher high, RSI makes lower high) is a compelling setup for buying puts or entering call credit spreads. Bullish divergence (price makes lower low, RSI makes higher low) is ideal for calls or put credit spreads.
Our detailed article on RSI Divergence: Bullish & Bearish Signals covers the mechanics comprehensively. For options traders, the key adaptation is timing: divergence alone doesn't tell you when the reversal starts. Combine it with a candlestick reversal pattern or a break of short-term support/resistance to trigger your options entry.
Advanced traders should also explore Hidden RSI Divergence — a continuation signal that works brilliantly for entering options positions in the direction of the primary trend during temporary pullbacks.
Strategy 3: RSI with Options Spreads for Reduced Cost Basis
Not every RSI signal warrants buying naked options. Spreads allow you to capitalize on RSI momentum signals while significantly reducing your cost basis and required directional accuracy.
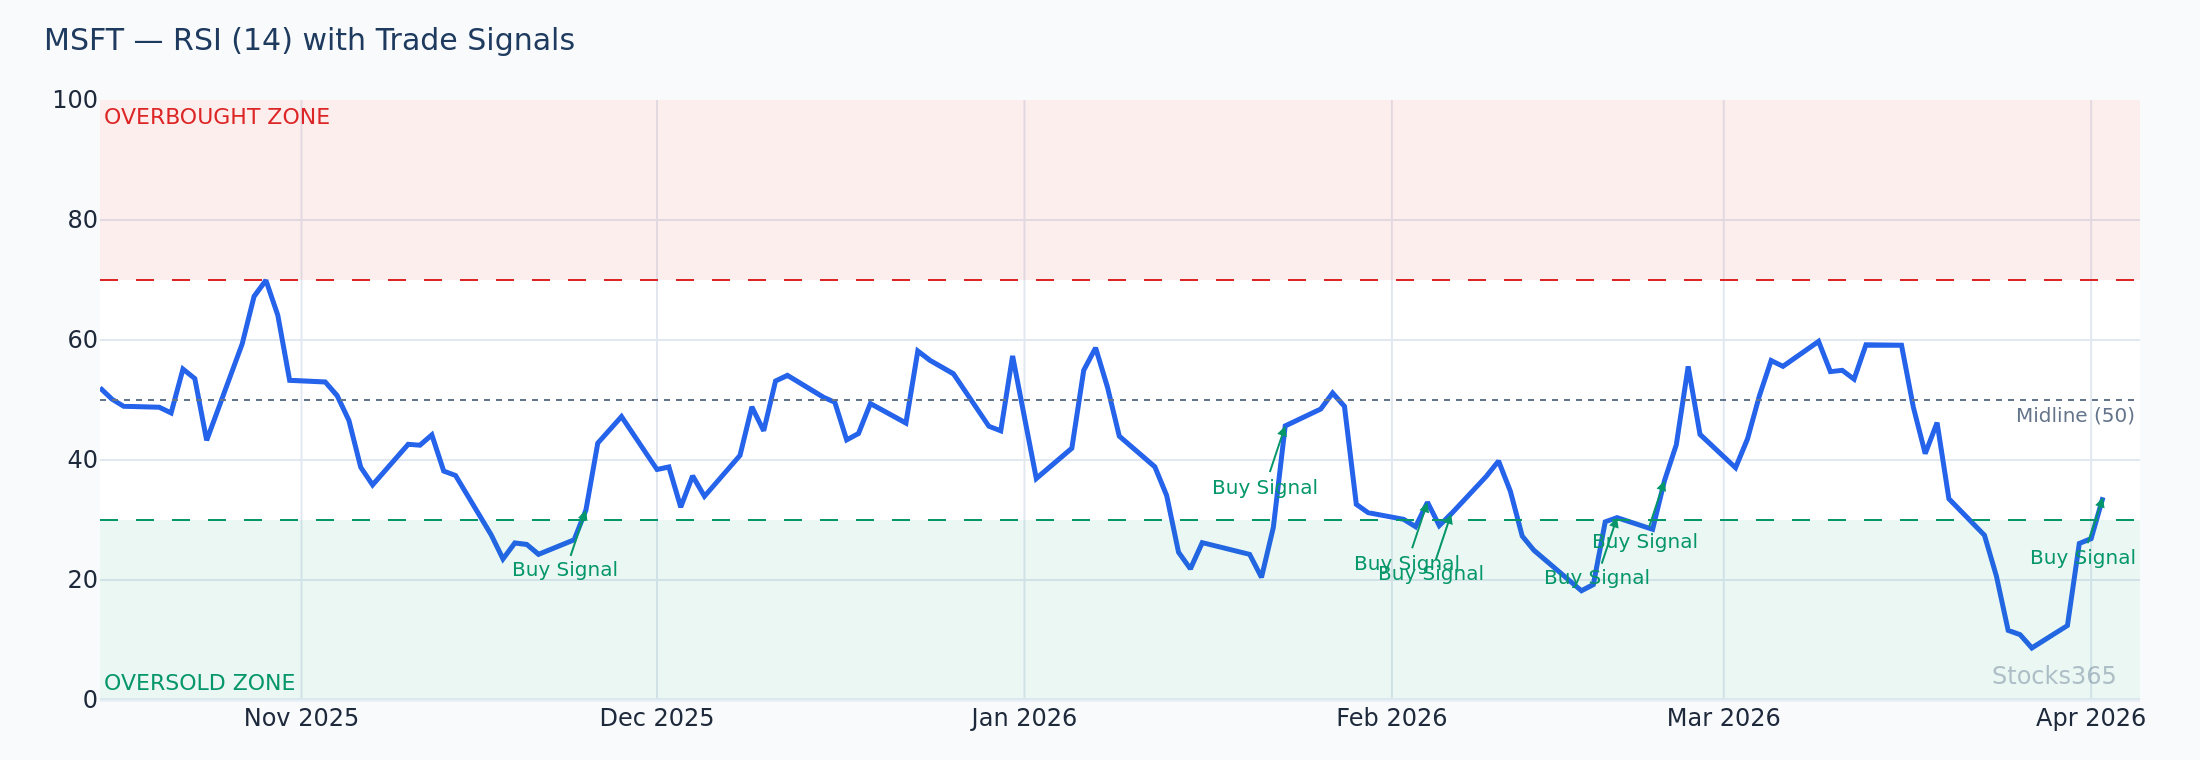
Bull Call Spread on Oversold RSI: When RSI drops to 28 on MSFT trading at $415, instead of buying a naked $420 call, you buy the $415/$425 call spread. You pay less premium, your break-even is lower, and your max profit is capped — but RSI has just told you the magnitude of the bounce may be limited anyway, making the spread the more efficient vehicle.
Bear Put Spread on Overbought RSI: GOOGL trades at $198 with RSI at 74. Rather than buying expensive $195 puts, buy the $195/$185 put spread. The RSI signal tells you a pullback is likely, but the current high-IV environment makes naked puts expensive. The spread neutralizes some of that IV cost.
"RSI tells you the direction. Options spreads help you manage the cost of being right."
Strategy 4: RSI for Timing Options Exits
Timing entries gets most of the attention, but RSI is equally valuable for knowing when to take profits on options positions. A common mistake: holding a winning put position all the way through an oversold RSI reading, watching gains evaporate as the underlying bounces.
Set a profit target or exit rule based on RSI reaching the opposite extreme. If you bought puts when RSI was 78 and crossing below 70, plan to exit at least a portion of the position when RSI reaches 35-40 on the way down — before the inevitable bounce. This discipline locks in gains and avoids the theta decay trap of overstaying a reversal move.
RSI Settings for Different Options Timeframes
Not all options strategies use the same timeframe, and your RSI settings should match your options horizon. This is a crucial but frequently overlooked element of RSI options trading.
For a deep dive into optimizing RSI periods, visit our guide on RSI Settings: Master the Best Period for Your Strategy. Here's the practical framework for options:
- Weekly options (0-7 DTE): Use RSI(7) or RSI(9) on the 1-hour or 4-hour chart. These faster settings generate timely signals for short-duration plays but produce more false signals in choppy markets.
- Monthly options (21-45 DTE): Use standard RSI(14) on the daily chart. This is the sweet spot for most retail options traders — reliable signals with manageable noise.
- LEAPS and longer-dated options (90+ DTE): Use RSI(14) or RSI(21) on the weekly chart. These slower signals reflect major trend exhaustion and macro momentum shifts, ideal for longer-duration positional options trades.
Adjusting Overbought/Oversold Levels for Trending Markets
One refinement many RSI options traders overlook: in strong uptrends, RSI rarely reaches 30 — it tends to oscillate between 40 and 80. Using standard 30/70 levels in a trending market will leave you waiting for entries that never materialize. Adjust your oversold level to 40 in bull trends and your overbought level to 60 in bear trends. This keeps your RSI options signals aligned with the dominant market direction.
The Ultimate Guide to Using RSI in Trading covers trend-adjusted RSI thresholds in detail — essential reading for any options trader applying RSI in trending environments.
Combining RSI with Implied Volatility for Superior Options Timing
RSI measures price momentum. But options traders operate in a two-dimensional world: price and volatility. A critical upgrade to pure RSI options trading is layering implied volatility (IV) analysis on top of RSI momentum signals.
The optimal RSI options setup occurs when:
- RSI signals a reversal (overbought/oversold extreme with cross-back)
- Implied volatility is relatively low (buying options when IV is elevated is expensive; wait for IV contraction before entering debit positions)
- Volume confirms the move (options with high open interest at your target strike confirm that institutional traders agree with your setup)
When IV is high and RSI is at an extreme, favor credit spreads over debit positions. High IV makes selling premium attractive, and RSI tells you the directional lean for which spread to sell. This combination — RSI momentum plus IV awareness — puts options traders on an entirely different level than those using RSI signals in isolation.
Risk Management for RSI-Based Options Trades
Even the cleanest RSI options signal can fail. Markets can remain overbought far longer than expected — particularly during earnings seasons or macro catalyst periods in 2026. Sound risk management is non-negotiable.
Position Sizing Rules
- Never risk more than 2-3% of total trading capital on a single RSI options signal
- Limit debit spreads or long options purchases to premium amounts you're fully prepared to lose
- Scale into positions — start with 50% of your intended position at the first RSI signal, add the remaining 50% when price confirms the reversal with a lower high (for puts) or higher low (for calls)
Stop-Loss Discipline
Options don't have traditional stop-losses the way stocks do, but you can apply time-based and RSI-based exits. If RSI reverses back above 70 after you bought puts on a cross below 70, the signal has failed — exit the position for a small loss rather than hoping it recovers. Define this invalidation point before you enter the trade.
The Stocks365 trust score system, available on the signals dashboard, provides real-time confidence ratings on RSI-based setups — helping you prioritize high-conviction trades over marginal signals. For stock-specific RSI readings, check individual signal pages like AAPL signals for context on current momentum conditions before placing options.
Common RSI Options Trading Mistakes to Avoid
RSI is powerful, but it's widely misused. Here are the most costly mistakes in RSI options trading:
- Entering on RSI extreme alone without confirmation: RSI at 72 doesn't mean sell. Wait for the cross below 70 or a confirming bearish candle before buying puts.
- Ignoring earnings and event risk: RSI signals can be overridden entirely by earnings surprises. Check earnings dates before entering RSI-based options positions.
- Using the wrong timeframe RSI for your options expiration: A weekly RSI signal for a 5-day options trade is a mismatch — align your RSI timeframe to your options duration.
- Buying expensive premium in high-IV environments: RSI tells you direction, not whether the options price is fair. Always check IV rank before buying debit positions.
- Comparing RSI to the wrong benchmark: RSI vs. Stochastic comparisons matter when choosing which momentum tool to use in different contexts. Read our RSI vs Stochastic Oscillator guide to understand when each indicator excels.
Key Takeaways
RSI Options Trading — Summary
- RSI provides momentum timing signals that help options traders enter positions with better precision and reduced theta decay risk
- The RSI cross below 70 (for puts) and above 30 (for calls) provides cleaner entry signals than acting on extremes alone
- RSI divergence — both regular and hidden — offers high-probability options setups for reversal and continuation plays
- Match your RSI period setting to your options expiration: RSI(7) for weeklies, RSI(14) for monthlies, RSI(21) for LEAPS
- Layer implied volatility analysis with RSI momentum: use debit positions in low-IV environments, credit spreads in high-IV environments
- Always define your invalidation point before entering any RSI-based options trade and size positions to risk no more than 2-3% of capital
- The Stocks365 signals dashboard provides real-time RSI momentum analysis with trust scores to help prioritize high-conviction setups
Frequently Asked Questions
What RSI level is best for buying options?
There's no single perfect RSI level, but the most reliable RSI options entries occur when RSI crosses back through an extreme threshold rather than simply reaching it. For buying calls, look for RSI to cross back above 30 after being oversold. For puts, look for RSI crossing back below 70 after being overbought. These crossback signals confirm that momentum has actually shifted, not just paused temporarily. Combining these signals with a confirming candlestick pattern significantly improves accuracy.
Is RSI better for weekly or monthly options?
RSI is versatile across both timeframes, but the indicator settings and chart timeframes must match your options duration. For weekly options (0-7 DTE), use RSI(7) or RSI(9) on a 1-hour or 4-hour chart. For monthly options (21-45 DTE), use the standard RSI(14) on the daily chart. Using daily RSI signals to trade weekly options often results in timing mismatches where the move starts too late for the short-duration contract to capture sufficient gains.
Can RSI divergence be used for options trading?
Absolutely — RSI divergence is one of the most powerful setups for options traders. Bearish RSI divergence (price makes higher high, RSI makes lower high) signals weakening upside momentum and favors put purchases or bear spreads. Bullish RSI divergence favors calls or bull spreads. The key for options is to wait for a confirming trigger — such as a break of a nearby support level or a reversal candlestick pattern — before entering, as divergence alone doesn't pinpoint the exact reversal candle.
How do I avoid false RSI signals when trading options?
False RSI signals are most common in strongly trending markets and during high-volatility events like earnings announcements. To filter them out: require RSI cross confirmation rather than acting on extremes alone; check that there's no major earnings or economic event within your options expiration window; use a secondary indicator (volume, MACD, or key support/resistance levels) to confirm the setup; and in trending markets, adjust your overbought/oversold thresholds to 40/60 rather than the standard 30/70 to align with trend momentum.
Should I use RSI alone for options trading decisions?
RSI should be one component of a multi-factor decision framework, not a standalone signal generator. The most effective RSI options traders combine RSI momentum readings with price action analysis, implied volatility assessment, volume confirmation, and awareness of upcoming catalysts. RSI tells you when momentum is stretched; price action tells you where the reversal may occur; and implied volatility tells you how to structure the trade most efficiently. Platforms like Stocks365 help integrate these factors with real-time trust scores and momentum signals across your watchlist.