
لماذا تحمل إعدادات MACD أهمية أكبر مما يدركه معظم المتداولين؟
يُعدّ مؤشر MACD (تقارب وتباعد المتوسطات المتحركة) من أكثر أدوات التحليل الفني استخدامًا في الأسواق — لكن غالبية المتداولين تتعامل مع قيمه الافتراضية دون أن تطرح سؤالًا بسيطًا: هل هذه الإعدادات فعلاً تناسب استراتيجيتي؟ اختيار أفضل إعدادات MACD لأسلوب التداول والإطار الزمني ونوع السوق الذي تعمل عليه يمكن أن يكون الفارق بين إشارات مربحة بثبات ولوحة تحكم مليئة بالضجيج.
في هذا الدليل، نشرح بالتفصيل كيف تعمل معاملات MACD، وأي الإعدادات تحقق أفضل أداء وفقًا لأنماط التداول المختلفة، وكيف تدمج MACD مع مؤشرات أخرى — مثل RSI — لبناء نظام تداول متين حقًا في 2026.
فهم معاملات MACD: ما الذي يتحكم به كل إعداد؟
قبل أن نتعمّق في القيم الأفضل، يجب أن تفهم ما تضبطه بالضبط. يُبنى مؤشر MACD على ثلاث معاملات رئيسية:
- فترة المتوسط السريع (Fast EMA): المتوسط المتحرك الأسّي القصير (الافتراضي: 12 فترة). يستجيب بسرعة لتغيرات الأسعار الأخيرة.
- فترة المتوسط البطيء (Slow EMA): المتوسط المتحرك الأسّي الأطول (الافتراضي: 26 فترة). يوفر سياق الاتجاه العام.
- فترة خط الإشارة (Signal Line): متوسط متحرك أسّي لخط MACD نفسه (الافتراضي: 9 فترات). يُستخدم لتوليد إشارات الشراء والبيع عند التقاطع.
خط MACD يُحسب كالتالي: المتوسط السريع − المتوسط البطيء. أما الرسم البياني (Histogram) فيمثل الفارق بين خط MACD وخط الإشارة. حين تفهم دور كل معامل، يصبح تحسين إعداداتك أكثر بديهية — وأكثر فاعلية.
كيف يؤثر تغيير معاملات MACD على حساسيته؟
تقليل فترات المتوسط السريع أو البطيء يجعل MACD أكثر حساسية لتحركات الأسعار القصيرة، فيُولّد إشارات أكثر — لكن أيضًا إشارات وهمية أكثر. زيادة هذه الفترات تُنعّم المؤشر، فتُنتج إشارات أقل — لكن عادةً أكثر موثوقية. خط الإشارة يعمل بالطريقة نفسها: خط إشارة قصير يولّد تقاطعات أبكر، بينما خط إشارة طويل يرشّح التقلبات البسيطة.
ملاحظة رئيسية: لا يوجد إعداد MACD "مثالي" عالمي. أفضل معاملات MACD دومًا نسبية إلى إطارك الزمني، والأصل الذي تتداوله، وبيئة السوق التي تعمل ضمنها.
الإعدادات الافتراضية لـ MACD (12، 26، 9): هل لا تزال صالحة في 2026؟
صُمّمت الإعدادات القياسية 12، 26، 9 أصلًا على يد جيرالد أبِّل للرسوم البيانية اليومية للأسهم في السبعينيات — بيئة سوق مختلفة تمامًا عما نعمل فيه اليوم. السؤال الذي يجب أن يطرحه كل متداول جادّ: هل لا تزال هذه القيم الافتراضية مناسبة؟
الجواب الصريح: في بعض الأحيان. بالنسبة للتداول المتأرجح على الرسوم البيانية اليومية لأسهم كبرى مثل AAPL وMSFT وNVDA، فإن الإعدادات الافتراضية لا تزال فعّالة بشكل ملحوظ. الأسواق تتحرك أسرع في 2026 بفضل التداول الخوارزمي ودورات المعلومات على مدار الساعة، لكن الرياضيات الأساسية لزخم الاتجاه لم تتغير جذريًا.
حيث تقصر الإعدادات الافتراضية: الأصول عالية التقلب، الأطر الزمنية القصيرة (أقل من 15 دقيقة)، وأسواق العملات الرقمية أو صناديق ETF ذات الرافعة المالية. في هذه البيئات، التأخر المدمج في تكوين 12/26/9 قد يُنتج نقاط دخول متأخرة كثيرًا عن اللحظة المثالية.
أفضل إعدادات MACD للتداول اليومي
يعمل المتداولون اليوميون على أطر زمنية مضغوطة — عادةً رسوم دقيقة واحدة أو 5 دقائق أو 15 دقيقة. الإعدادات الافتراضية لـ MACD تُدخل تأخيرًا كبيرًا جدًا على هذه المقاييس. بحلول الوقت الذي يسجّل فيه تقاطع على رسم 5 دقائق بمعاملات 12/26/9، تكون الحركة غالبًا قد قطعت نصف الطريق.
إعدادات MACD المُوصى بها للتداول اليومي: (3، 10، 16)
واحد من البدائل الأكثر فاعلية للمتداولين اليوميين هو التكوين 3، 10، 16. إليك ما يفعله كل معامل في هذا السياق:
- المتوسط السريع (3): شديد الاستجابة لحركة السعر الفورية، يلتقط تحولات الزخم خلال دقائق.
- المتوسط البطيء (10): لا يزال قصيرًا بما يكفي ليعكس الاتجاه اليومي، لكنه يوفر تباينًا معنويًا مع الخط السريع.
- خط الإشارة (16): خط إشارة أطول هنا يعمل كموازن، يرشّح الضجيج الناتج عن المتوسطات السريعة جدًا.
على سبيل المثال، على رسم 5 دقائق لسهم NVDA في بداية 2026، أنتج تكوين MACD بقيم 3/10/16 تقاطعًا صاعدًا عند 142.30 دولار قبل نحو 3 شموع من الإشارة المكافئة بالإعدادات الافتراضية — ميزة حقيقية حين تحرّك السهم 8 دولارات في الساعة التالية.
إعداد يومي بديل: (5، 13، 8)
بعض المضاربين السريعين يفضّلون الإعداد 5، 13، 8، الذي يوفر أرضية وسطى بين الاستجابة وتقليل الضجيج. يكون فعّالاً بشكل خاص على الأسهم الكبرى عالية السيولة حيث تكون حركة السعر أكثر سلاسة. الفترات المبنية على فيبوناتشي (5، 13، 8) لها صدى طبيعي مع بنية السوق يجد كثير من المتداولين أنها تُحسّن جودة الإشارة.
أفضل إعدادات MACD للتداول المتأرجح
يعمل المتداولون المتأرجحون عادةً على رسوم بيانية يومية أو 4 ساعات، محتفظين بالمراكز لعدة أيام إلى أسابيع قليلة. هنا بالضبط تتألّق الإعدادات الافتراضية 12، 26، 9 — لكن توجد تحسينات تستحق النظر.
الإعداد الكلاسيكي للتداول المتأرجح: (12، 26، 9)
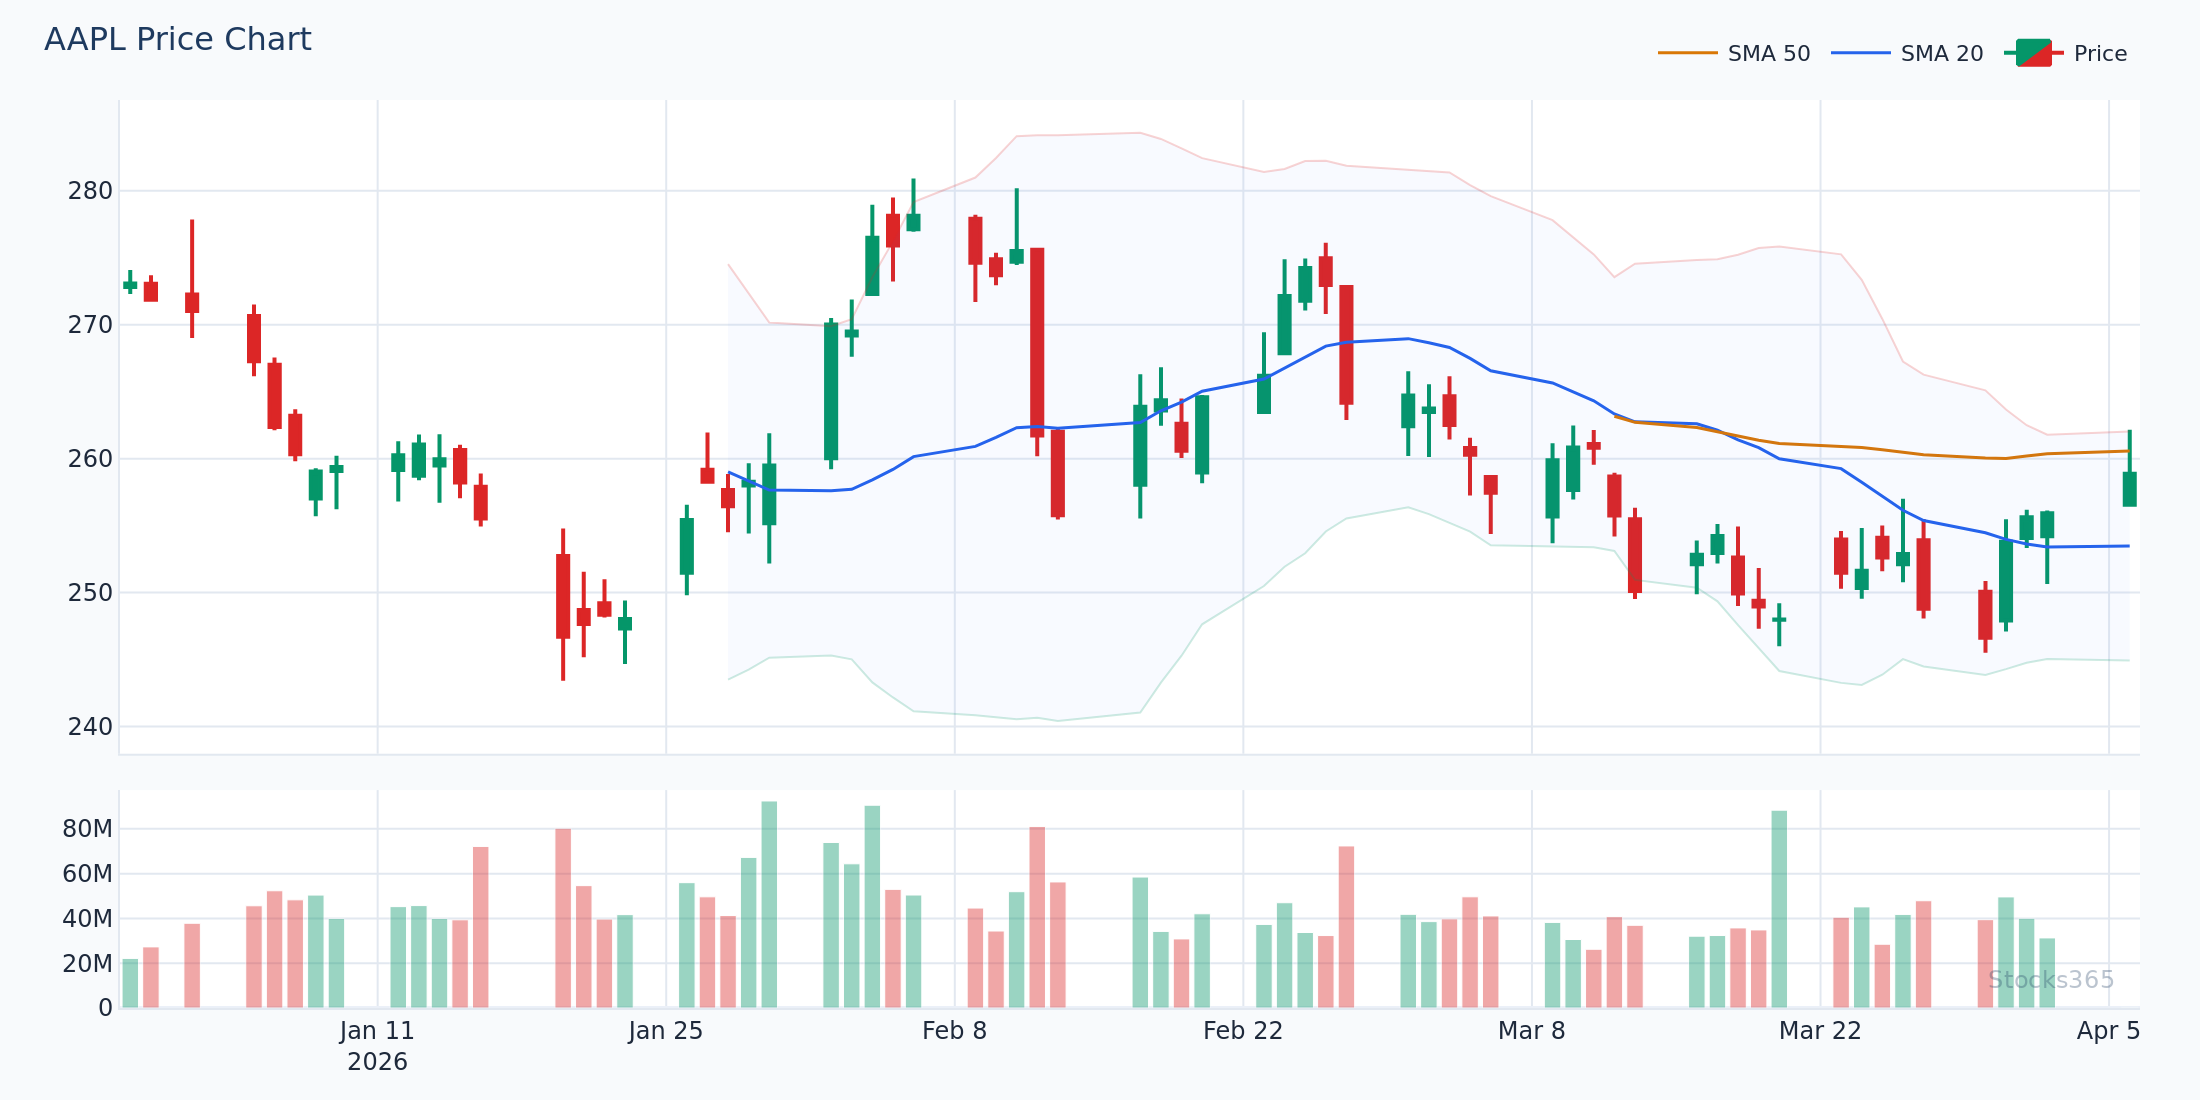
على الرسوم البيانية اليومية، توفر الإعدادات الافتراضية توازنًا ممتازًا بين تكرار الإشارة وموثوقيتها. تقاطع MACD على الرسم اليومي لـ AAPL مؤكدًا بالرسم البياني الصاعد سبق تاريخيًا ارتفاعات متعددة الأيام، والمتوسط البطيء (26) يتماشى تقريبًا مع دورة شهر تقويمي — ما يجعله منسجمًا طبيعيًا مع الدورات الشهرية في مراكز المؤسسات.
إعداد محسّن للتداول المتأرجح: (8، 17، 9)
بالنسبة للمتداولين الذين يريدون دخولاً أسرع قليلاً دون التضحية بموثوقية إشارات الرسم اليومي، فإن التكوين 8، 17، 9 يستحق الاختبار. الفجوة المضغوطة بين المتوسط السريع والبطيء تولّد تقاطعات أبكر بنحو جلسة أو جلستين من الافتراضي، ما قد يحسّن متوسط سعر دخولك بشكل ملموس في الصفقات المتأرجحة. يبقى خط الإشارة عند 9 للحفاظ على الألفة والقابلية للمقارنة.
إذا كنت تستخدم MACD جنبًا إلى جنب مع RSI للتأكيد المتأرجح — وهو ما نوصي به بشدة — فإن دليل إعدادات RSI على Stocks365 يشرح كيف تُواءم فترة RSI مع تكوين MACD للحصول على أقصى تطابق.
أفضل إعدادات MACD للمستثمرين طويلي الأجل
متداولو المراكز والمستثمرون طويلو الأجل الذين يعملون على رسوم بيانية أسبوعية أو شهرية يحتاجون إعدادات MACD ترشّح الضجيج اليومي المستمر وتُركّز على تحولات الاتجاه الكلي الحقيقية.
إعداد MACD طويل الأجل: (24، 52، 18)
مضاعفة المعاملات الافتراضية — 24، 52، 18 — تترجم فعليًا الإعدادات اليومية إلى ما يعادلها أسبوعيًا. على رسم بياني أسبوعي لـ TSLA، ينتج هذا التكوين إشارات أقل بكثير، لكن هذه الإشارات تميل إلى أن تعكس تغيرات اتجاه ذات معنى بدلاً من تصحيحات قصيرة الأجل. التقاطعات على هذا الإعداد أحداث هامة تستحق اهتمامًا جديًا.
لماذا يجب على متداولي المراكز الاهتمام بميل الرسم البياني؟
بالنسبة للمراكز طويلة الأجل، لا تراقب التقاطعات فقط. ميل وزخم الرسم البياني لـ MACD — سواء كان يتوسع أو يتقلص — غالبًا يوفر تحذيرًا أبكر لتغيرات الاتجاه من التقاطع نفسه. رسم بياني إيجابي متقلص على رسم أسبوعي لـ AMZN، حتى بينما يواصل السعر الارتفاع ببطء، قد يكون إنذارًا مبكرًا بأن الاتجاه الصاعد يفقد زخمه.
إعدادات MACD حسب فئة الأصول: ما الذي ينجح أين؟
تتصرف الأصول المختلفة بشكل مختلف، وأفضل إعدادات MACD تختلف تبعًا لذلك:
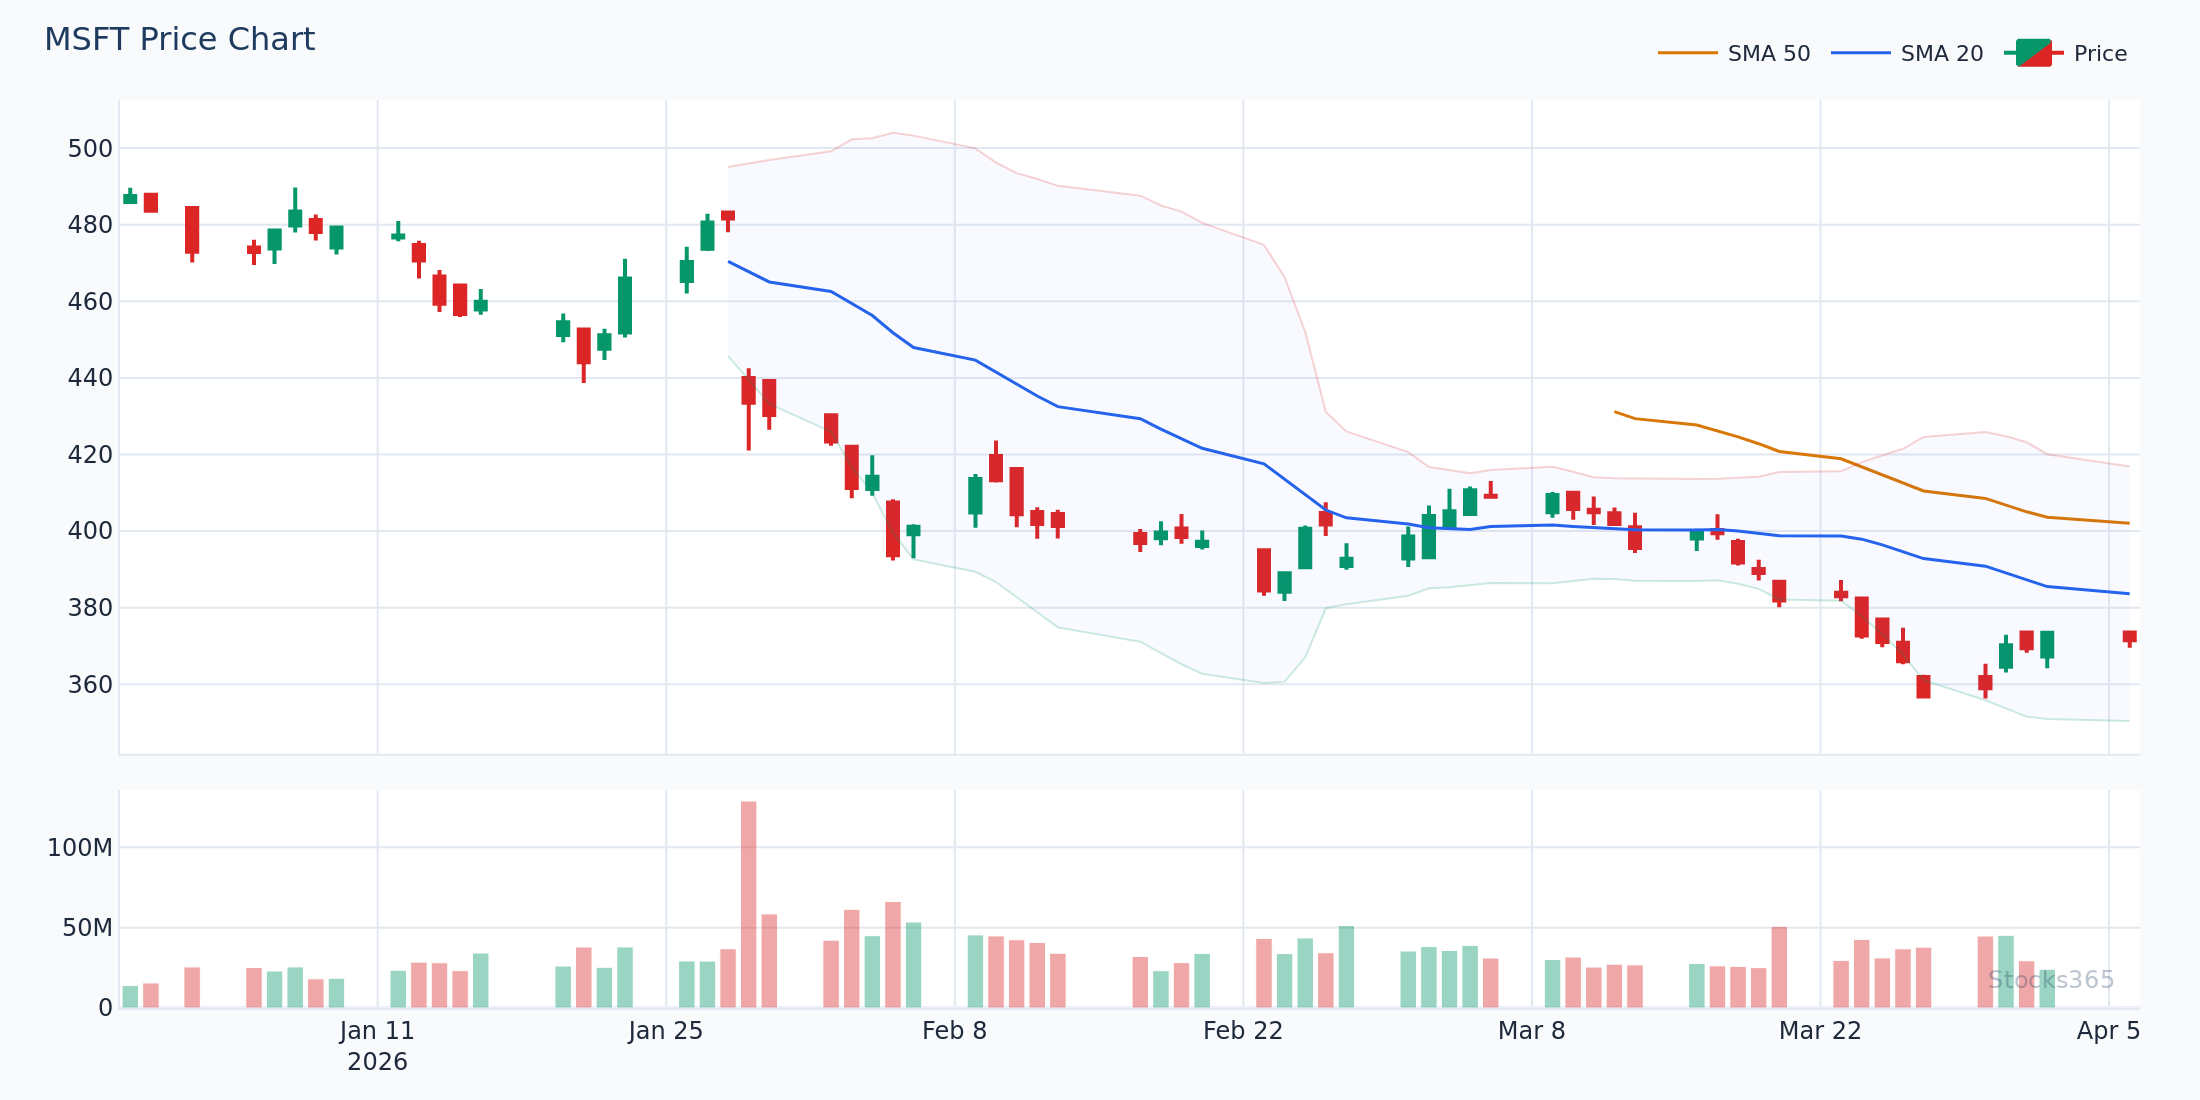
- الأسهم الممتازة (AAPL، MSFT، GOOGL): الافتراضي 12/26/9 على الرسوم اليومية يعمل جيدًا. هذه الأصول تتجه بوضوح وتستجيب بشكل يمكن التنبؤ به لإشارات MACD.
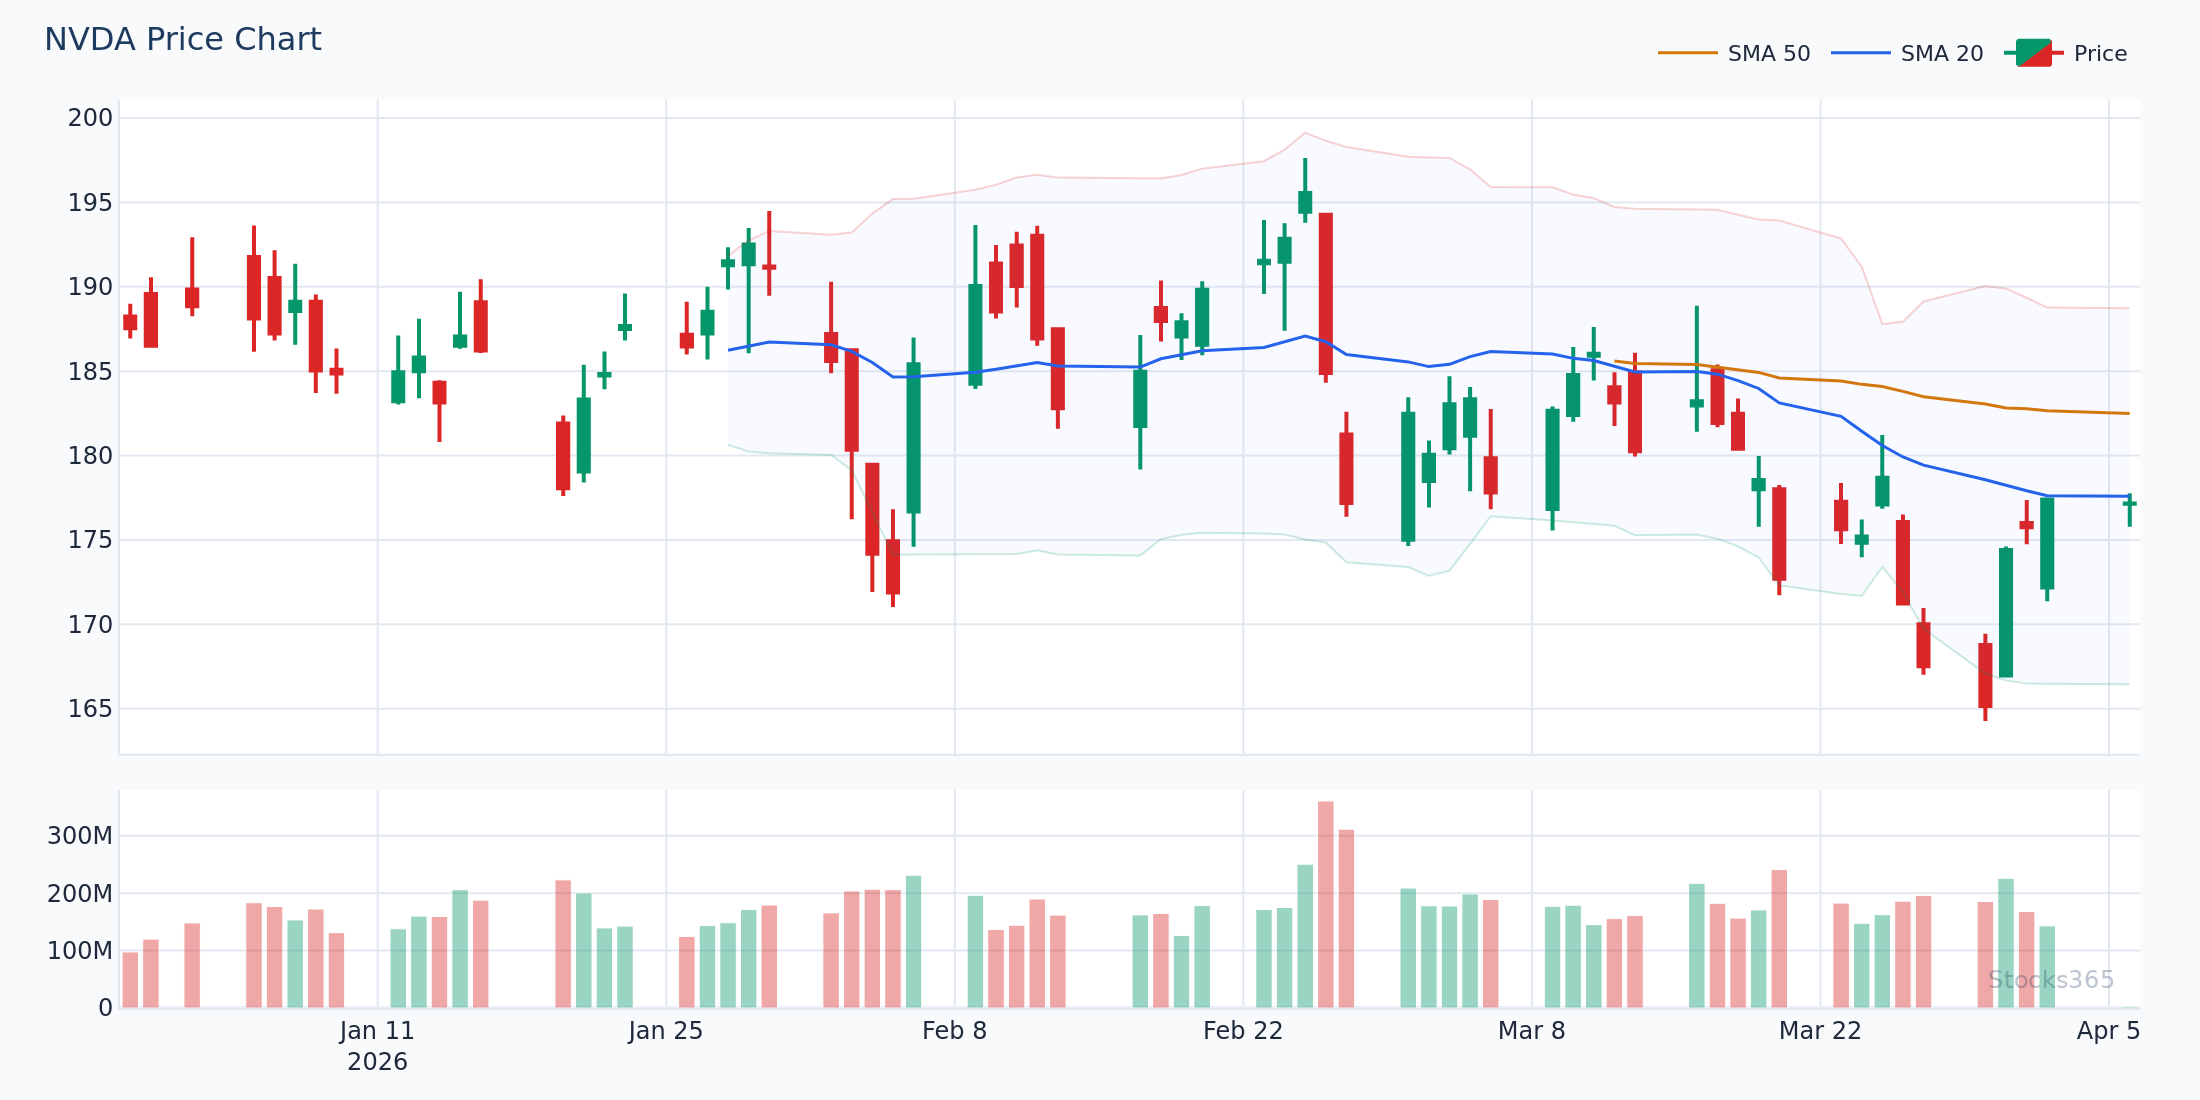
- أسهم النمو عالية التقلب (TSLA، NVDA): فكّر في 8/17/9 لالتقاط الحركات الأسرع. الإعدادات الافتراضية قد تتأخر بشكل ملحوظ خلال جولات الزخم الحادة.
- صناديق ETF والمؤشرات: الافتراضيات تعمل جيدًا. الأدوات الأوسع تتجه بسلاسة أكبر، ما يقلل الإشارات الوهمية بغض النظر عن الإعدادات.
- العملات الرقمية (Bitcoin، Ethereum): إعدادات أقصر (3/10/16 أو 5/13/8) على رسوم 4 ساعات تساعد على التقاط التحولات السريعة للاتجاه الشائعة في أسواق الكريبتو.
- الفوركس: 12/26/9 على رسوم 4 ساعات أو يومية تبقى قياسية؛ بعض المتداولين يستخدمون 5/34/5 لأزواج عملات محددة.
دمج MACD مع RSI للحصول على تأكيد إشارة متفوق
واحدة من أقوى التركيبات المتاحة للتداول هي MACD مقترنًا بمؤشر القوة النسبية RSI. حين يتطابق المؤشران، تزيد احتمالية نجاح الصفقة بشكل جوهري مقارنة بالاعتماد على أي مؤشر بمفرده.
إليك كيف تعمل التركيبة عمليًا:
- تطابق صاعد: ينتج MACD تقاطعًا صاعدًا (خط MACD يعبر فوق خط الإشارة) وRSI يرتفع من منطقة ذروة البيع (أقل من 30-40). هذا التأكيد المزدوج يرشّح كثيرًا من إشارات MACD الوهمية.
- تطابق هابط: ينتج MACD تقاطعًا هابطًا وRSI يهبط من منطقة ذروة الشراء (فوق 60-70). إشارة خروج قوية.
- تأكيد التباعد: إذا أظهر RSI تباعدًا صاعدًا بينما الرسم البياني لـ MACD يتقلص، فقد يكون انعكاس الاتجاه وشيكًا حتى قبل حدوث تقاطع رسمي.
للغوص العميق في إشارات تباعد RSI — التي تقترن بشكل استثنائي مع تحليل الرسم البياني لـ MACD — راجع دليل Stocks365 حول تباعد RSI: إتقان الإشارات الصاعدة والهابطة. وإذا أردت الذهاب أبعد، التباعد الخفي لـ RSI يغطي مفهومًا متقدمًا يفوّته معظم المتداولين تمامًا — ويصبح قويًا بشكل خاص حين يُؤكَّد بـ MACD.
كيف تدمج Stocks365 مؤشر MACD في نظام استخبارات الإشارات؟
لوحة تحكم الإشارات على Stocks365 لا تكتفي بعرض تقاطعات MACD الخام. نظام درجة الثقة على المنصة يُقيّم جودة الإشارة من خلال موازنة بيانات MACD مقابل مجموعة من المؤشرات المؤكدة — بما فيها RSI وأنماط حجم التداول وبنية السعر — قبل تعيين تقييمات الثقة لكل إشارة.
حين تعرض إشارة سهم مثل صفحة إشارة AAPL، تُعرَض بيانات MACD ضمن الصورة التقنية الأوسع. تقاطع MACD صاعد على AAPL مجتمعًا مع RSI يرتفع من 38 وحجم تداول متزايد قد يُنتج درجة ثقة 85 أو أعلى — بينما التقاطع نفسه يحدث مع حجم تداول ضعيف وRSI في ذروة شراء قد يسجل في الخمسينات، ما يشير إلى الحذر.
هذا النهج الطبقي تحديدًا هو السبب في أن فهم معاملات MACD مهم: أفضل إعدادات MACD تُغذّي بيانات خام أفضل إلى الأنظمة متعددة المؤشرات، وتحسّن جودة كل تحليل لاحق.
أخطاء MACD الشائعة التي يرتكبها المتداولون مع الإعدادات
حتى المتداولون ذوو الخبرة يقعون في فخاخ حين يعملون مع معاملات MACD. إليك الأخطاء الأكثر شيوعًا لتتجنبها:
- الإفراط في التحسين للبيانات التاريخية: إجراء اختبارات تاريخية للعثور على إعداد MACD "المثالي" لسهم محدد في فترة ماضية محددة يُنتج معاملات مُلائمة للمنحنى تفشل في التداول الفعلي. دومًا تحقّق على بيانات خارج العينة.
- استخدام الإعدادات نفسها على كل الأطر الزمنية: الافتراضي 12/26/9 على رسم دقيقة واحدة عديم الفائدة عمليًا — التأخر كارثي. دائمًا اجعل إعداداتك تناسب إطارك الزمني.
- تجاهل الرسم البياني: كثير من المتداولين يركّزون حصريًا على التقاطعات ويتجاهلون الرسم البياني، فيفوتون معلومات قيّمة حول تسارع الزخم وتباطؤه.
- تداول MACD في أسواق جانبية: MACD مؤشر يتبع الاتجاه. في الأسواق الجانبية المتقلبة، ينتج انعكاسات وهمية متكررة بغض النظر عن إعداداتك. استخدم أداة مثل بولينجر باندز لتحديد ما إذا كنت في بيئة اتجاه أو نطاق قبل تطبيق إشارات MACD.
- عدم الدمج مع حجم التداول: تقاطع MACD على حجم تداول متناقص أقل موثوقية بكثير من تقاطع مصحوب بارتفاع حاد في نشاط التداول. دائمًا راجع حجم التداول.
إذا كنت تُقيّم أيضًا مؤشرات الزخم خارج MACD، فإن دليل المقارنة على Stocks365 حول RSI مقابل Stochastic Oscillator يقدم منظورًا مفيدًا حول كيف تلتقط أدوات مختلفة جوانب مختلفة من الزخم — كلها ذات صلة ببناء نظام كامل حول إشارات MACD الخاصة بك.
مثال عملي: تطبيق إعدادات MACD المُحسّنة على NVDA في 2026
لنمرّ على مثال ملموس. في الربع الأول من 2026، دخل سهم NVDA مرحلة توحيد بعد ارتفاع قوي، وكان المتداولون الذين يراقبون السهم يبحثون عن إشارة دخول جديدة. إليك كيف تصرّفت إعدادات MACD المختلفة:
- الافتراضي (12/26/9) على الرسم اليومي: ظهر تقاطع صاعد مع NVDA عند حوالي 163.50 دولار — إشارة جيدة، رغم أن السهم كان قد تحرك بالفعل 6 دولارات من أدنى نقطة بالضبط.
- المُحسّن (8/17/9) على الرسم اليومي: ظهر التقاطع الصاعد نفسه قبل جلستين تقريبًا عند حوالي 157.80 دولار — التقاط جزء أكبر بكثير من الحركة.
- مقترنًا مع RSI عند 42 (يرتفع من ذروة بيع): التأكيد المزدوج رفع موثوقية الإشارة. درجة ثقة Stocks365 لهذا الإعداد ستصل غالبًا إلى 80+.
الأمر لا يتعلق بالكمال — بل بالتحسين المنهجي لجودة وتوقيت دخولك من خلال اختيار المعاملات المستنير.
خلاصة رئيسية
📊 ملخص إعدادات MACD — ما تحتاج تذكره:
- الإعدادات الافتراضية لـ MACD (12، 26، 9) تعمل بشكل جيد للتداول المتأرجح على الرسوم البيانية اليومية للأسهم الرئيسية — لكنها ليست مثالية لكل الحالات.
- على المتداولين اليوميين النظر في إعدادات أسرع مثل (3، 10، 16) أو (5، 13، 8) لتقليل التأخر على الأطر الزمنية القصيرة.
- يمكن للمتداولين المتأرجحين تحسين توقيت الدخول بـ (8، 17، 9) دون التضحية بموثوقية الإشارة.
- على المستثمرين طويلي الأجل مضاعفة المعاملات الافتراضية إلى (24، 52، 18) لتحليل الرسم البياني الأسبوعي.
- الأصول عالية التقلب (TSLA، NVDA، الكريبتو) تستفيد من إعدادات MACD أسرع من الأسهم الممتازة.
- MACD أقوى حين يُدمج مع RSI — استخدم التطابق لترشيح الإشارات الوهمية.
- لا تتداول أبدًا تقاطعات MACD في الأسواق الجانبية — أكّد بيئة الاتجاه أولاً.
- نظام درجة الثقة في Stocks365 يُقيّم إشارات MACD ضمن إطار متعدد المؤشرات، يمنحك سياقًا يتجاوز التقاطعات الخام.
أسئلة شائعة
ما هي أفضل إعدادات MACD للتداول اليومي؟
للتداول اليومي على رسوم 5 دقائق أو 15 دقيقة، فإن إعدادات MACD (3، 10، 16) أو (5، 13، 8) عمومًا تتفوّق على الافتراضيات من خلال تقليل التأخير. فترات المتوسط المتحرك الأسرع تلتقط تحولات الزخم اليومية أبكر، بينما خط الإشارة المعدَّل يساعد على ترشيح الضجيج الزائد. دائمًا اختبر أي إعدادات على أصلك وإطارك الزمني المحدد قبل النشر برأس مال حقيقي.
هل يجب أن أُغيّر إعدادات MACD عن الافتراضي (12، 26، 9)؟
يعتمد ذلك على أسلوب تداولك. الإعدادات الافتراضية تبقى فعّالة للغاية للتداول المتأرجح على الرسوم اليومية للأسهم الرئيسية. لكن إذا كنت تتداول يوميًا، أو تعمل على أصول متقلبة، أو تعمل على رسوم أسبوعية، فإن تعديل المعاملات لتناسب إطارك الزمني وتقلبات الأصل بشكل أفضل سيحسّن نتائجك عادةً. المفتاح هو موائمة حساسية MACD مع وتيرة السوق الذي تتداوله.
هل يمكنني استخدام إعدادات MACD نفسها للأسهم والكريبتو؟
عمومًا، لا. أسواق العملات الرقمية تتحرك بسرعة أكبر بكثير وبتقلب أعلى من الأسهم التقليدية. إعدادات MACD أسرع — مثل (3، 10، 16) على رسوم 4 ساعات للكريبتو — تميل إلى الأداء الأفضل من الافتراضيات، التي قد تتأخر بشكل سيء خلال تقلبات أسعار الكريبتو السريعة. الأسهم الممتازة مثل AAPL أو MSFT أكثر قابلية للإعدادات الافتراضية بسبب اتجاهاتها الأكثر سلاسة وتدرجًا.
كيف يعمل MACD بشكل أفضل مع RSI؟
MACD وRSI يكمّلان بعضهما لأنهما يقيسان أشياء مختلفة: MACD يتتبع اتجاه ودافع الاتجاه من خلال المتوسطات المتحركة، بينما RSI يقيس سرعة وحجم تغيرات الأسعار على مقياس محدود. أقوى التركيبات تحدث حين يتوافق تقاطع MACD مع RSI يتحرك خارج منطقة ذروة البيع أو ذروة الشراء. لمزيد من البصيرة حول استخدام RSI بفعالية إلى جانب مؤشرات الزخم، راجع دليل Stocks365 حول كيف تستخدم RSI في التداول.
ما هو الرسم البياني لـ MACD ولماذا مهم؟
الرسم البياني لـ MACD يمثل الفرق بين خط MACD وخط الإشارة. حين يكون الرسم البياني إيجابيًا وينمو، فإن الزخم يتسارع صعودًا. حين يكون إيجابيًا لكنه يتقلص، فقد يفقد الاتجاه الصاعد زخمه. المتداولون الذين يراقبون التقاطعات فقط يفوّتون هذه البيانات القيّمة عن الزخم تمامًا. الانتباه لميل وحجم الرسم البياني — خاصة التباعدات بين الرسم البياني والسعر — يمكن أن يوفر إشارات أبكر وأكثر دقة من التقاطعات وحدها.