
Moving Averages: 7 Beginner Mistakes to Avoid in 2026
Moving averages are the first indicator most traders learn. They're also the first indicator most traders misuse. The gap between knowing what a moving average is and knowing how to trade with it effectively is where accounts go to die.
Across 3,332 signals we backtested on the SMA 20 crossover alone, the historical win rate sits at just 50.9% — barely a coin flip. That number tells you everything. The edge doesn't come from the indicator itself. It comes from how you use it, what context you apply, and which traps you avoid. Our research dashboard breaks this down asset class by asset class, and the variance is striking.
Here are the seven moving average mistakes that separate losing traders from profitable ones — and exactly how to fix each one.
Mistake #1: Using Moving Averages as Buy/Sell Signals in Isolation
This is the most common moving average mistake. A beginner sees price cross above the 50-day SMA and buys. Price crosses below — they sell. Clean, simple, and usually wrong.
Moving averages are trend-following tools. They confirm direction. They don't predict reversals.
Here's what most traders get wrong: They treat an MA crossover as a signal in itself. In reality, a crossover is a lagging confirmation. By the time price crosses above a 200-day SMA, the move that created that signal may already be 15–20% complete. You're not catching the trend early — you're validating it late.
The fix is to combine moving averages with momentum indicators. Pair your SMA cross with an RSI reading to filter low-probability setups. If price breaks above the 20-SMA but RSI is already above 70 and showing bearish divergence, that's a low-trust setup. If price breaks above the 20-SMA with RSI recovering from oversold territory, the probability profile shifts significantly. Learn how to layer these tools in our guide on how to use RSI in trading.
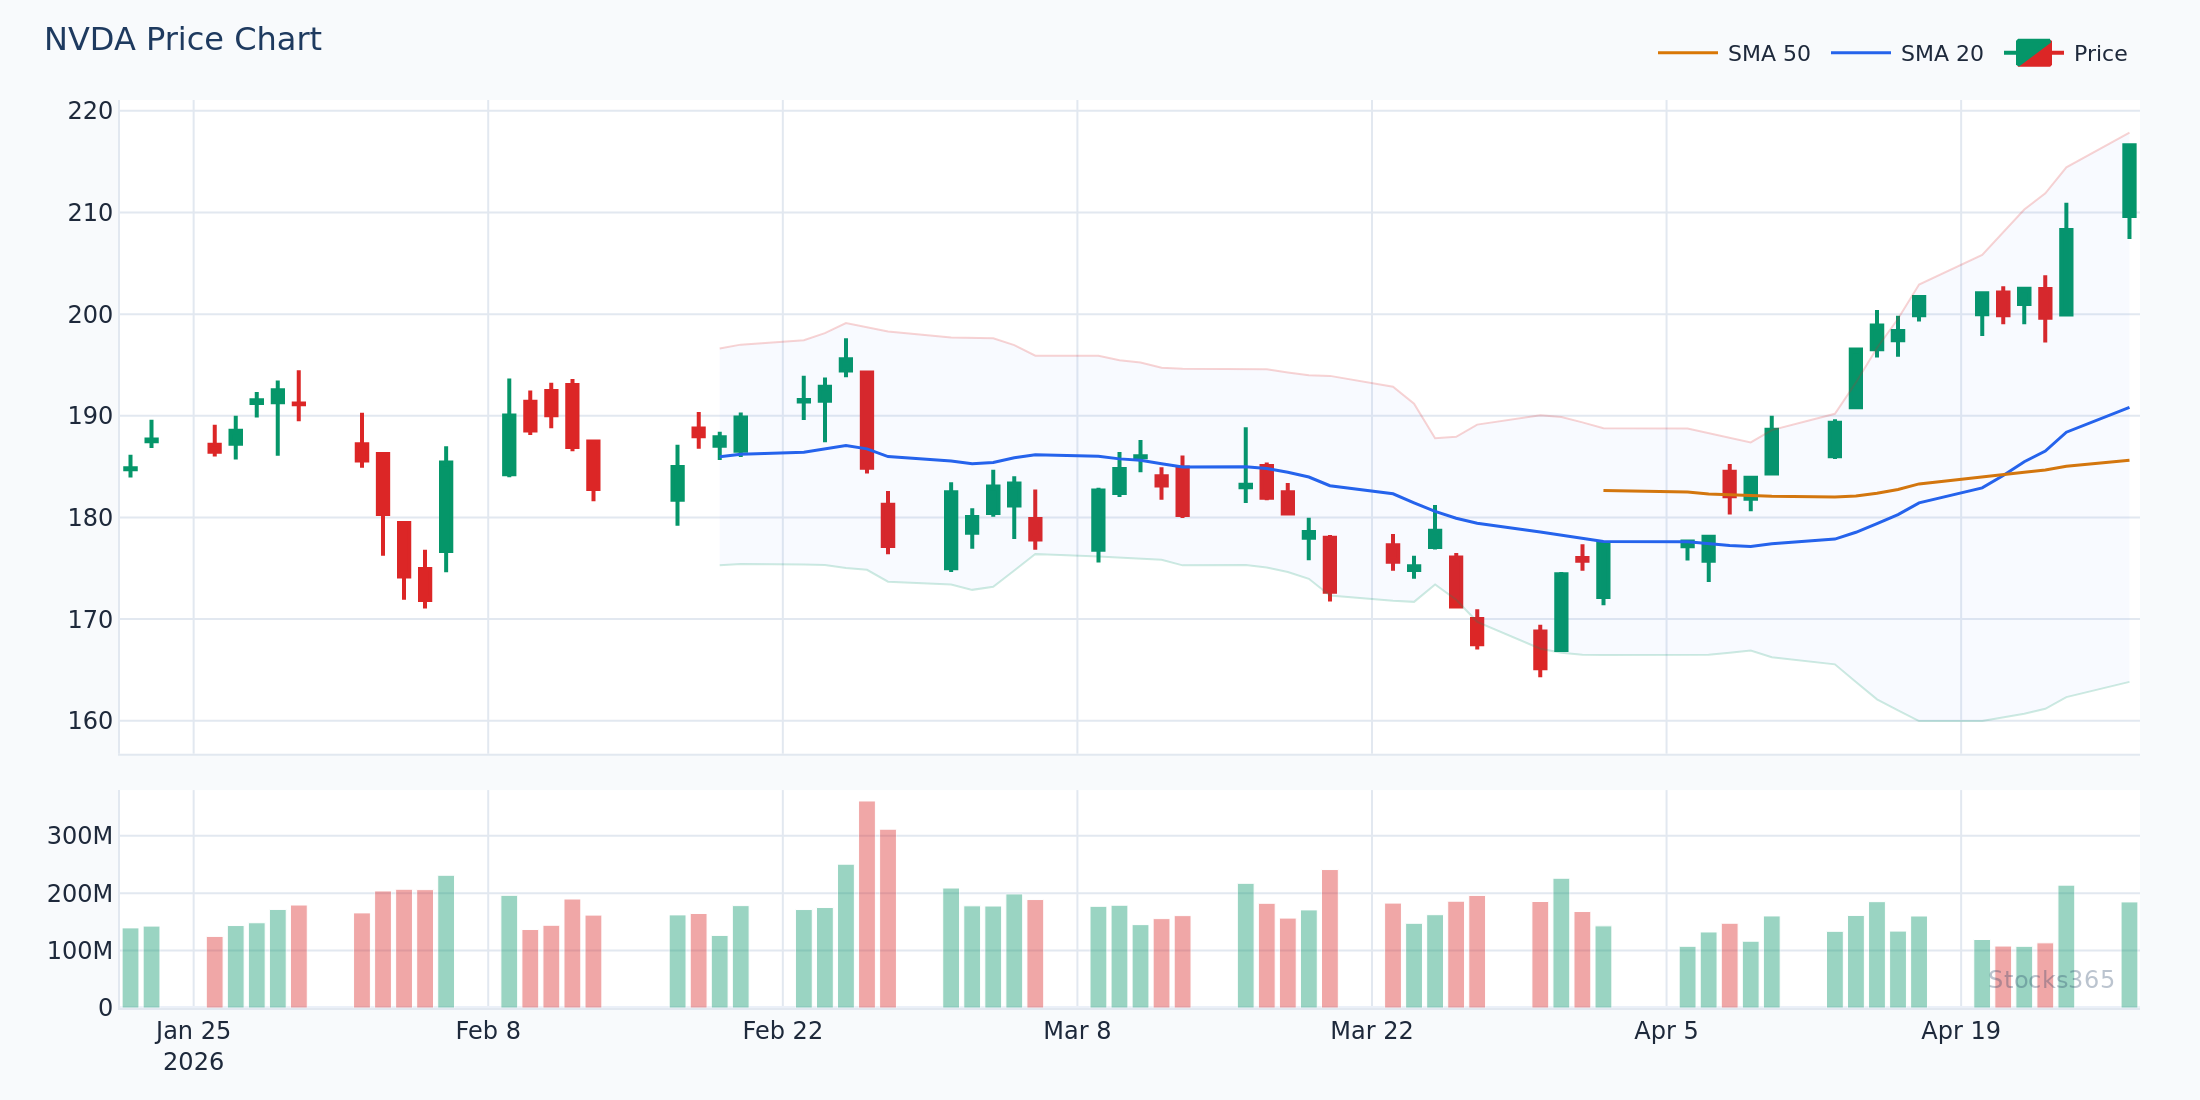
This chart shows price reclaiming the 20-SMA after a pullback, with RSI recovering from the 40–50 zone — a classic reload setup in an uptrend. When volume confirms the move on the candle that breaks above the MA, the setup has higher follow-through probability. If price closes back below the 20-SMA within two candles, the signal is invalidated and the trend structure needs reassessment.
Mistake #2: Choosing the Wrong Moving Average Period for Your Timeframe
Not all moving averages are created equal — and the period you choose needs to match your trading timeframe and style. A 200-period SMA on a 5-minute chart is meaningless noise. A 9-period EMA on a weekly chart generates whipsaw after whipsaw.
Here's a practical framework:
- Scalpers (1–5 min charts): 9 EMA, 21 EMA for short-term momentum reads
- Swing traders (daily charts): 20 SMA, 50 SMA for trend structure
- Position traders (weekly charts): 50 SMA, 200 SMA for macro trend direction
The moving average mistake here is copy-pasting settings from someone else's strategy without understanding why those periods work on a specific timeframe. Every extra period adds lag. Shorter periods create noise. Find the balance that matches how long you hold trades.
Mistake #3: Ignoring the Asset Class You're Trading
This is a data-backed problem that most traders never even consider.
Stocks365 backtested 3,289 signals on the Price Crosses Above SMA 20 setup and found a win rate of just 48.3% overall — but the breakdown by asset class tells a more important story. Stocks performed best at 52.3%, while crypto came in worst at just 36.9%. That's not a small difference. That's the difference between a strategy that grinds out gains and one that bleeds your account.
Crypto markets are structurally different. They trend hard, reverse violently, and generate far more false MA crossover signals — especially on shorter timeframes. An SMA 20 cross that works reliably on a large-cap stock becomes a trap in a high-volatility altcoin environment.
Match your moving average strategy to the asset you're trading. Don't assume what works on equities translates directly to forex or crypto. It doesn't.
In high-volatility environments, price repeatedly crosses above and below the 20-SMA without establishing a clean trend — this is called whipsawing, and it's one of the primary reasons moving average mistakes cost traders money. The pattern here shows multiple false breakouts where each crossover reversal erased the previous gain. A wider MA period or the addition of a secondary filter like MACD histogram confirmation would have eliminated most of these false entries. If price can't hold above the MA for at least two consecutive closes, the signal lacks conviction.
Mistake #4: Fighting the Trend with a Countertrend MA Strategy
Moving averages define trend. Using them to trade against the trend is like using a compass to navigate in reverse.
A common beginner error: price is trending above a rising 50 SMA, so the trader waits for a pullback to the MA and then — instead of buying the reload — shorts it because "price has gone too far up." They use the MA as a reversal signal instead of a trend continuation tool.
Don't fight the slope. A rising moving average means the trend is up. A falling moving average means the trend is down. Trade in the direction the MA points, not against it.
The only exception: when you're using a shorter-term MA on a higher-timeframe bearish structure to identify short entries on relief bounces. That's a multi-timeframe approach — not countertrend trading. There's a critical difference.
Mistake #5: Overlapping Too Many Moving Averages
More lines do not mean more clarity. They mean more confusion.
Walk into any beginner trading forum and you'll find charts buried under 4, 5, sometimes 6 moving averages — 9 EMA, 21 EMA, 50 SMA, 100 SMA, 200 SMA, all layered on top of each other. The trader stares at the chart waiting for all of them to align before entering. By the time they do, the move is over.
This moving average mistake is really an analysis paralysis problem in disguise.
Pick two. Three at the absolute most. A short-term MA to track immediate momentum, a medium-term MA to define the current trend, and optionally a long-term MA for macro context. Everything beyond that adds noise, not signal. Streamline your chart. Your decision-making will sharpen immediately.
This chart demonstrates the power of simplicity — just the 20-SMA and 50-SMA on a daily timeframe. When the 20-SMA trades above the 50-SMA and price pulls back to test the 20-SMA from above, that's the reload zone where high-probability continuation setups form. The setup gets invalidated if price breaks and closes below both MAs on above-average volume, signaling a potential trend structure shift rather than a temporary pullback.
Mistake #6: Using EMAs and SMAs Interchangeably Without Understanding the Difference
Exponential Moving Averages (EMAs) and Simple Moving Averages (SMAs) are not the same thing. Treating them as interchangeable is a moving average mistake that leads to inconsistent results and confused analysis.
The core difference:
- SMA: Weights every data point equally. Slower, smoother, less reactive to recent price action.
- EMA: Weights recent price data more heavily. Faster, more reactive, generates earlier signals — and more false ones.
EMAs are better for fast-moving markets where recent price action is more relevant — intraday trading, momentum stocks, trending crypto. SMAs are better for filtering out noise in longer-term trend analysis and identifying major structural levels where price historically finds support or resistance.
The MACD indicator — one of the most widely used technical tools — is built entirely on EMAs. Understanding EMA mechanics will also improve your reading of MACD signals significantly. If you trade forex, the MACD in forex trading guide shows how EMA-based signals behave across currency pairs.
Mistake #7: Treating Moving Averages as Precise Support and Resistance Levels
Price doesn't bounce off a moving average like a billiard ball off a cushion. It doesn't work that way.
Beginners draw price touching a 50 SMA and immediately enter a long trade expecting a textbook bounce. When price slices through by 1% before reversing, they're stopped out — even though the "signal" eventually played out correctly. The moving average zone, not the exact line, is what matters.
Think of moving averages as zones of interest, not precise price levels. Price can wick through an MA, close marginally below it, and still be in a technically valid uptrend. What matters is where price closes relative to the MA over multiple sessions, not a single candle's interaction with the line.
This connects directly to how you set stops. Placing a stop loss exactly at the MA line almost guarantees you get hunted by institutional order flow that probes these obvious levels before reversing. Give your trade room. Use the MA as a zone, not a number.
Combine this understanding with momentum context — for example, checking whether RSI is at overbought or oversold levels when price tests an MA — and your read on these setups gets significantly more accurate.
This pattern shows a common institutional trap: price wicks below the 50-SMA, triggers retail stop losses, then reclaims the MA on the same or following candle with a strong close. The wick below the MA isn't a breakdown — it's liquidity being harvested. Confirmation that the setup holds comes when price closes back above the MA and RSI recovers above 45, suggesting the pullback was corrective rather than a trend reversal. A follow-through close below the MA on high volume would invalidate the hold and suggest genuine selling pressure.
What to Watch For
- 20-SMA reload setups in confirmed uptrends: When price pulls back to touch a rising 20-SMA after at least three higher highs, and RSI holds above 40 during the pullback, the structure favors continuation. Watch for a bullish candle closing back above the 20-SMA as the entry trigger.
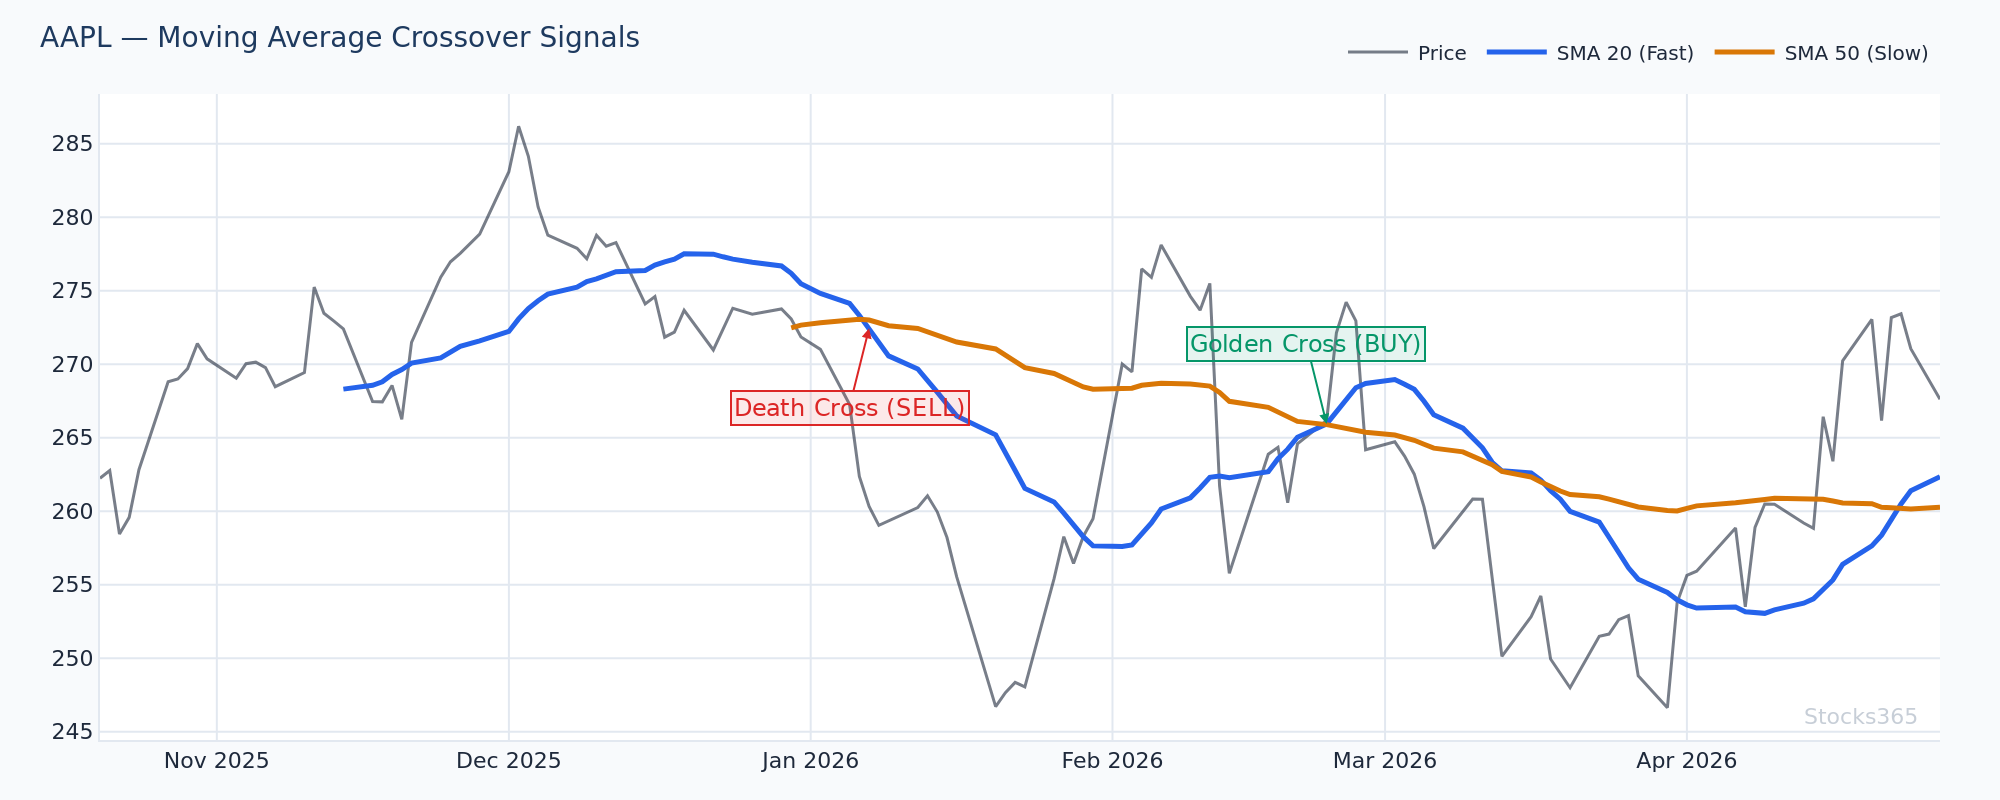
- Golden Cross setups on daily charts with volume confirmation: When the 50-SMA crosses above the 200-SMA for the first time after a prolonged downtrend, the first pullback to the 50-SMA after the cross is historically the highest-probability reload entry — especially when volume on the cross candle exceeds the 20-day average.
- MA compression zones before breakouts: When the 9 EMA, 20 SMA, and 50 SMA cluster within a narrow range (less than 2% of price), a volatility expansion is typically imminent. Pair this with a Bollinger Band squeeze reading. The direction of the initial break — confirmed by a close beyond the MA cluster — often dictates the next 5–10 day move.
- RSI divergence at key MA tests: When price tests a major MA (50 or 200 SMA) for the second or third time and RSI shows bearish divergence on each test, that MA is weakening as support. A breakdown becomes increasingly likely.
- Death Cross on crypto with RSI below 50: On daily crypto charts, a 50/200 SMA Death Cross that forms while RSI is already below 50 (not yet oversold) has historically produced extended downtrends rather than quick recoveries — suggesting the risk is to hold short exposure rather than fade the move early.
Key Takeaways
Summary: Moving Average Mistakes to Eliminate
- Never use MA crossovers as standalone signals — always layer with momentum confirmation like RSI or MACD
- Match your MA period to your timeframe and trading style; what works on daily charts fails on 5-minute charts
- Asset class matters — our data shows crypto produces win rates 15%+ lower than stocks on identical SMA 20 cross setups
- Don't add more MAs hoping for more clarity; two or three well-chosen MAs beat six cluttered lines every time
- Understand the difference between EMA and SMA — they're built differently and perform differently across market conditions
- Treat MAs as zones of interest, not precise support/resistance prices — give your stops room and watch for wick hunts
- Trade in the direction the MA slopes, not against it — the trend is the edge, and moving averages exist to confirm it
How Stocks365 Uses This
📊 How Stocks365 Integrates Moving Averages Into Its Trust Score SystemMoving average analysis is one of 12+ technical inputs that contribute to the Stocks365 Trust Score — our proprietary signal quality rating system visible on every signals dashboard entry and individual stock signal page.
Specifically, MA structure feeds into two scoring dimensions: trend regime classification (is the asset in a confirmed uptrend, downtrend, or chop?) and signal agreement scoring (does the MA signal align with momentum, volume, and volatility readings?). A signal where price is above both the 20-SMA and 50-SMA, the 50-SMA is above the 200-SMA, and RSI confirms the momentum gets higher agreement scores than a crossover in a choppy, structurally ambiguous market.
This is why two signals can both show an "MA crossover" pattern but receive very different Trust Scores — context, alignment, and regime matter far more than the raw crossover event. The platform also cross-references RSI-based filters to flag setups where MA signals conflict with momentum readings, helping you avoid the exact moving average mistakes outlined in this guide.