
Moving Averages for Crypto Trading: Why They Work Differently Here
Crypto doesn't sleep. It doesn't follow earnings seasons or Fed meeting schedules. It moves on sentiment, liquidity, and momentum — 24 hours a day, 7 days a week. That's exactly why moving averages for crypto trading have become one of the most widely used technical tools in the space. They cut through the chaos and give traders a structural framework when emotion threatens to take over.
But here's the thing: moving averages applied blindly to crypto will get you wrecked.
The same SMA that works beautifully on a weekly Bitcoin chart can produce a string of whipsaws on an altcoin's 4-hour chart. The approach has to match the asset, the timeframe, and the market regime. This guide breaks all of it down — practically, clearly, and without the generic filler that dominates most trading content.
What Are Moving Averages? A Fast Primer
A moving average smooths price data over a defined number of periods, giving you a running average that trails the market. The two types you'll use most in crypto are:
- Simple Moving Average (SMA): Adds closing prices over N periods and divides by N. Every period gets equal weight.
- Exponential Moving Average (EMA): Applies exponentially more weight to recent prices. Reacts faster to new information.
In traditional markets, traders often lean on the 50-day and 200-day SMAs. Crypto traders use those too — but also rely heavily on the 20-period EMA on shorter timeframes, and even unconventional periods like 21, 55, and 144 (Fibonacci-based) because the community has broadly adopted them.
The period you choose matters enormously. A 10-EMA follows price like a shadow. A 200-SMA is a slow-moving battleship. Both have valid uses — in the right context.
SMA vs EMA: Which Works Better for Crypto?
The Case for EMA in Fast-Moving Markets
Bitcoin can move 10% in a single session. An altcoin can double in 48 hours and give back half of it the next day. In environments like these, the EMA's sensitivity is a genuine advantage. When price reverses sharply, the EMA recalibrates faster — giving you earlier signals to act.
Most active crypto traders default to the 9-EMA and 21-EMA on lower timeframes (1-hour, 4-hour) for short-term momentum reads. The 50-EMA and 200-EMA dominate on daily charts for trend direction.
When SMA Outperforms
The SMA's equal weighting makes it more resistant to single-candle spikes — which crypto produces constantly. A wick down to an extreme low won't distort an SMA the way it briefly distorts an EMA. For identifying major structural levels — the kinds of zones where Bitcoin historically has found support or resistance — the 200-day SMA remains a cornerstone tool.
Use EMA for entries. Use SMA for structure. That's the practical split.
This chart shows a classic short-term EMA crossover setup where the 9-EMA crosses above the 21-EMA after a consolidation phase, with price holding above both lines on the retest. When price pulls back to test the newly crossed EMAs and holds, that's the high-probability continuation entry — not the initial cross itself. The setup fails if price closes back below both EMAs on the retest candle.
The Key Moving Average Levels Every Crypto Trader Watches
These aren't arbitrary. They work because enough participants watch them — which is itself a self-fulfilling mechanism that creates real technical significance.
- 20-SMA / 20-EMA: Short-term trend gauge. Price above = bullish bias. Price below = bearish bias. Used heavily for swing trading setups.
- 50-SMA: Mid-term trend. Bitcoin respecting the 50-day SMA in an uptrend is a sign of trend health. Losing it signals weakness.
- 100-SMA: Less discussed but often acts as a critical support/resistance zone during corrections in major altcoins.
- 200-SMA: The institutional benchmark. A Bitcoin close above the 200-day SMA is widely interpreted as the market being in a structural bull trend. Below it — the opposite.
- 200-EMA: Many traders treat this as an even more dynamic version of the 200-SMA. When price reclaims the 200-EMA after a prolonged downtrend, it's one of the more reliable long-signal setups in macro crypto analysis.
Moving Average Crossover Strategies for Bitcoin
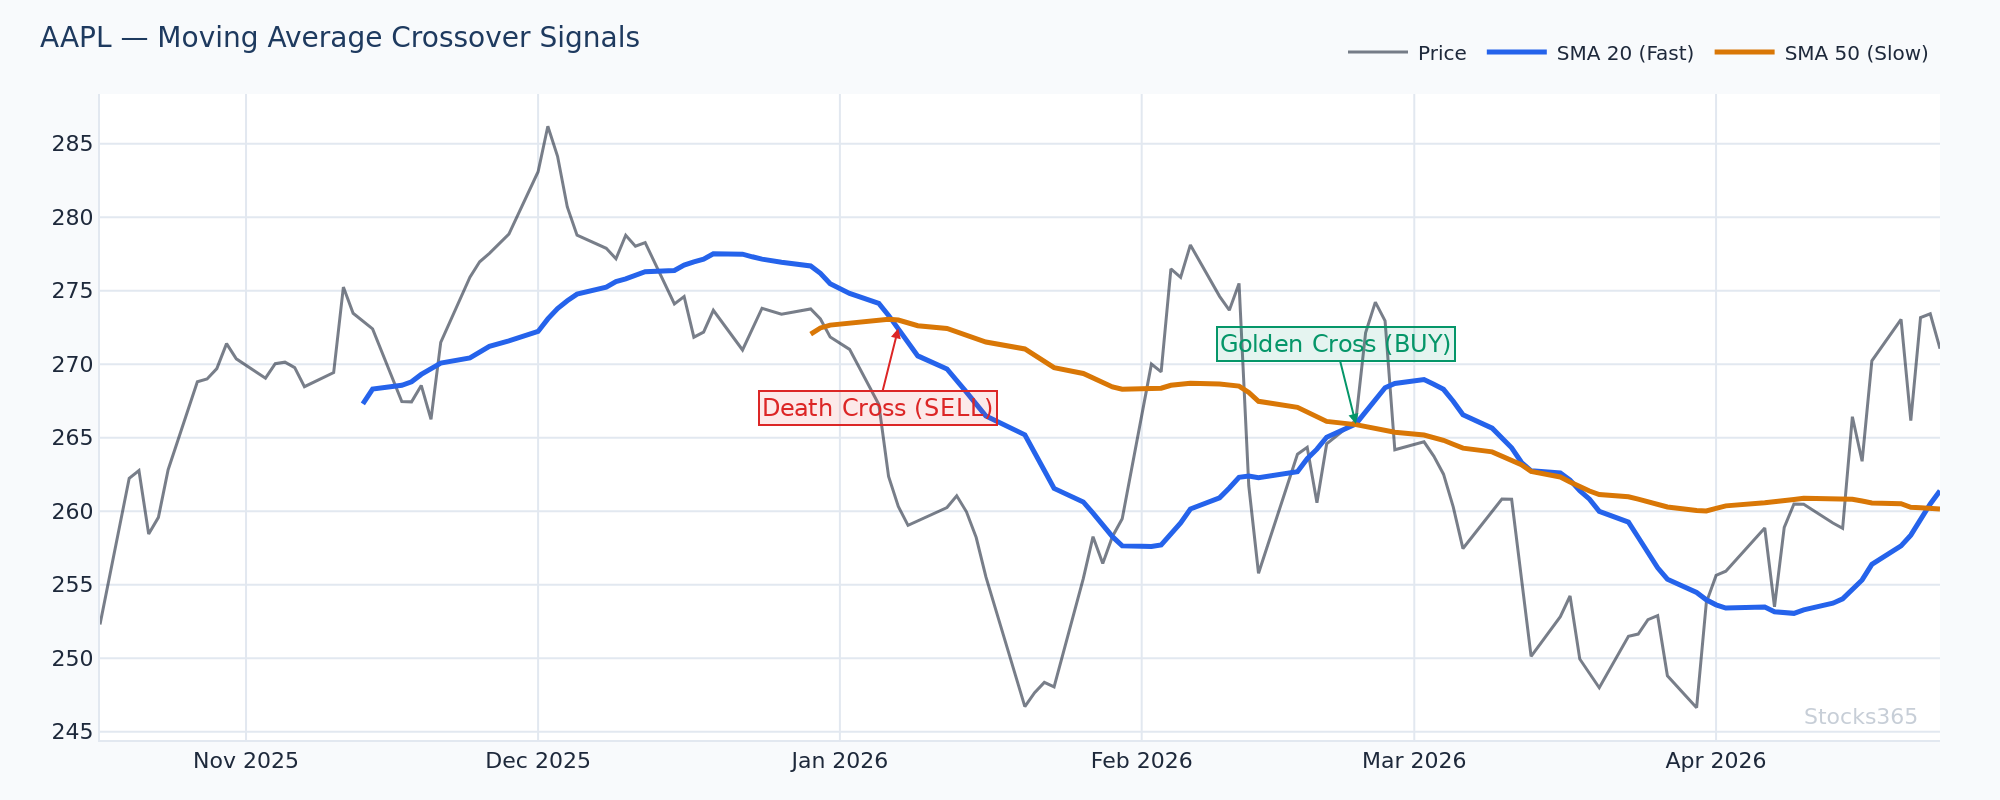
The Golden Cross and Death Cross
These are the most discussed crossover signals in crypto. The Golden Cross occurs when the 50-day SMA crosses above the 200-day SMA. The Death Cross is the reverse — 50-day drops below 200-day.
Every major Bitcoin cycle has produced these signals. And yes, they lag. By the time a Golden Cross prints, Bitcoin has often already moved 30-50% off its lows. The signal isn't for catching bottoms — it's for confirming trend regime shifts and giving longer-term holders a structural green light.
Use crossovers for regime confirmation, not entry timing.
Shorter-Term Crossovers for Altcoins
On altcoins — which move in compressed timeframes — shorter crossovers like the 9/21 EMA or 13/49 EMA are more practical. These generate signals within days rather than months, matching the faster nature of altcoin price cycles.
A clean setup: the 9-EMA crosses above the 21-EMA, price pulls back to test both EMAs as support, and volume on the test is lower than the breakout candle. That compression-to-expansion dynamic is a reliable entry trigger.
Here the price action shows three consecutive higher lows, each finding support on the rising 21-EMA, with the 9-EMA maintaining its position above. The critical confirmation comes when price breaks above the most recent swing high on elevated volume — that's the trigger. If price closes back below the 21-EMA with momentum, the pattern is compromised and the bias flips neutral.
Here's What Most Traders Get Wrong
Most traders treat a moving average cross as the trade signal. It isn't. The cross is the alert. In crypto, where volatility is extreme, acting immediately on a crossover means buying into the spike — exactly when the risk/reward is worst. The edge comes from waiting for the retest of the crossed moving averages. When the 9-EMA crosses above the 21-EMA and price pulls back to tap both lines and holds, that's the setup. You're entering with a defined level to be wrong against, and momentum already confirmed. Trading the cross itself means chasing. Trading the retest means positioning.
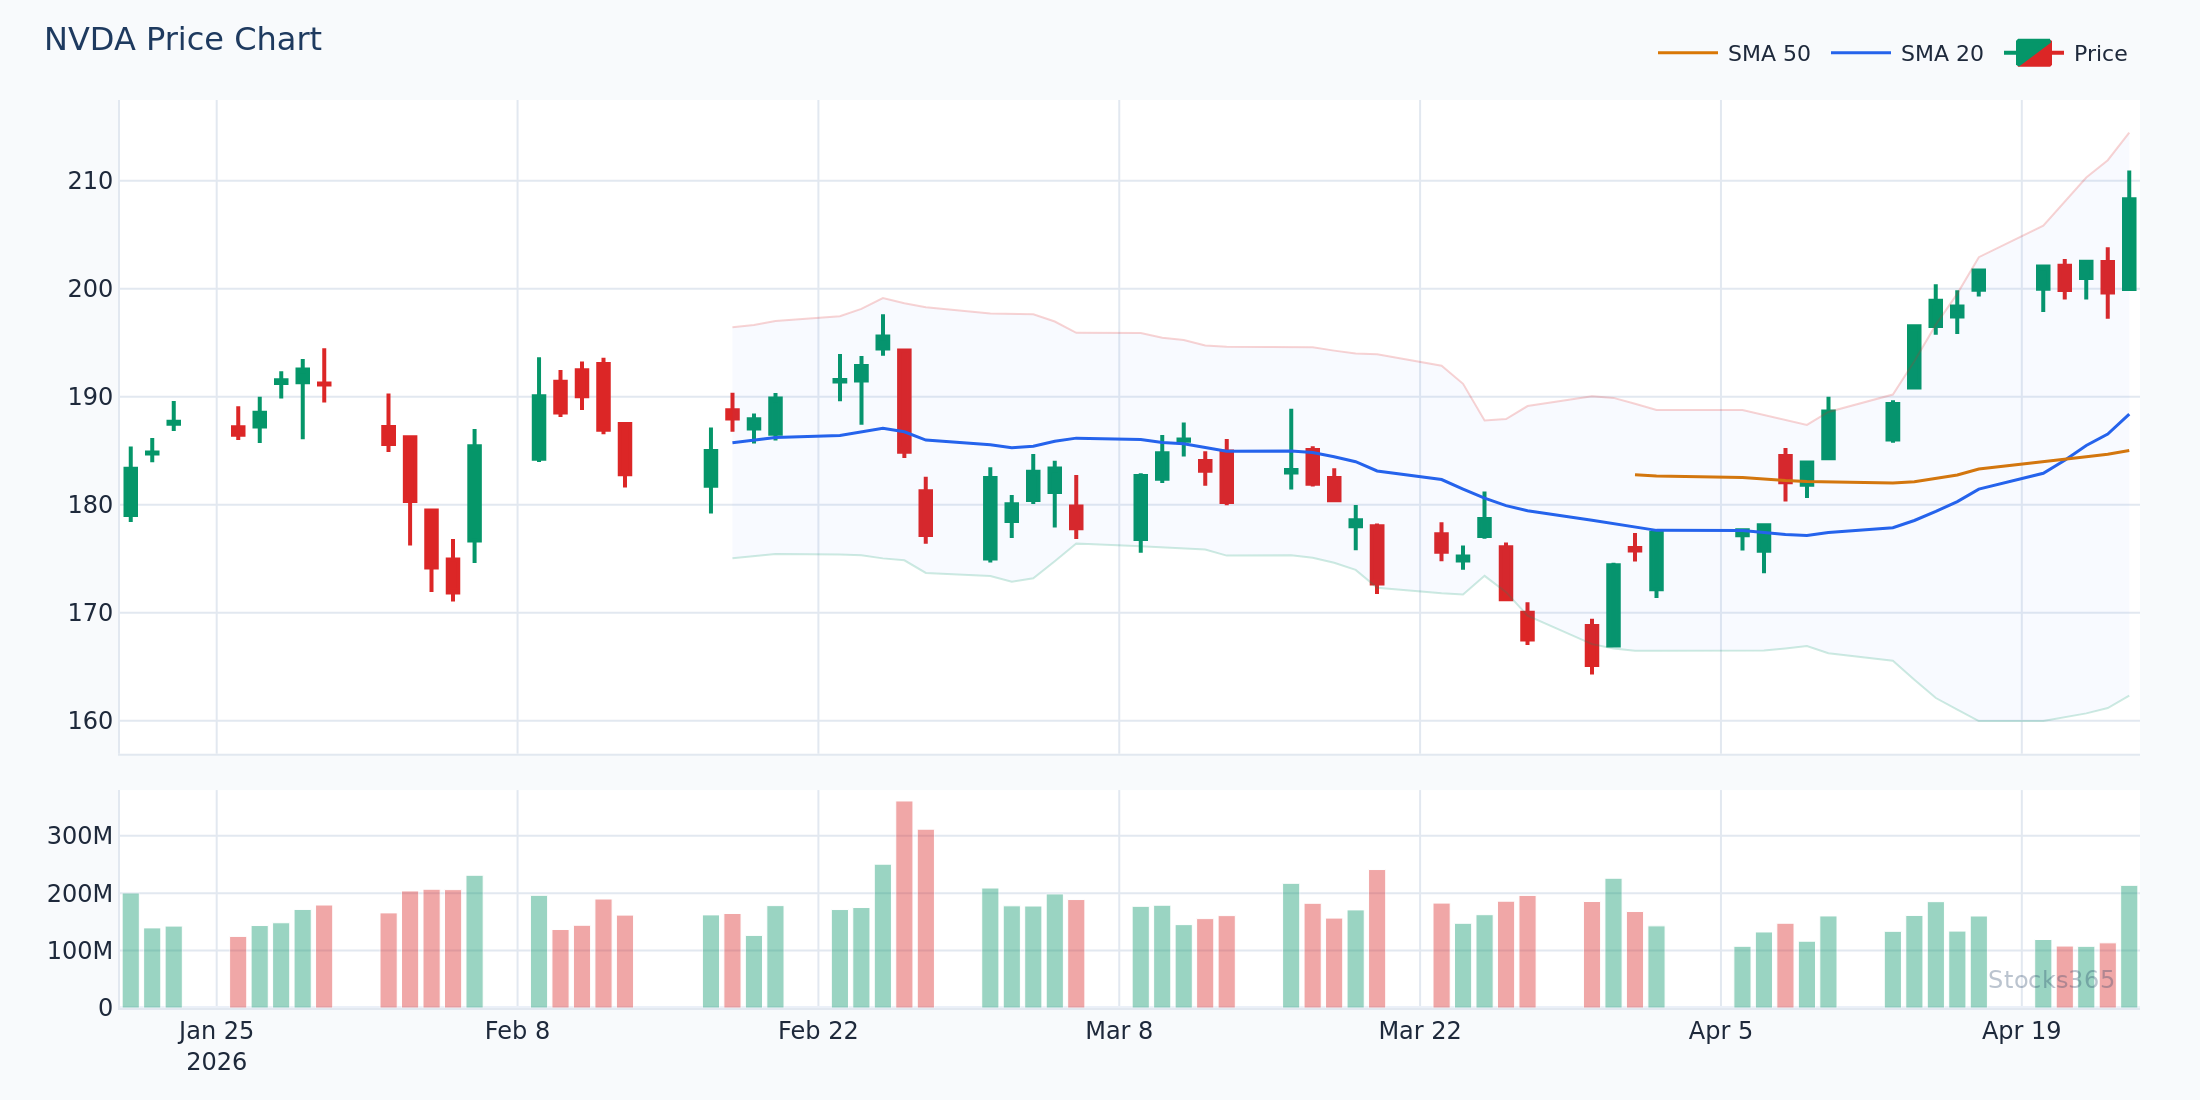
Moving Averages as Dynamic Support and Resistance
This is where moving averages genuinely earn their place in a crypto trader's toolkit. Rather than fixed horizontal levels — which price can slice through without consequence — dynamic moving average levels move with the market.
In a strong Bitcoin uptrend, the 20-day EMA repeatedly acts as a bounce level. Price dips to it, consolidates, and resumes higher. Each successful test reinforces the level. The moment price closes decisively below it — and more critically, fails to reclaim it on a retest — the trend structure is broken.
Watch the quality of the test, not just the price reaching the line. A long lower wick with above-average volume on the bounce candle? Strong signal. A slow grind into the moving average with declining volume on the recovery? Weak — likely fails.
This chart illustrates a textbook dynamic support scenario: price makes three distinct touches on the rising 20-EMA, each producing a bullish rejection candle, with the subsequent moves consistently reaching new highs. The setup invalidates if price gaps below the moving average on high volume and the follow-up candle fails to recover — that sequence signals a regime change, not a buying opportunity.
Applying Moving Averages to Altcoin Trading
Why Altcoins Require Different Settings
Altcoins are not small Bitcoins. Their liquidity profiles, community dynamics, and correlation patterns differ significantly. A 200-day SMA on a low-cap altcoin may have very few meaningful tests — simply because the coin didn't exist two hundred days ago, or has moved in such an explosive range that the 200-day SMA is irrelevant to current price action.
For altcoins, shorter lookback periods dominate: the 20-EMA, 50-EMA, and 100-EMA on daily charts. On 4-hour charts, the 9, 21, and 55 EMAs are widely used within the crypto-native trading community.
EMA Ribbon Strategy
One of the most effective altcoin tools is the EMA ribbon — a series of EMAs plotted simultaneously (typically 8, 13, 21, 34, 55, 89). When the ribbon expands upward (shorter EMAs above longer ones, all sloping up), the asset is in a strong uptrend. When the ribbon compresses and flattens, momentum is fading. When the shorter EMAs cross below the longer ones and the ribbon inverts, the trend has flipped.
The ribbon gives you trend strength and direction at a glance. It's particularly powerful for identifying when an altcoin is in a full trend-expansion phase versus a consolidation — because in crypto, the difference in opportunity between the two is enormous.
Combining Moving Averages with RSI for Crypto Setups
Moving averages tell you trend direction and momentum structure. RSI tells you whether price is extended or compressed within that trend. Together, they form a powerful confirmation system.
A high-probability long setup in crypto looks like this: price is above its 50-EMA (bullish trend), pulls back to the 20-EMA (dynamic support), and RSI simultaneously drops toward the 40-50 zone (mild oversold in an uptrend, not a breakdown). That combination — trend intact, price at structure, momentum reset — defines a favorable entry with clear invalidation.
For deeper understanding of how RSI integrates with trend-following setups, the ultimate step-by-step RSI trading guide covers the full methodology. And if you want to understand RSI divergence — which often signals moving average levels that matter most — RSI divergence explained is essential reading.
The combination of moving average structure with RSI confirmation is how professional crypto traders filter noise from genuine setups.
This chart shows price testing its rising 20-EMA while RSI simultaneously hovers in the 42-48 range — a reset zone within an established uptrend rather than a breakdown signal. The entry trigger fires when price prints a bullish candle off the EMA level with RSI turning back up. If RSI instead breaks below 40 and accelerates lower while price is at the EMA, that's a warning the support level will not hold.
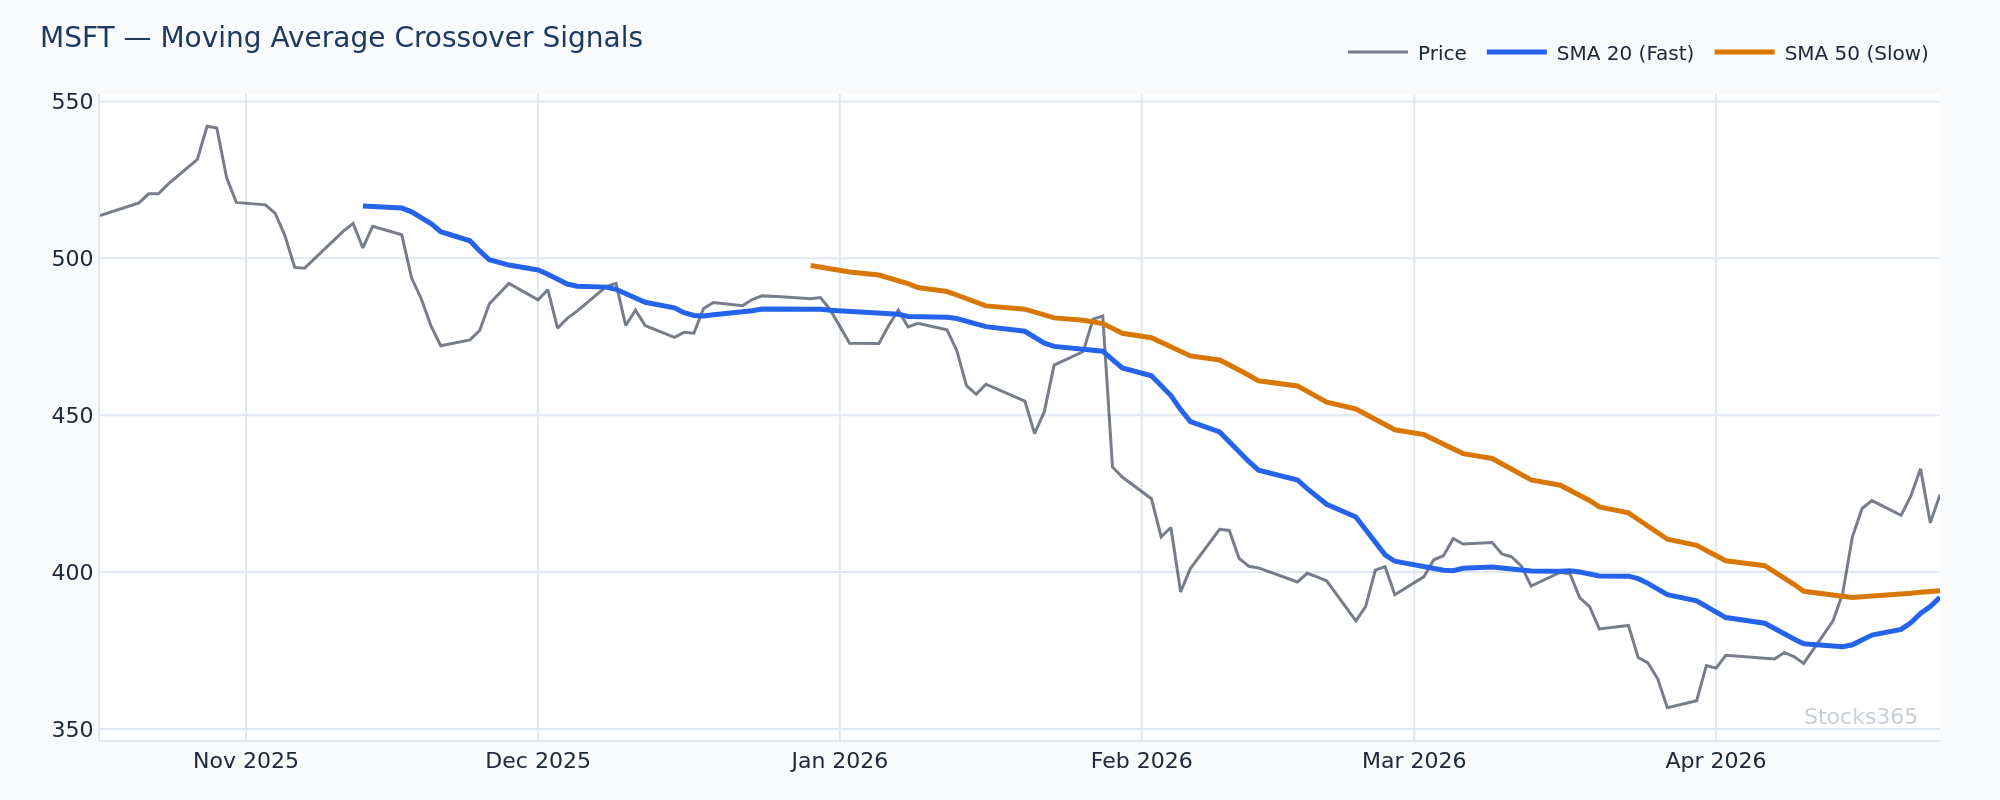
What the Data Says About SMA 20 Signals in Crypto
Our analysis of 3,332 signals finds that price crossing below the SMA 20 produces a 66.8% win rate in crypto over a 10-day holding period — the strongest performance of any asset class in that signal set, compared to just 42.5% for forex. This is a counterintuitive but important finding: in crypto, a cross below the 20-SMA frequently marks a short-term oversold condition that resolves higher within two weeks, especially in assets that are in broader uptrends on higher timeframes. See the full dataset at Stocks365 Insights.
The flip side is equally telling. Stocks365 research across 3,289 instruments found that price crossing above the SMA 20 in crypto produces only a 36.9% win rate — the worst of any asset class. In other words, buying crypto breakouts above the 20-SMA immediately upon the cross is a losing strategy on average. The edge is in the retest, not the initial signal. This reinforces the core discipline: wait for confirmation.
Moving Average Pitfalls Specific to Crypto
Weekend Gaps and Liquidity Gaps
Unlike equities, crypto markets generate price action around the clock. This means moving averages are being calculated on continuous data — but liquidity is not continuous. Low-liquidity periods (early Sunday morning UTC, for example) can produce wicks that briefly violate key moving averages without any real selling pressure behind them. These false breaks are a major source of premature stop-outs for traders who place stops directly at moving average levels.
Give your levels breathing room. A close below the EMA matters. A wick below it often doesn't.
Altcoin Volatility Dilation
Small-cap and mid-cap altcoins can move so fast that moving averages become structurally lagged to the point of uselessness in real-time. During parabolic runs, a 20-EMA might be 25% below current price — telling you nothing actionable. In these conditions, Bollinger Bands or ATR-based tools often serve better as dynamic references. Save the EMA framework for when price is in a more measured trend phase.
If you're also evaluating RSI overbought and oversold levels during these extreme altcoin moves, be aware that RSI can stay overbought far longer than rational analysis would suggest — another reason to always pair momentum indicators with moving average structure for context.
Building a Complete Moving Average System for Crypto
Here's a practical framework that works across Bitcoin and major altcoins:
- Trend Filter (Daily): Is price above or below the 200-day SMA? This sets your directional bias. Above = look for longs. Below = look for shorts or stay out.
- Momentum Gauge (Daily): Is the 50-day EMA sloping upward? Are shorter EMAs stacked above longer ones? EMA stack alignment confirms trend strength.
- Entry Timing (4H or 1H): Wait for pullbacks to the 20-EMA or 21-EMA on the lower timeframe. Look for rejection candles, volume confirmation, and RSI resetting to the 40-50 zone.
- Invalidation: A daily close below the 50-EMA (in a trend trade) or below the 20-EMA with no recovery within 1-2 candles (in a swing setup). Define the level before the trade.
This isn't complex. Clean, consistent application beats exotic indicator stacking every time.
For traders wanting to see how RSI period settings can be tuned to complement different moving average timeframes, that deep-dive is worth the read — particularly the section on calibrating RSI periods for faster crypto markets.
What to Watch For
- EMA ribbon compression followed by expansion in altcoins: When the 8/21/55 EMA ribbon compresses into a tight band after a downtrend, the subsequent expansion — particularly if price breaks above the ribbon on rising volume — often initiates a multi-week trend move. The tighter the compression, the more powerful the expansion tends to be.
- Bitcoin 20-EMA retest after a breakout above the 50-SMA: When Bitcoin clears the 50-day SMA and then pulls back to test the 20-EMA without closing below it, that retest is historically one of the cleaner swing long setups in the asset. Volume on the retest candle matters — declining volume on the dip is constructive.
- 200-SMA reclaim after prolonged bear markets: In major altcoins, the first successful retest and hold of the 200-day SMA following a 60%+ drawdown has historically preceded sustained trend reversals. Watch for two consecutive daily closes above the 200-SMA with RSI holding above 50 as the confirmation sequence.
- Cross below 20-SMA in an established uptrend: Given the 66.8% win rate data in crypto for this signal, a cross below the 20-SMA during a period where the 50-EMA and 200-SMA are still rising deserves attention as a mean-reversion long setup — not an automatic exit signal.
- Death Cross on altcoins in a Bitcoin bear market: When Bitcoin is already below its 200-SMA and an altcoin's 50-day EMA crosses below its 200-day EMA, the compounded bearish pressure typically produces significantly larger drawdowns than either signal alone. In this regime, aggressively fading bounces to declining moving averages is the playbook.
How Stocks365 Uses This
Moving averages are integrated directly into the Stocks365 trust score system as one of 12+ technical indicators that contribute to each asset's signal rating. Specifically, the relationship between price and key moving averages (20-SMA, 50-EMA, 200-SMA) feeds into the trend regime scoring layer — which assesses whether a signal is aligned with or against the prevailing trend structure.
When a crypto asset's moving average configuration signals a bullish trend (price above 50-EMA, 50-EMA above 200-SMA, EMAs in positive slope), buy signals generated by other indicators receive higher trust score weighting. The inverse applies in bearish regimes. This prevents the system from generating high-confidence buy signals in structurally broken markets.
The agreement scoring layer also tracks when multiple moving average timeframes align — a daily, 4-hour, and 1-hour moving average stack all pointing in the same direction generates stronger agreement scores than a single timeframe signal. You can see these scores in action across crypto and equity signals on the Stocks365 signals dashboard.
Key Takeaways
- EMA reacts faster than SMA — better for entries in fast-moving crypto markets. Use SMA for structural levels.
- The 20, 50, and 200-period levels are the most watched across Bitcoin and altcoins. Know what each signals before trading off it.
- Trade the retest, not the cross. Buying the initial EMA crossover in crypto is a low-probability approach. The retest entry is where the edge lives.
- Data confirms: Crypto's cross-below-20-SMA signal wins 66.8% of the time over 10 days — a mean-reversion dynamic unique to this asset class.
- Pair moving averages with RSI for confirmation. Structure (MAs) + momentum state (RSI) = a complete picture. Neither alone is sufficient.
- Altcoins need shorter periods and EMA ribbons to capture their faster trend cycles. The 200-day SMA is less reliable on low-liquidity altcoins.
- Wicks through moving averages in low-liquidity crypto sessions are often noise. Closes matter. Wicks require context.
Frequently Asked Questions
What is the best moving average for crypto trading?
There's no single best moving average — it depends on your timeframe and strategy. For short-term trading, the 9-EMA and 21-EMA on 4-hour charts are widely used. For swing trading, the 20-EMA and 50-EMA on daily charts provide the strongest dynamic support/resistance levels. For macro trend direction, the 200-day SMA is the benchmark most institutional and long-term traders reference. Combine multiple periods to build a complete picture rather than relying on one line.
Do moving averages work in bear markets for crypto?
Yes — but you flip the logic. In bear markets, moving averages become resistance rather than support. Price rallies toward declining moving averages and fails at them. The standard playbook is to short bounces back to the falling 20-EMA or 50-EMA, and treat any rally that reclaims the 200-SMA as a potential regime change requiring reassessment. The Death Cross (50-SMA crossing below 200-SMA) is a reliable bear market confirmation signal in Bitcoin's history.
How do I avoid false signals from moving averages in crypto?
The most effective filter is multi-timeframe alignment. If the daily chart shows a bullish moving average setup but the 4-hour chart's EMAs are bearish, the signal lacks confirmation. Wait for alignment across at least two timeframes. Adding RSI confirmation — particularly watching for RSI to hold above 50 during pullbacks to moving averages in uptrends — significantly improves signal reliability. Also, prioritize closes rather than reacting to wicks, especially during low-liquidity hours.
What's the difference between using moving averages on Bitcoin vs altcoins?
Bitcoin is more liquid, more correlated with macro forces, and its moving average levels are watched by more participants — which makes them self-reinforcing. The 200-day SMA on Bitcoin has clear historical significance. Altcoins move faster, have thinner liquidity, and often require shorter-period moving averages (20-EMA, 50-EMA) to be actionable. EMA ribbons work better for altcoins because they capture trend strength across multiple compression-expansion cycles, which altcoins experience far more frequently.
Should I use moving averages alone for crypto trading?
No. Moving averages identify trend direction and structure, but they don't measure momentum exhaustion or entry timing precisely. Pairing them with RSI — see the complete RSI guide for beginners — gives you both structure and state. Volume analysis adds a third dimension: confirming whether a moving average test or breakout has genuine participation behind it. The strongest crypto setups have moving average structure, RSI confirmation, and volume alignment working together.