
What Is the Stochastic Oscillator?
The stochastic oscillator is a momentum indicator that compares a security's closing price to its price range over a specific period. It tells you how strong or weak recent momentum is — and whether a reversal might be coming. Developed by George Lane in the 1950s, it remains one of the most widely used technical indicators in trading today.
The core idea is simple. When prices are rising, they tend to close near the top of their recent range. When momentum fades, closes drift toward the bottom of the range. The stochastic oscillator measures exactly that drift — and turns it into a number between 0 and 100.
Stocks365 backtested 8,204 oversold stochastic signals across multiple asset classes and found a 54.7% win rate over a 10-day holding period (profit factor: 1.24). That edge is real — but it depends entirely on knowing when and where to apply it. This guide walks you through everything you need to know.
How the Stochastic Oscillator Works
The indicator produces two lines: %K and %D. Understanding both is essential before you place a single trade based on this tool.
The %K Line
%K is the fast line. It measures where the current close sits within the high-low range of the last N periods (typically 14). The formula looks like this:
%K = ((Current Close − Lowest Low) / (Highest High − Lowest Low)) × 100
A %K reading of 80 means price closed in the top 20% of its 14-period range. A reading of 15 means price closed near the bottom. That's it. No magic — just context.
The %D Line
%D is a 3-period simple moving average of %K. It smooths the noise. Most traders watch for %K to cross above or below %D as a signal trigger. When %K crosses above %D, that's a bullish signal. When it crosses below, bearish. Simple in theory — nuanced in practice.
Overbought and Oversold Zones
The stochastic oscillator operates in a bounded range. Two zones matter most:
- Above 80: Overbought — price has been closing near the top of its range consistently
- Below 20: Oversold — price has been closing near the bottom of its range consistently
These zones flag exhaustion. They don't guarantee reversal. That distinction changes everything.
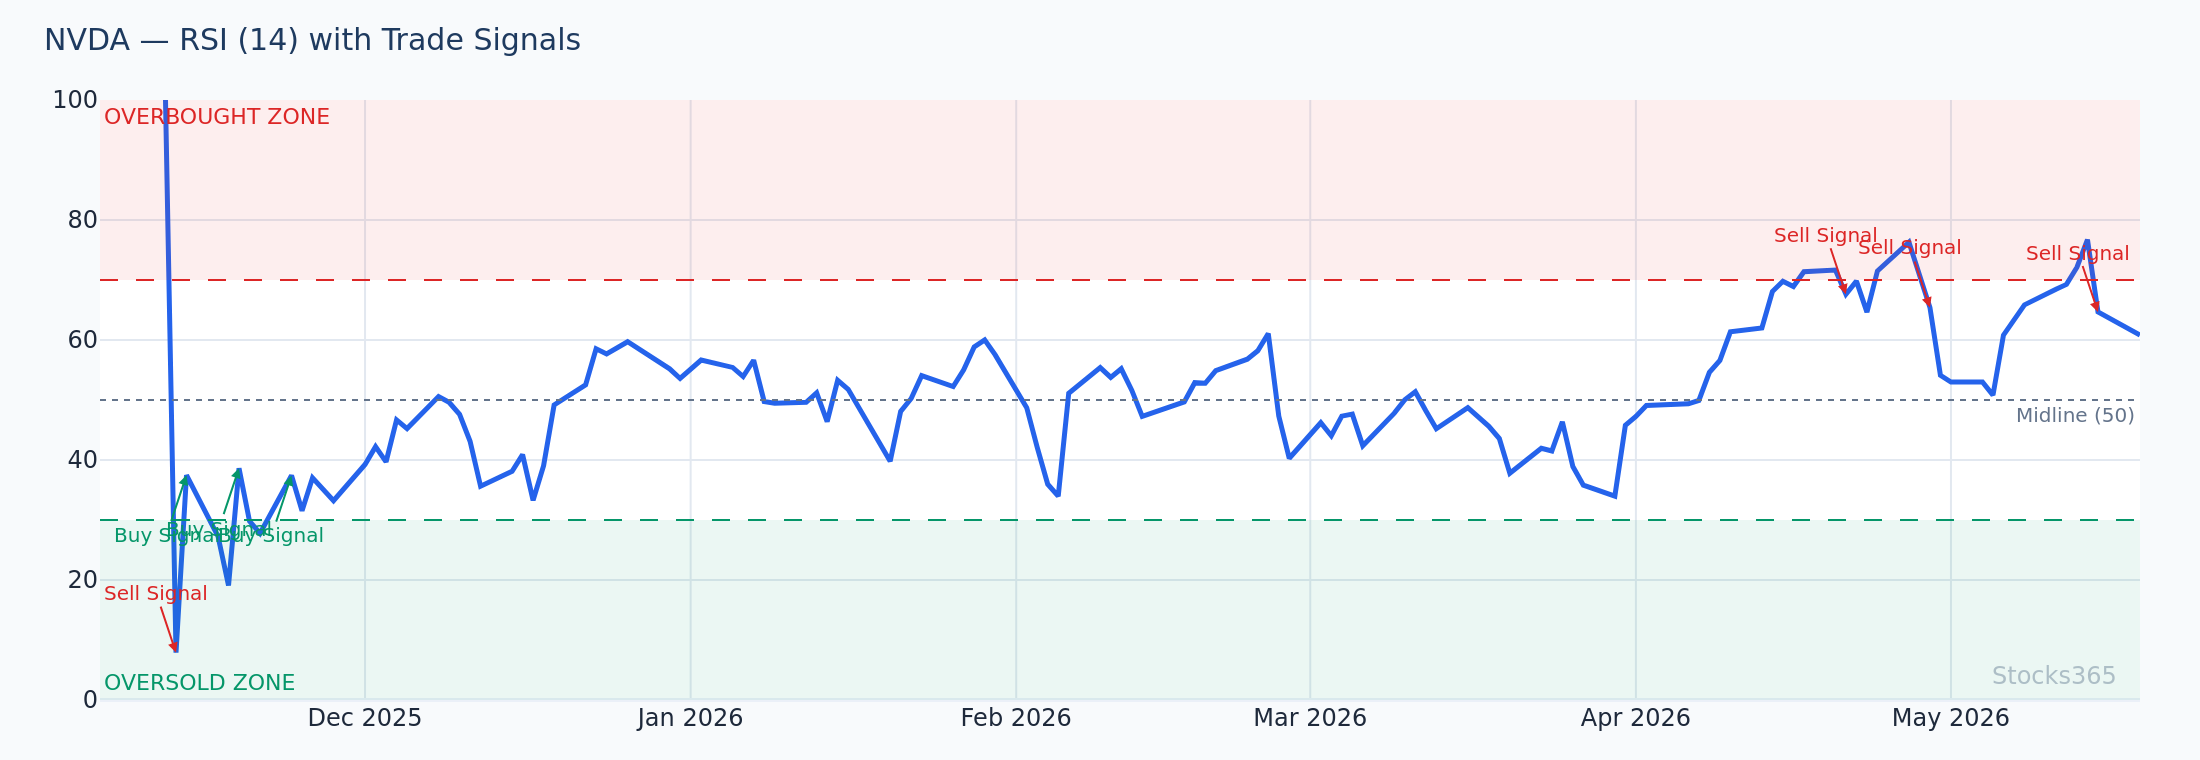
This setup shows %K entering oversold territory below 20 while price forms a series of small-bodied candles near a recent swing low. When %K curls back above 20 and crosses %D, that crossover is the entry trigger — not the initial drop below 20. The pattern is invalidated if price continues making lower lows while stochastic fails to recover above 20 within 3–5 periods.
Fast Stochastic vs. Slow Stochastic
Two versions exist. Most beginners don't realize which one they're using.
Fast Stochastic
Uses the raw %K and a 3-period SMA as %D. Extremely reactive. Produces more signals — and more false ones. Day traders sometimes use it, but the noise-to-signal ratio is brutal for beginners.
Slow Stochastic
The slow version smooths %K itself (using a 3-period average) before calculating %D. This is what most platforms default to, and what most traders mean when they say "stochastic." Fewer signals, cleaner crossovers, fewer whipsaws. Start here.
For most swing traders, the slow stochastic with default settings (14, 3, 3) is the right starting point. Change the settings only after you understand why the defaults work.
How to Read Stochastic Signals
Overbought and Oversold Crosses
The cleanest signals come not from entering the overbought or oversold zone, but from exiting it.
- Bullish signal: %K drops below 20 (oversold), then crosses back above 20 with %K crossing above %D
- Bearish signal: %K rises above 80 (overbought), then crosses back below 80 with %K crossing below %D
This exit-cross approach filters out a significant chunk of false positives. Price can stay oversold for days. The signal fires when momentum actually turns.
Bullish and Bearish Divergence
Divergence is where stochastic gets interesting. Bullish divergence occurs when price makes a lower low but stochastic makes a higher low. That discrepancy signals weakening bearish momentum. Bearish divergence is the opposite — price makes a higher high while stochastic makes a lower high.
Divergence signals work best when they appear near key structure levels. A stochastic bullish divergence forming at a multi-month support zone carries far more weight than one forming in the middle of a range. Context always wins.
This chart shows price retesting a prior swing low while the stochastic oscillator holds above its previous trough — classic bullish divergence. The signal is confirmed when %K crosses above %D and the oscillator exits the sub-20 zone. If price breaks decisively below the prior swing low before that crossover, the divergence is invalidated and the setup is void.
Here's What Most Traders Get Wrong
Most beginners treat stochastic crossing above 80 as an automatic sell signal. In a strong uptrend, stochastic can sit above 80 for weeks — even months. Selling every time it hits overbought in a trending market means selling into strength repeatedly and getting stopped out.
The real edge is watching stochastic BREAK BACK below 80 — not when it first touches it. That exit cross, especially when confirmed by a %K/%D bearish crossover, is the actual signal. Entering overbought territory first is just context. The cross back out is the trigger. This one adjustment dramatically improves the quality of signals you act on.
Same logic applies in reverse for oversold. Don't buy because stochastic touched 20. Buy when it bounces back above 20 with momentum behind it.
When the Stochastic Oscillator Works — and When It Doesn't
The stochastic oscillator is a range-bound momentum tool. That tells you exactly when to trust it and when to ignore it.
When It Works Best
- Ranging or sideways markets: Price oscillates between support and resistance — stochastic overbought/oversold signals align naturally with those turning points
- After extended moves: When price has moved significantly in one direction, stochastic exhaustion signals carry more weight
- Combined with structure: When oversold readings coincide with a clear prior support zone or demand area
- Forex markets: Our analysis of 8,204 stochastic oversold signals shows forex leads all asset classes with a 57.0% win rate — currency pairs tend to mean-revert more consistently than other instruments
When It Fails
- Strong trending markets: In a powerful trend, stochastic stays overbought or oversold for long stretches. Fading the trend based on stochastic alone destroys accounts.
- Low-liquidity environments: Thin markets produce erratic stochastic readings with no predictive value
- During news-driven moves: Fundamental catalysts override any technical signal. A stochastic oversold reading during an earnings miss means nothing.
Stochastic is not a standalone system. It is a confirmation tool. Use it alongside trend filters, structure analysis, and volume context — never in isolation.
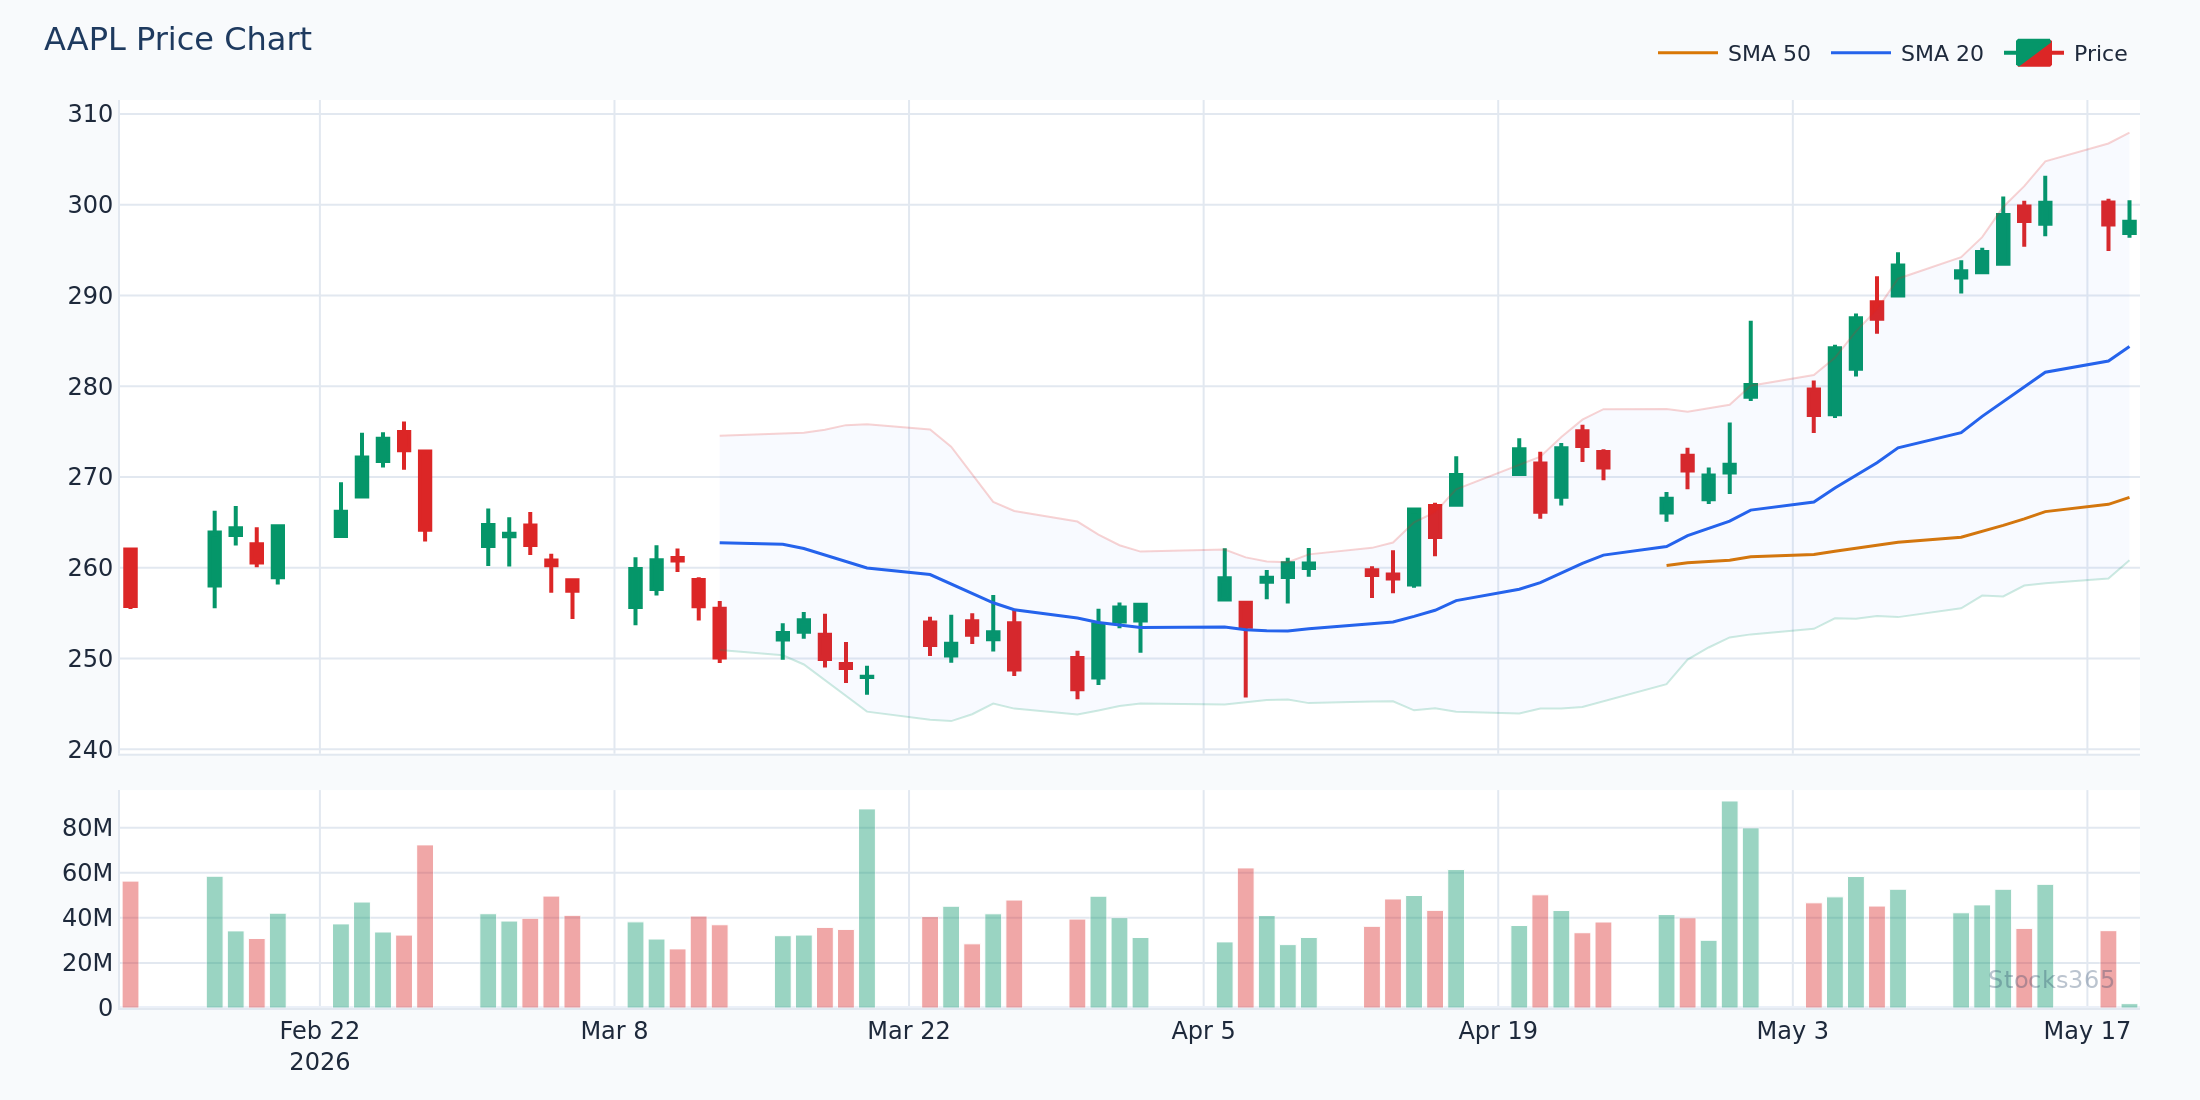
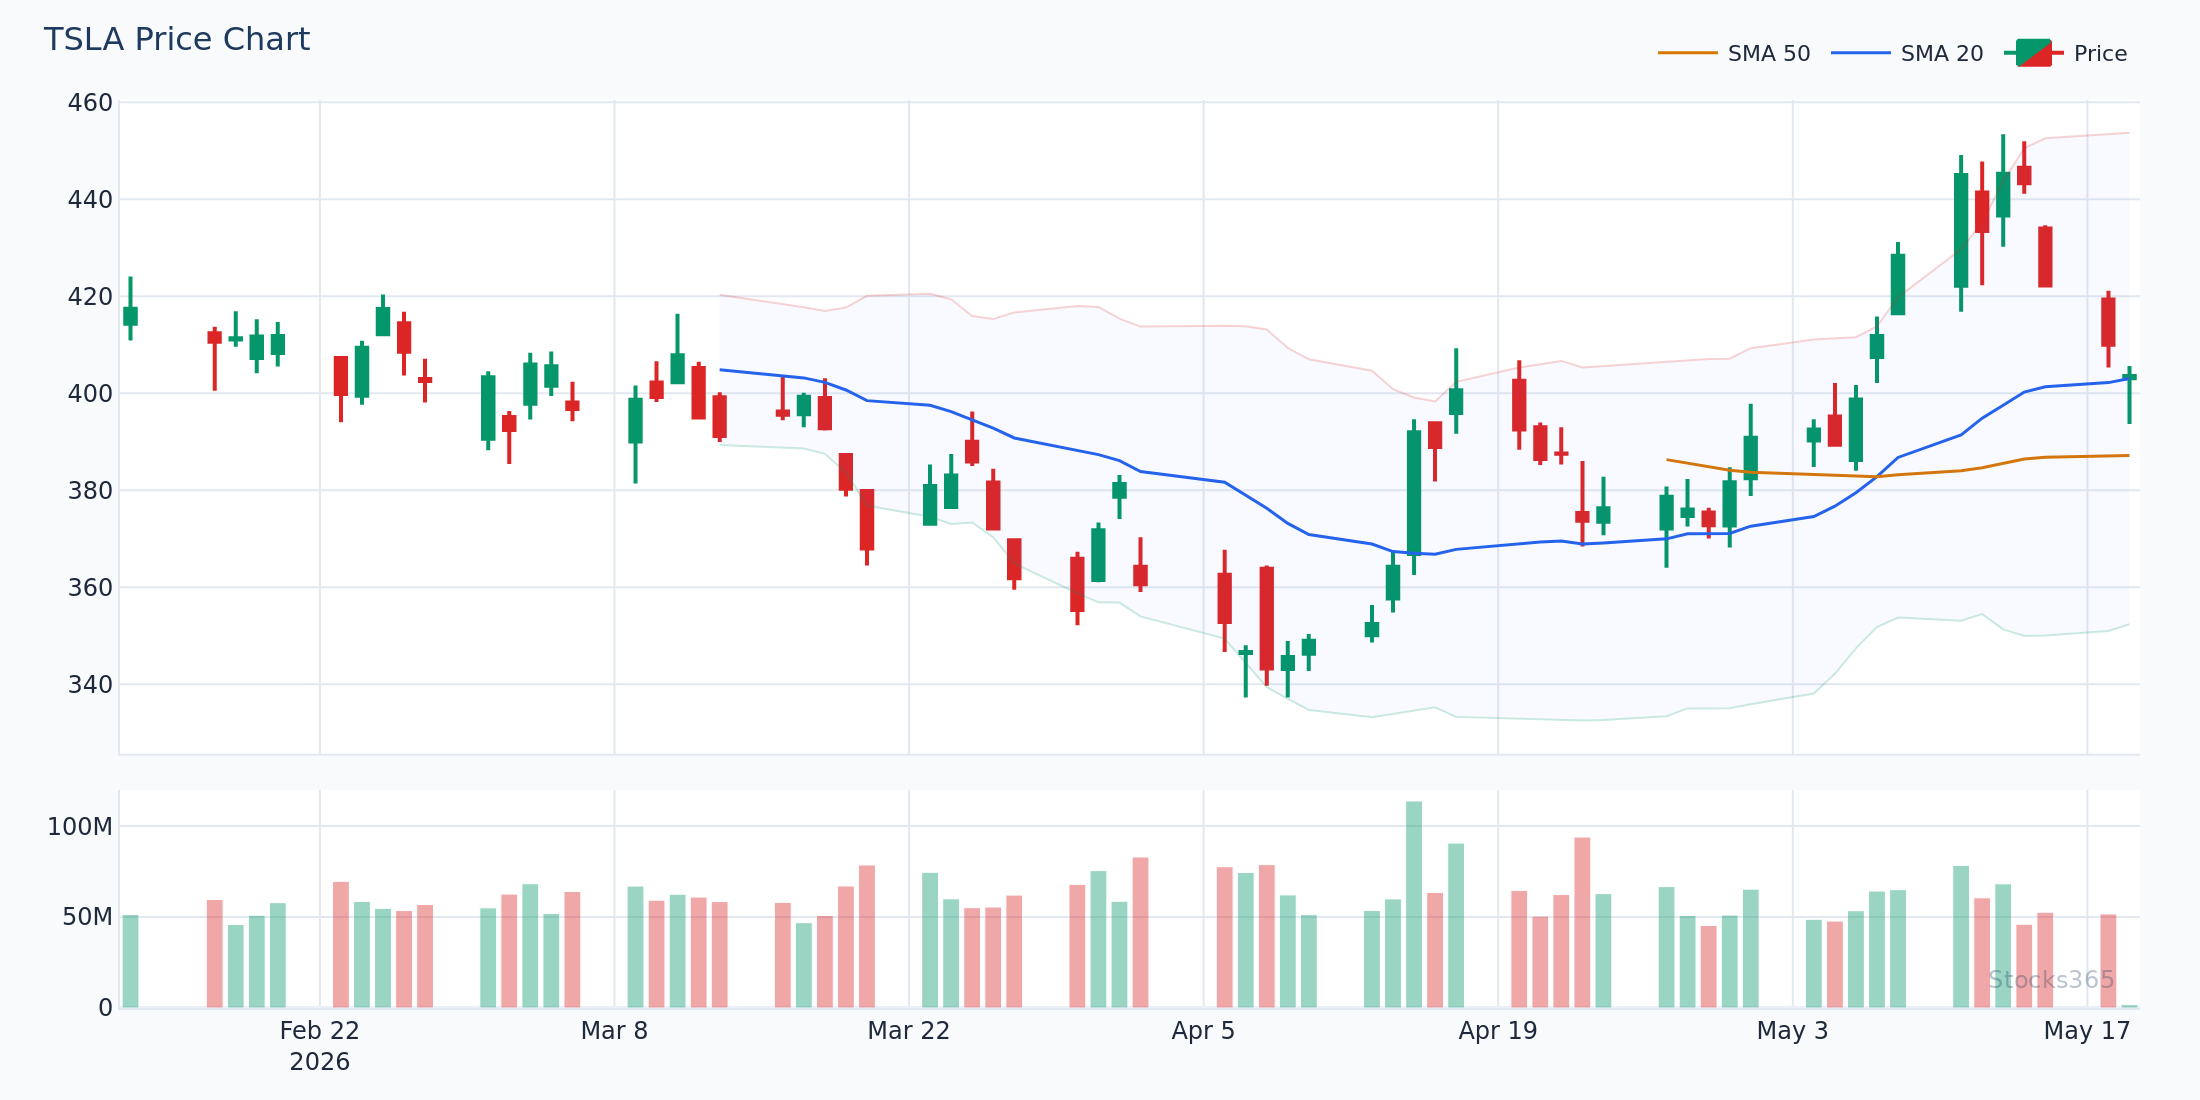
This setup shows price trading above its 50-period SMA (bullish trend context) while stochastic dips into oversold territory. This is a pullback entry setup — the trend filter keeps you from shorting overbought readings in an uptrend and improves the quality of oversold entries significantly. The setup is invalidated if price closes below the 50-SMA before stochastic recovers.
Combining Stochastic With Other Indicators
Stochastic works hardest when it doesn't work alone. Pairing it with complementary tools amplifies the signal quality significantly.
Stochastic + Bollinger Bands
This is one of the most powerful combinations available to retail traders. When price touches the lower Bollinger Band and stochastic is in oversold territory simultaneously, that double confluence signal is far more reliable than either alone.
Our analysis of 2,501 BB + Stochastic double oversold signals found a 58.9% win rate with a profit factor of 1.61 over a 10-day holding period — with commodities leading at 61.1%. That's meaningful edge, especially compared to the 48.8% win rate for stochastic overbought signals used in isolation (profit factor: 0.86). The data from our research dashboard makes this comparison stark: oversold signals outperform overbought signals, and combining with Bollinger Bands pushes edge further.
For a complete framework on using Bollinger Bands alongside moving averages, the Moving Average + Bollinger Bands: Complete Strategy Guide on Stocks365 is an excellent companion read.
Stochastic + RSI
RSI measures the speed of price change. Stochastic measures where price closes within its range. Together, they give you a fuller momentum picture. When both indicators show oversold at the same time, the signal carries more conviction.
If you're building out your RSI toolkit, How to Use RSI in Trading: The Ultimate Step-by-Step Guide covers the full methodology. For understanding exactly how overbought and oversold RSI levels behave in practice, see RSI Overbought and Oversold Levels: Master the Signals.
Stochastic + Moving Average Trend Filter
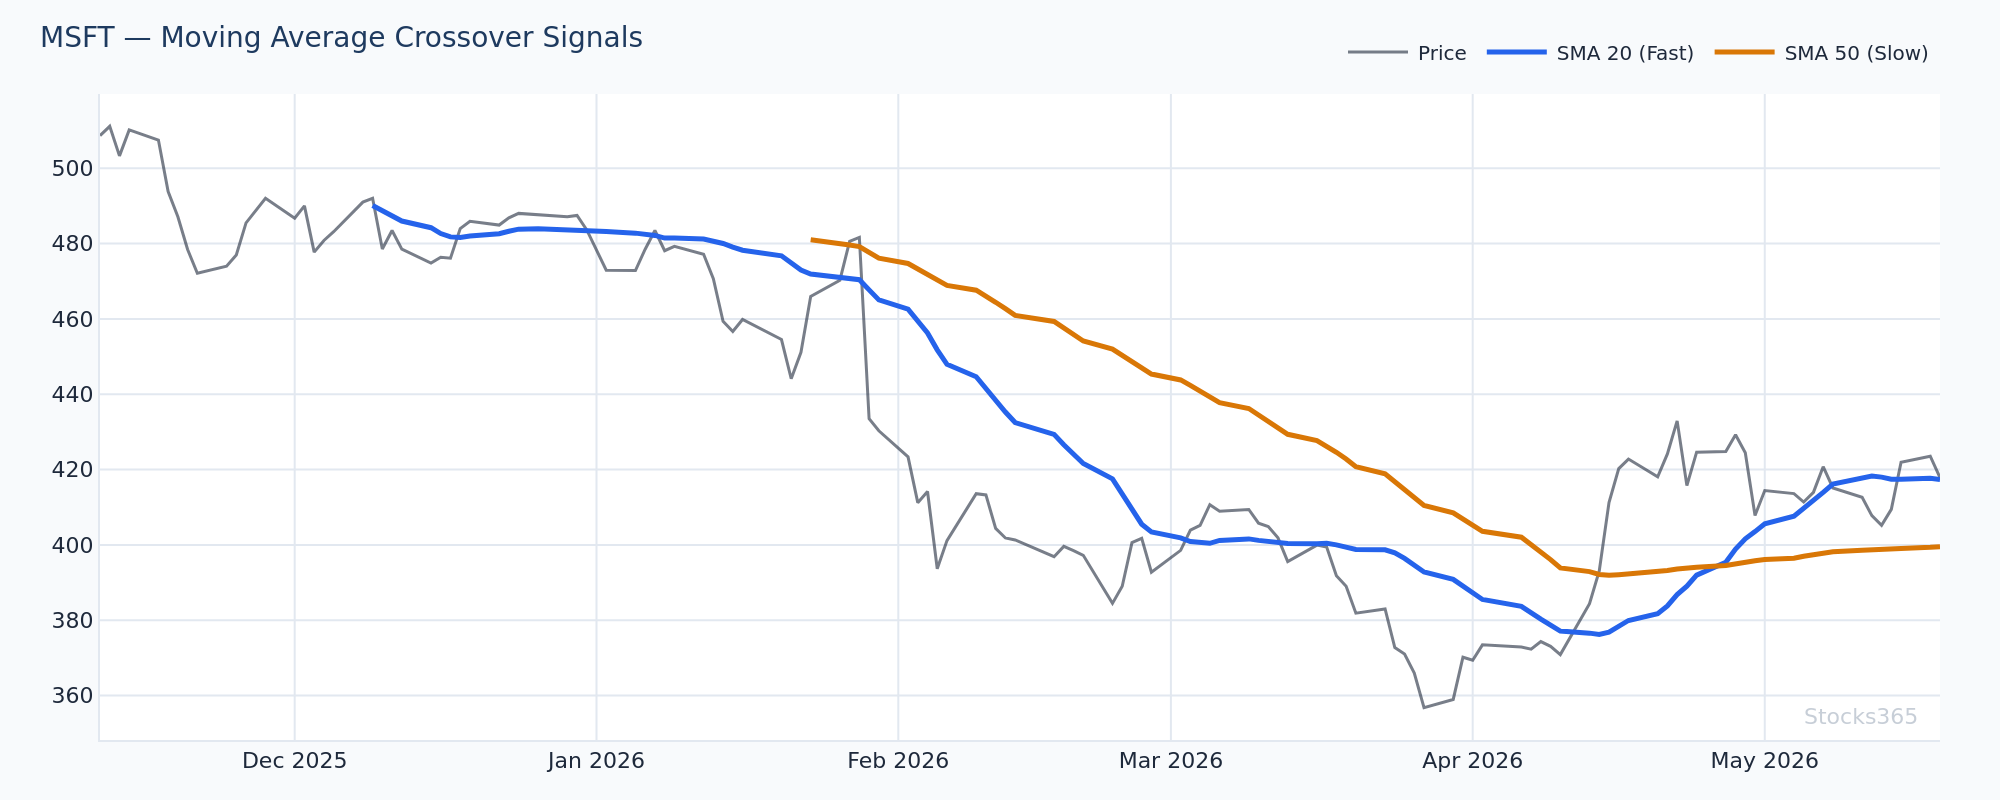
The most common and effective use case: use a moving average to define trend direction, then use stochastic to time entries within that trend. Only take stochastic oversold signals when price is above its key moving average. Only take overbought signals when price is below it.
For building a robust trend filter framework, the Triple Moving Average Strategy for Trend Confirmation article covers multi-timeframe trend confirmation that pairs perfectly with stochastic entry timing.
Stochastic + MACD
MACD measures trend and momentum over a longer horizon. Stochastic is faster and more sensitive. When MACD is in bullish territory and stochastic gives an oversold bounce signal, that alignment across timeframes is high-quality. The MACD in Forex Trading guide covers how to integrate momentum indicators in currency markets where oversold stochastic signals statistically perform best.
This chart shows stochastic exiting the oversold zone with a %K/%D bullish crossover while the MACD histogram simultaneously turns from negative to positive — dual momentum confirmation. When both signals align on the same candle or within one to two periods of each other, historical follow-through improves substantially. The pattern is invalidated if MACD histogram returns to negative before stochastic fully exits oversold territory.
Practical Stochastic Trading Setups
Setup 1: Oversold Bounce in an Uptrend
This is the bread-and-butter stochastic setup for swing traders.
- Price is above its 50-period or 200-period moving average (trend is up)
- Price pulls back and stochastic drops below 20
- %K crosses back above 20 and above %D
- Volume confirms the bounce (above average on the reversal candle)
- Enter on the candle after the confirmed crossover
This setup harvests the mean-reversion tendency within an established uptrend. You're not trying to catch falling knives — you're buying dips in a confirmed bull structure.
Setup 2: Stochastic + Bollinger Band Double Oversold
- Price closes at or beyond the lower Bollinger Band
- Stochastic %K is below 20 simultaneously
- %K forms a hook upward (begins curling back toward 20)
- Wait for the %K/%D crossover above 20 for entry confirmation
This double-confluence setup is where the edge really shows. As mentioned above, Stocks365's backtested data across 2,501 signals shows this combination produces a 1.61 profit factor — well above the baseline stochastic signal in isolation.
Setup 3: Stochastic Divergence at Structure
- Price makes a lower low that tests a clear prior swing low or support zone
- Stochastic makes a higher low (bullish divergence)
- %K crosses above %D within the oversold zone or just above 20
- Enter on the divergence confirmation candle
Structure + divergence + crossover. Three confirming factors. This setup is less frequent but higher conviction when it forms.
Stochastic Settings: What to Use
The default settings (14, 3, 3) work well for most swing trading timeframes. Here's a quick reference:
- Day trading (1–5 min charts): Some traders shorten to (5, 3, 3) for faster signals — but noise increases sharply
- Swing trading (daily charts): Default (14, 3, 3) is optimal for most strategies
- Position trading (weekly charts): Some traders extend to (21, 5, 5) for smoother readings on longer timeframes
Don't obsess over settings optimization. The difference between (14, 3, 3) and (12, 3, 3) is negligible. Discipline and context matter infinitely more than finding the "perfect" parameter.
What to Watch For
- Stochastic oversold bounce in confirmed uptrends: When price pulls back to a rising 50-SMA and stochastic simultaneously drops below 20, watch for the %K/%D bullish crossover — this setup produces some of the cleanest mean-reversion entries in swing trading
- Double-confirmation setups with Bollinger Bands: When price closes below or at the lower Bollinger Band while stochastic is sub-20, the convergence of two independent oversold signals dramatically increases follow-through probability — especially in commodity markets
- Stochastic divergence at multi-week lows: If stochastic makes a higher low while price makes a lower low after a sustained downtrend of 15%+, that divergence at a prior structural support level is worth close monitoring for a reversal setup
- Overbought readings in crypto during momentum phases: Stochastic overbought signals in crypto carry a 58.9% win rate on the short side — the highest of any asset class in our dataset — making bearish stochastic crosses in crypto more reliable than in stocks or commodities
- %K/%D crossovers combined with volume surges: A stochastic crossover out of oversold territory accompanied by volume 1.5x or more above the 20-period average is a significantly stronger signal than the same crossover on below-average volume
How Stocks365 Uses This
🔬 How Stocks365 Integrates the Stochastic Oscillator
The stochastic oscillator is one of 12+ indicators that feed into the Stocks365 Trust Score system. It contributes specifically to the momentum agreement component of the score — measuring whether short-term momentum signals align with the broader directional bias calculated from trend and volatility indicators.
When stochastic gives an oversold bounce signal that aligns with bullish readings from the moving average regime filter and elevated volume confirmation, the Trust Score for that signal increases. When stochastic fires in isolation — no trend context, no volume, no structural support nearby — the Trust Score discounts it accordingly.
This is exactly why raw stochastic signals have a 54.7% win rate in our backtests, but filtered signals through the Trust Score system show materially higher hit rates. The indicator is valuable. The context around it is what separates edge from noise.
You can see live stochastic-informed signals on the Stocks365 signals dashboard or explore individual setups like AAPL signals to see how Trust Score integrates momentum, trend, and volatility data in real time.
Key Takeaways
📌 Key Takeaways: Stochastic Oscillator
- The stochastic oscillator measures where price closes within its recent high-low range, producing a 0–100 reading
- Readings above 80 signal overbought conditions; below 20 signals oversold — but the actual trade signal comes when stochastic exits those zones, not enters them
- %K crossing above %D is bullish; %K crossing below %D is bearish — always wait for the crossover, not just the zone touch
- Stochastic oversold signals carry a 54.7% win rate (n=8,204) — strongest in forex at 57.0%
- Combining stochastic with Bollinger Bands in a double-oversold setup pushes win rate to 58.9% (n=2,501) with a 1.61 profit factor
- Never use stochastic alone in strong trends — it will signal overbought repeatedly while price keeps climbing
- Pair with a trend filter (moving average), volume confirmation, and structural context for highest-quality signals
- The slow stochastic (14, 3, 3) is the correct starting point for most swing traders