
Bollinger Band Bounce Strategy: How Mean Reversion Actually Works
Price doesn't travel in straight lines. It stretches, snaps back, overshoots, and recalibrates — constantly. The Bollinger Band bounce strategy is built on one core truth: extreme deviations from the mean tend to reverse. Understanding when that reversion is likely — and when it isn't — separates profitable mean reversion traders from the ones who keep buying falling knives.
Stocks365 backtested 3,255 Bollinger Upper Band touch signals across stocks, crypto, forex, and commodities. The overall win rate came in at 49.6% — but the asset class breakdown tells a far more useful story. Crypto produced a 56.7% win rate on these setups. Commodities? Just 41.5%. The strategy isn't broken. It's just environment-dependent. More on that shortly.
This guide covers the complete Bollinger Band bounce strategy: the mechanics, the setups that work, the confirmation signals that tilt probability in your favor, and the mistakes that bleed accounts dry.
What Are Bollinger Bands? A Quick Refresher
Bollinger Bands consist of three lines plotted on a price chart:
- Middle Band: A 20-period simple moving average (SMA)
- Upper Band: 20-SMA plus two standard deviations
- Lower Band: 20-SMA minus two standard deviations
The bands expand during volatile periods and contract during low-volatility consolidation. By definition, roughly 95% of price action falls within the bands. When price touches or breaks outside them, it's statistically unusual — and that's where the opportunity lives.
For a deeper breakdown of how buy and sell signals are generated across different Bollinger Band configurations, check out the Bollinger Bands Buy and Sell Signals Master Guide.
The Core Bollinger Band Bounce Setup
The bounce strategy is straightforward in concept. Price touches the lower band, signals oversold conditions, and reverts toward the 20-SMA middle band. Conversely, price touches the upper band, signals overbought conditions, and reverts downward. The middle band acts as the gravitational center — the mean everything eventually returns to.
Lower Band Bounce (Long Setup)
The lower band bounce is the more popular of the two, and for good reason. Fear-driven selloffs create sharp, fast deviations that snap back quickly once panic exhausts itself.
A clean lower band bounce setup looks like this:
- Price closes at or below the lower Bollinger Band
- The following candle opens and begins moving back inside the bands
- Volume on the reversal candle expands relative to recent average
- A confirmation close above the lower band signals entry
- Target: the 20-SMA middle band (minimum), with extended targets at the upper band
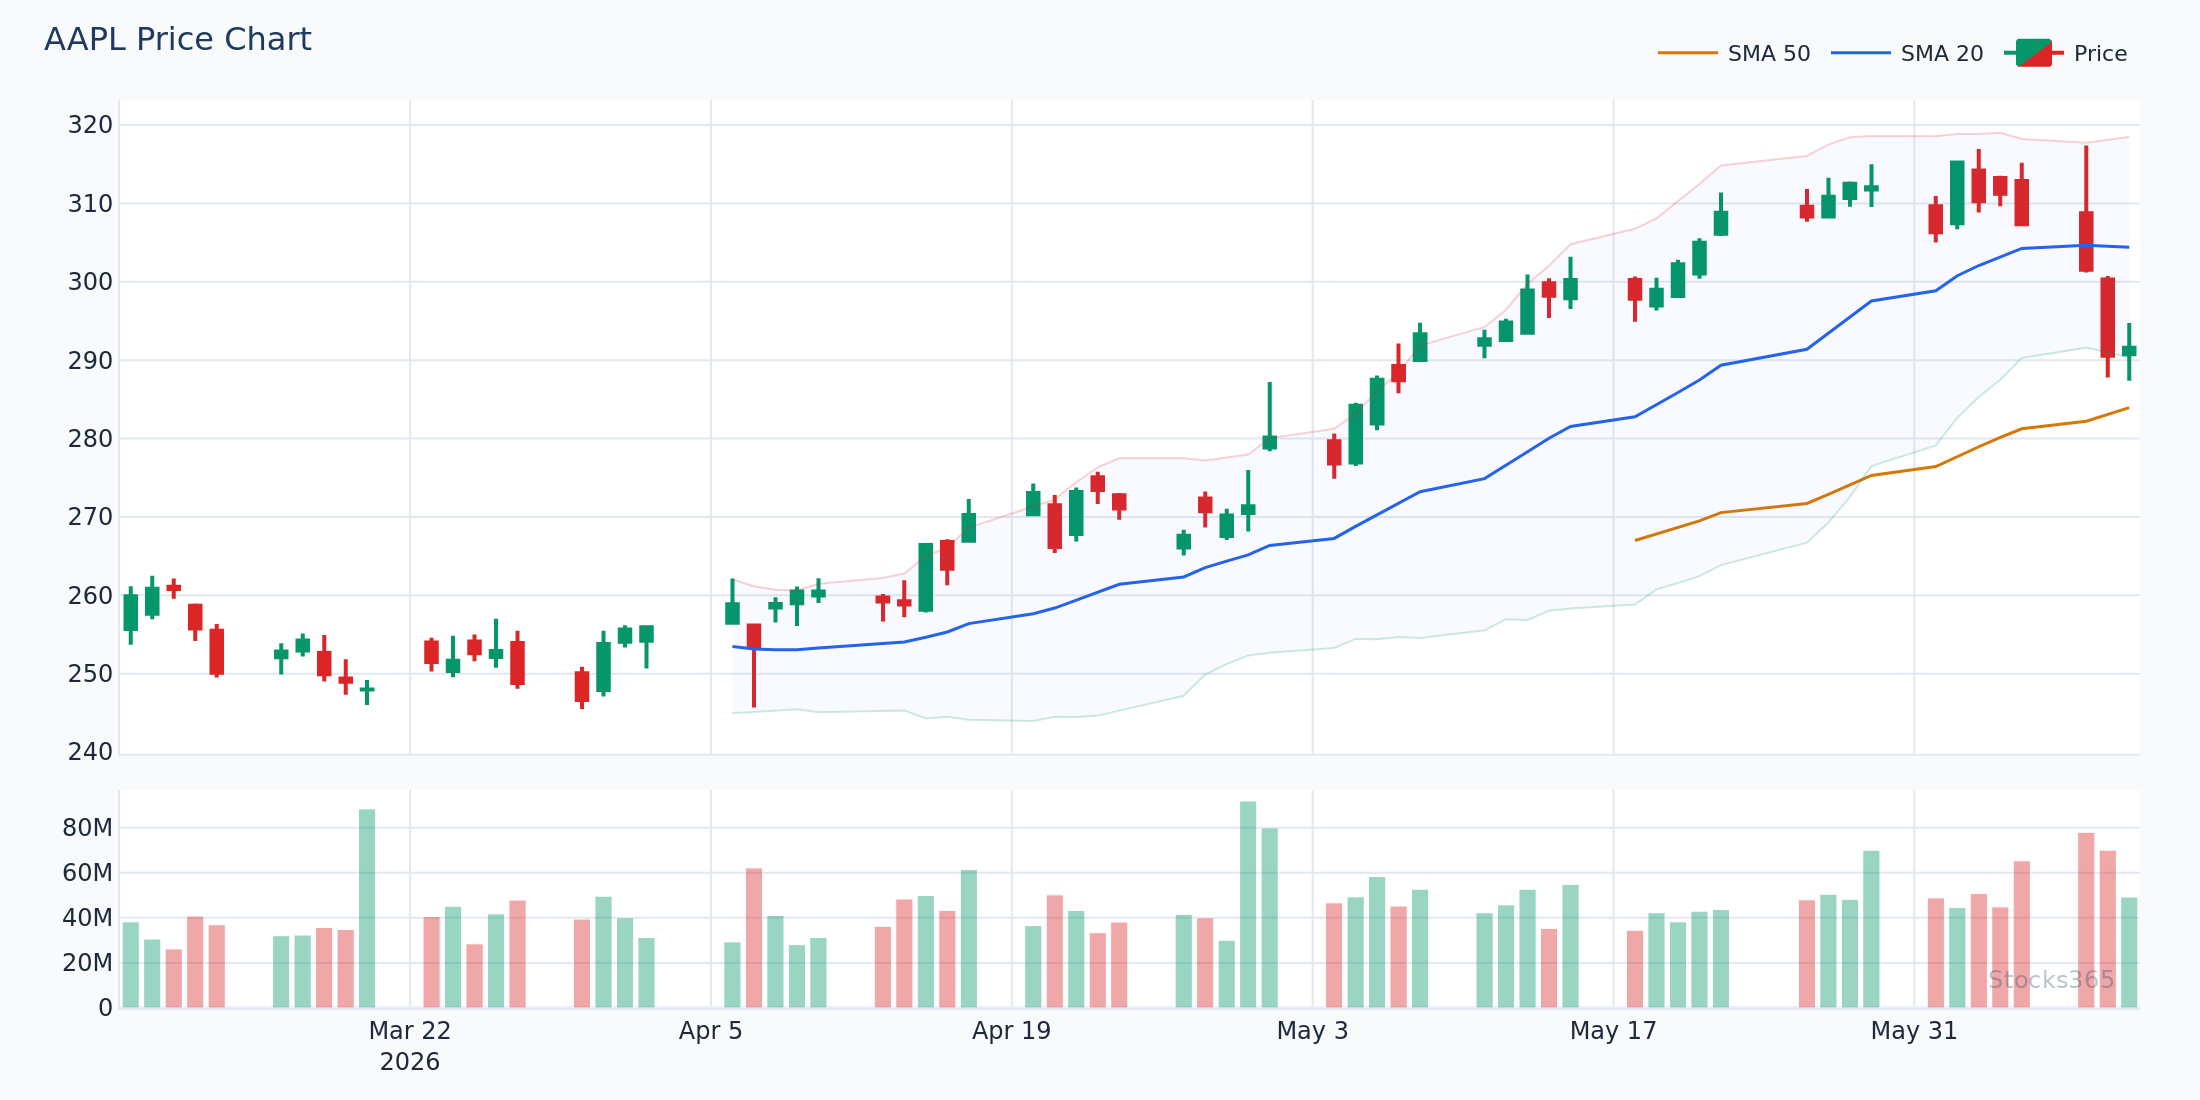
This chart shows price tagging the lower band after a multi-day decline, followed by a rejection candle with expanded volume. When the next candle closes back inside the band, the bounce is confirmed. The first meaningful resistance level to watch is the 20-SMA — if price reclaims it decisively, the move often continues toward the upper band.
Upper Band Bounce (Short or Exit Setup)
Upper band touches signal that buyers have pushed price into statistically extreme territory. The reversal play here is either a short entry or, more commonly for long-biased traders, an exit signal on existing positions.
- Price closes at or above the upper Bollinger Band
- Bearish reversal candle forms (shooting star, engulfing, or doji) on the next session
- Volume contracts on the move higher (weak buying pressure)
- Entry on a close back below the upper band
- Target: the 20-SMA middle band
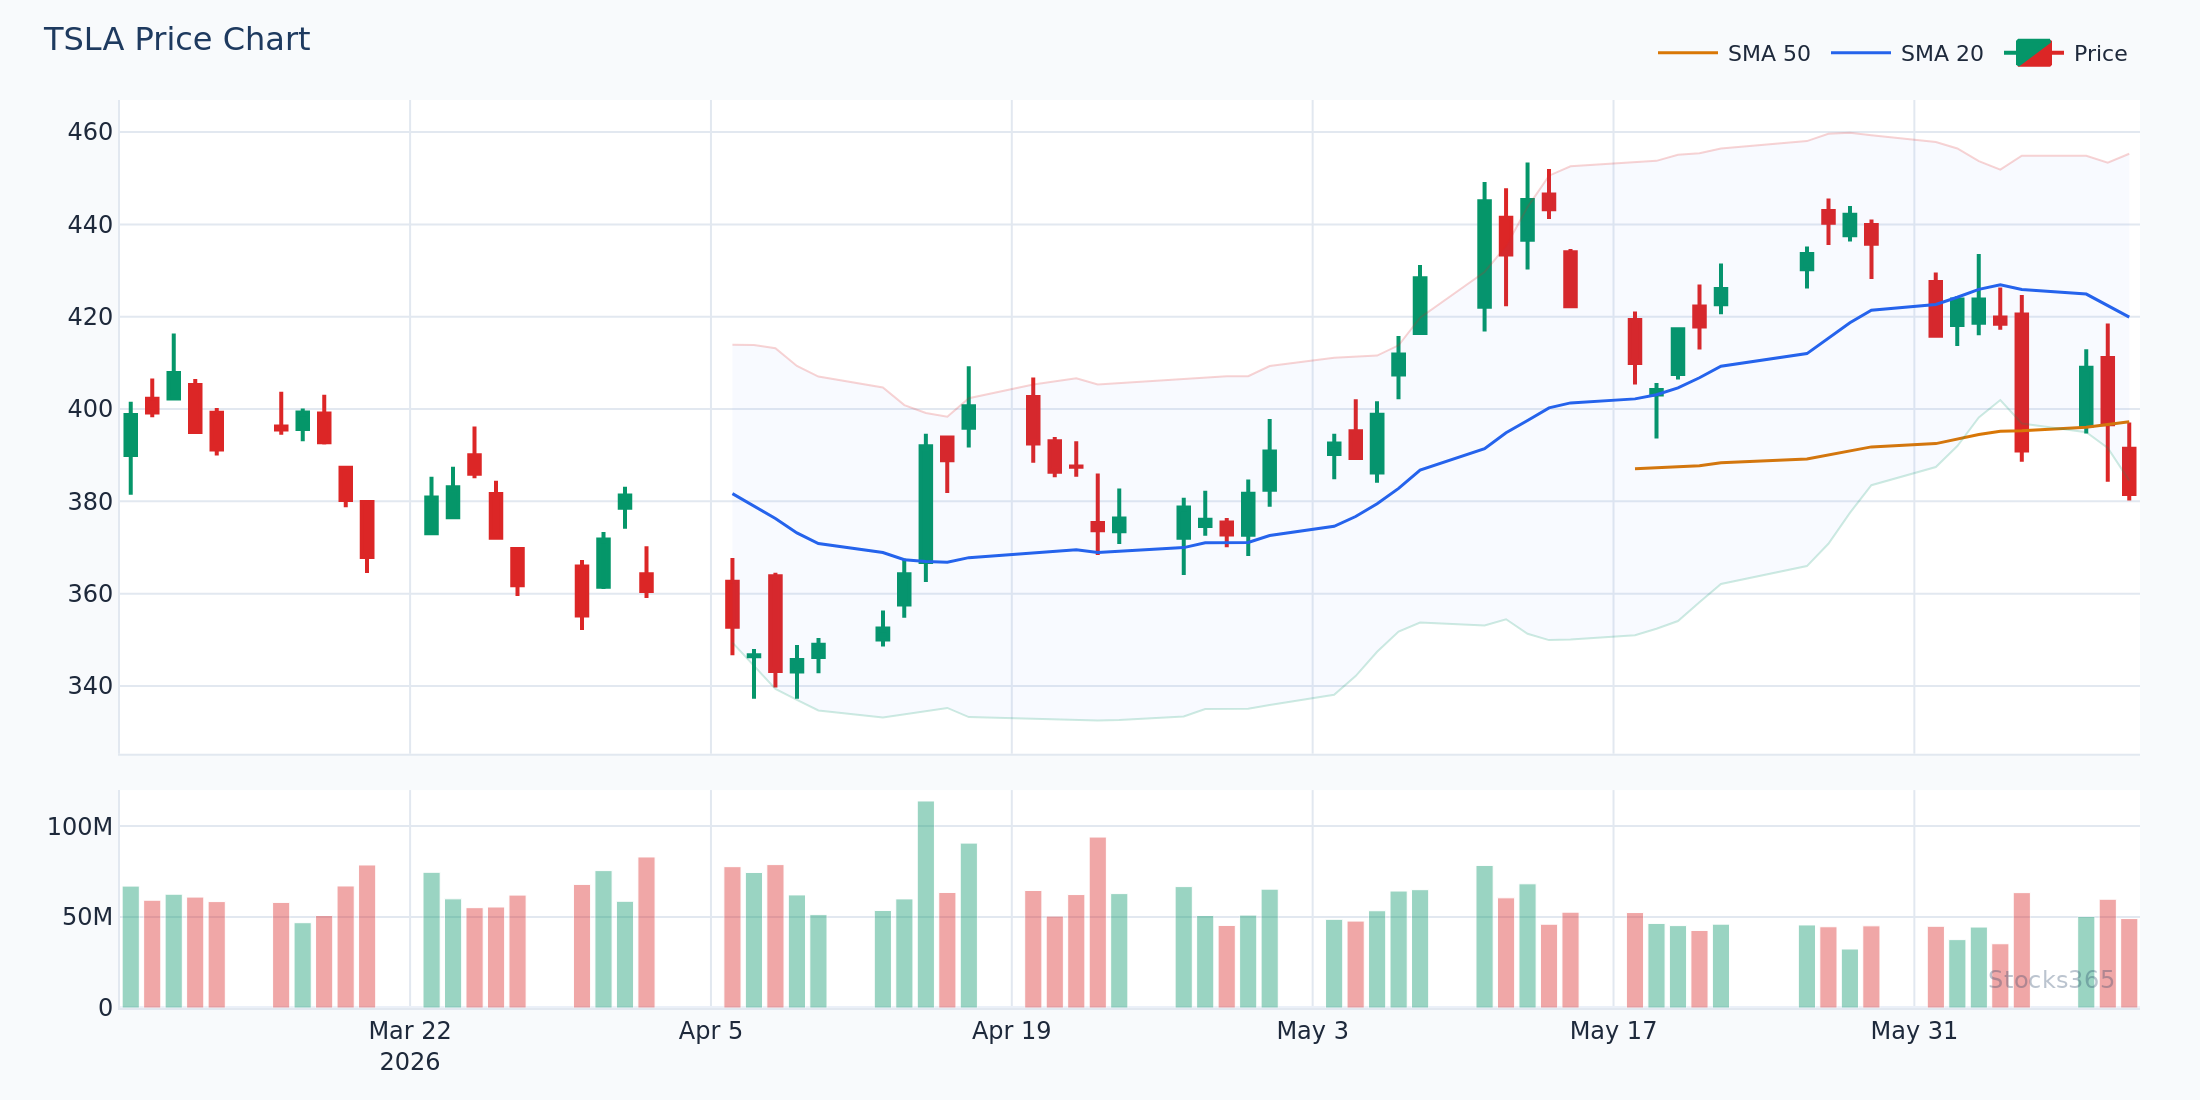
Notice how price walks the upper band for two sessions before a sharp reversal candle closes back inside the band. This is a classic exhaustion pattern. The key invalidation signal here is if price continues closing above the upper band — that signals a trend breakout, not a mean reversion setup, and the short thesis collapses.
When the Bollinger Band Bounce Works (And When It Doesn't)
Here's what most traders get wrong: they treat every band touch as an automatic bounce signal. It isn't. In trending markets — especially strong uptrends — price can walk the upper band for days or weeks without reverting. Buying the lower band in a downtrend is how accounts get destroyed one small loss at a time.
The Bollinger Band bounce is a mean reversion strategy. It thrives in ranging, oscillating markets. It struggles in trending ones. Identifying the regime before entering is non-negotiable.
Conditions That Favor the Bounce
- Flat or slightly sloping 20-SMA: A flat middle band confirms range-bound conditions where mean reversion is reliable.
- Band width at or near recent averages: Neither extremely tight (pre-breakout) nor extremely wide (trending hard).
- Oscillator confirmation: RSI below 30 on a lower band touch, or above 70 on an upper band touch, validates the extreme reading.
- Clean price structure: No obvious macro downtrend or uptrend in the background.
Conditions That Kill the Bounce
- Steeply sloping 20-SMA: A rising or falling 20-SMA tells you trend momentum is in control. Don't fade it.
- Band expansion accelerating: Wide, expanding bands mean volatility is increasing — often a sign of trend continuation, not reversal.
- Fundamental catalyst: Earnings misses, macro shocks, and sector rotations can override technical setups entirely.
- Low-volume band touches: A band touch on below-average volume often lacks the exhaustion needed to trigger a real bounce.
Our research dashboard tracks this exact environment filter across multiple asset classes — and the performance gap between trending and ranging regimes is substantial. This is precisely the kind of edge that backtesting surfaces.
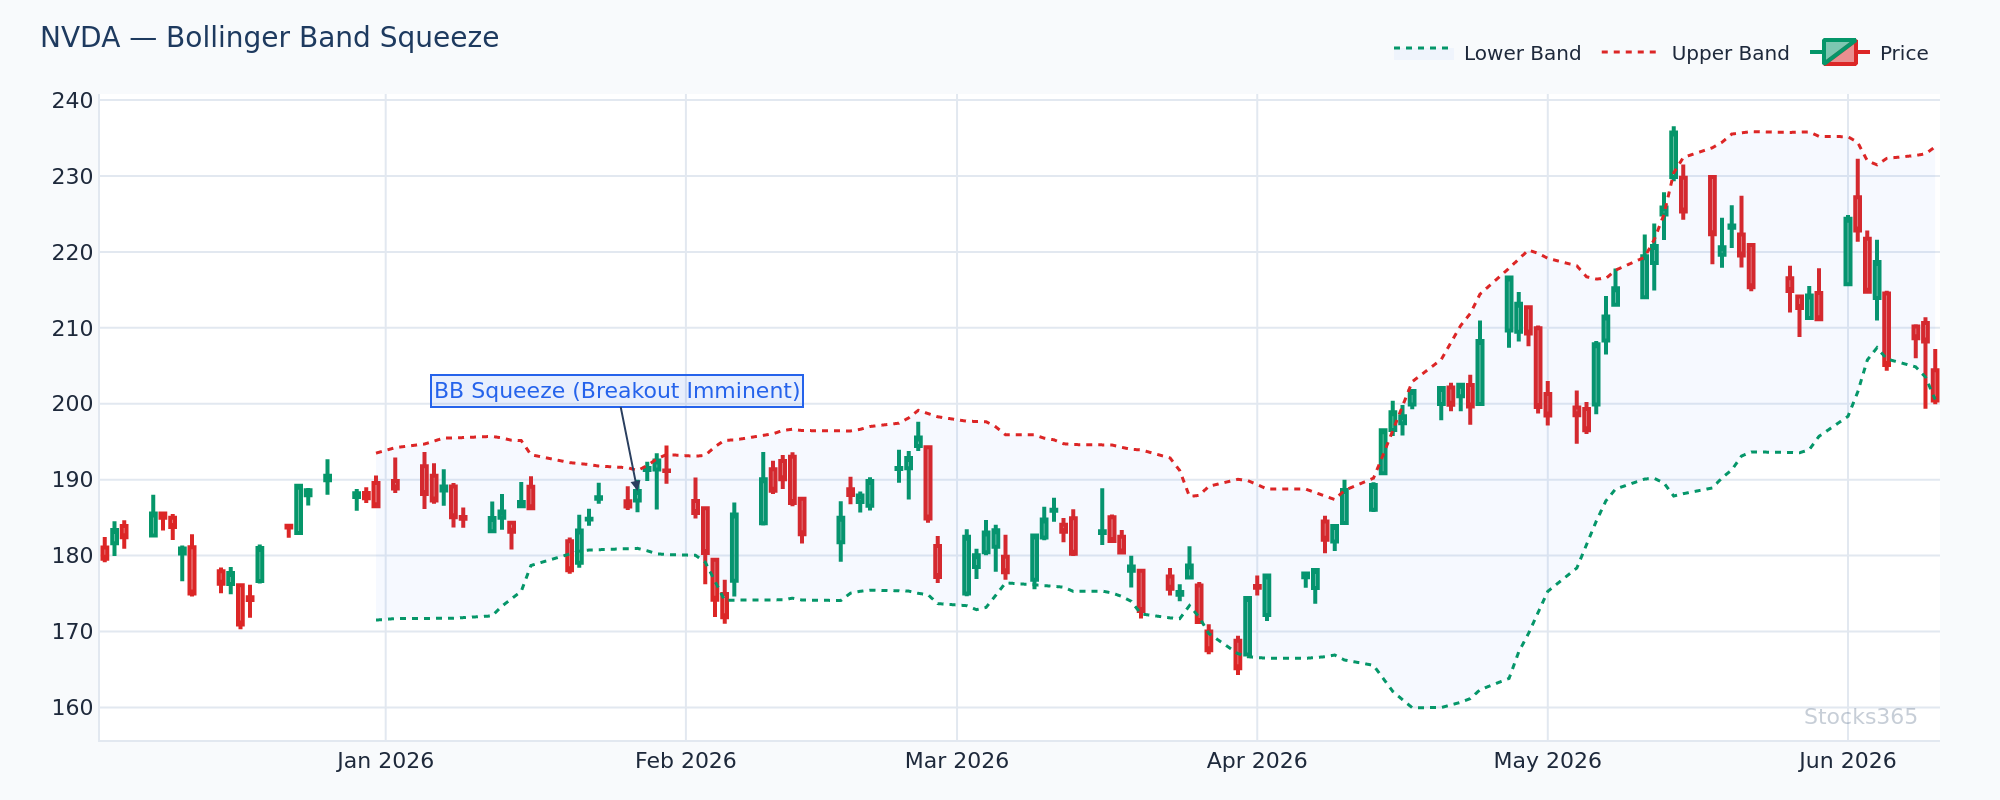
This chart illustrates how band width signals regime shifts. When bands are narrow and flat, the bounce setup is in its highest-probability environment. When bands begin expanding aggressively — as shown in the middle section — trend-following approaches outperform mean reversion. The band width indicator (lower panel) is your regime filter. Use it.
Confirming the Bounce: The Indicators That Matter
The Bollinger Band touch alone is a trigger. The confirmation comes from secondary indicators — and stacking them correctly is what separates high-probability setups from noise.
RSI as a Bounce Confirmation Tool
RSI works exceptionally well alongside Bollinger Bands for mean reversion. When price tags the lower band and RSI drops below 30 simultaneously, you have two independent indicators agreeing that price is extended. That agreement matters.
The specific entry trigger isn't the initial oversold reading — it's when RSI crosses back above 30 after dipping below it. That crossback signals momentum is shifting. For a tactical breakdown of RSI line-drawing techniques that sharpen these entries, the RSI Trendline Strategy guide covers that in depth.
Stochastic Oscillator for Timing
The Stochastic oscillator adds timing precision to band bounce entries. A stochastic %K line crossing above %D while below 20 — occurring as price touches the lower band — is a powerful entry confirmation. The stochastic recovers faster than RSI in short-term oversold conditions, making it useful for timing the actual entry candle.
Understanding the nuances between stochastic configurations is worth the time. The Fast vs Slow Stochastic Oscillator breakdown explains which version is more reliable for different timeframes and setups.
Volume Confirmation
Volume is the lie detector. A lower band touch accompanied by volume surging 1.5x–2x the recent average suggests genuine capitulation — the kind of exhaustion selling that produces sharp bounces. A band touch on thin volume is a trap. Price drifts sideways or continues lower.
For a framework on reading volume alongside momentum indicators, the RSI and Volume Analysis guide gives a complete methodology.
This chart shows a textbook setup: price touches the lower band as RSI drops under 30, then RSI crosses back above 30 on expanding volume. The confluence of all three signals — band touch, RSI crossback, volume expansion — provides meaningful confirmation. When all three align, the probability of follow-through toward the 20-SMA increases considerably. Invalidation occurs if RSI crosses back below 30 after the entry signal triggers.
Bollinger Band Bounce Strategy: Step-by-Step Entry Rules
Rules eliminate hesitation. Here's a clean entry framework for the lower band bounce:
Long Entry Checklist
- Market regime check: 20-SMA is flat or gently sloping. No clear downtrend in play on the higher timeframe.
- Band touch: Price closes at or below the lower Bollinger Band.
- Oscillator confirmation: RSI below 30, or Stochastic below 20 with a crossover signal.
- Volume check: Reversal candle volume is at or above the 20-period average. Higher is better.
- Entry trigger: Close back above the lower band after the touch.
- Initial target: The 20-SMA middle band.
- Extended target: The upper band, if price reclaims the 20-SMA with volume.
- Stop placement: Below the low of the band-touch candle, or below the lower band itself.
Keep it clean. More filters don't always mean better performance — they can simply reduce opportunity frequency without adding meaningful win rate improvement.
Asset Class Performance: Where the Bounce Works Best
Not all markets behave the same, and the data reflects this clearly.
Stocks365 backtested 3,255 Bollinger Upper Band touch signals and found a sharp performance divergence by asset class: crypto delivered a 56.7% win rate on band bounce setups, while commodities came in at just 41.5%. The gap isn't random — commodities frequently enter sustained directional trends driven by supply/demand fundamentals that override technical mean reversion signals. Crypto, despite its volatility reputation, oscillates aggressively between extremes and snaps back frequently — making it a strong environment for band bounce traders.
Equities sit in the middle of the performance range, performing best on individual large-cap stocks with regular earnings cycles and mean-reverting behavior around fundamental anchors. The Indicator Deep-Dive on signal performance gaps explores this asset class divergence across multiple indicator types — the findings consistently point to regime and asset class as the dominant performance drivers.
Bollinger Band Bounce vs. Breakout: Don't Confuse Them
The bounce and the breakout are opposite strategies triggered by similar-looking setups. Mixing them up is expensive.
A bounce setup assumes price will return to the mean after touching a band. A breakout setup assumes price will continue beyond the band after a squeeze releases. The key differentiator is band width at the point of the touch: tight, contracting bands preceding the touch favor breakouts; normal or wide bands favor bounces.
The Golden Cross vs Death Cross guide covers trend identification signals that help determine whether a market is in breakout or mean-reversion mode before any band touch occurs.
Context is everything. Read the bands. Read the trend. Then decide which strategy applies.
Managing the Trade: Targets and Stops
The middle band is the primary target. Full stop. Don't get greedy on the first trade in a new setup until the pattern proves itself.
If price reaches the 20-SMA and stalls, book the trade. If it accelerates through the middle band on strong volume, trail the stop and target the upper band. Mean reversion trades can extend into momentum trades — but only if price confirms the transition.
Stop placement below the band-touch candle's low keeps the risk defined and prevents the account-draining experience of holding through continued deterioration. Tight stops. Quick decisions. Defined risk.
Volume context adds another dimension to target management. The Volume-Weighted Moving Average (VWMA) guide provides a framework for using volume-adjusted moving averages as dynamic target and stop levels on mean reversion trades.
What to Watch For
- Lower band touches on large-cap equities following a 5–8% pullback from a recent high, combined with RSI dipping below 30 and bouncing — especially when the 20-SMA remains flat. This setup produces some of the cleanest bounces in ranging markets and has historically offered favorable risk-reward toward the middle band.
- Crypto assets tagging the lower band after a 15–25% drawdown from a local high, with Stochastic %K crossing above %D below the 20 level. Given the 56.7% historical win rate on band touch setups in crypto, this is a priority environment for bounce traders.
- Bollinger Band squeezes (band width dropping below the 20th percentile of recent readings) followed by a band touch. A squeeze-then-touch sequence often signals a brief, sharp reversion before the next directional expansion — a tight, high-conviction setup.
- Upper band touches on individual stocks immediately following an earnings gap-up that extends price more than 2 standard deviations above the 20-SMA. Earnings gap exhaustion into the upper band frequently reverts to the middle band within 3–5 sessions.
- Band bounce setups that align with the broader market being in a range — confirmed by the S&P 500 itself oscillating between defined levels without a trending 20-SMA. Individual stock bounces have much higher follow-through when the macro environment is also in consolidation mode.
How Stocks365 Uses This
Bollinger Band signals are one of 12+ technical indicators integrated into the Stocks365 trust score system.
When price touches the lower Bollinger Band on a given stock or asset, the Stocks365 algorithm evaluates that signal against the broader indicator stack — RSI positioning, volume relative to average, stochastic crossover status, and moving average slope. Each indicator contributes to the overall agreement score: how many signals are pointing in the same direction simultaneously.
A lower band touch that occurs alongside RSI below 30, a stochastic crossover signal, and above-average volume produces a high-agreement trust score — flagged as a priority bounce candidate on the signals dashboard. A band touch in isolation, without confirmation, receives a low agreement score and is deprioritized accordingly.
This filtering approach is why the Stocks365 trust score avoids the noise that plagues raw indicator signals. Not every band touch is worth acting on. The trust score tells you which ones are. Check live examples on stocks like AAPL's signal page to see how Bollinger Band data integrates with the full indicator stack in real time.
| # | Strategy | Type | Win Rate | Sharpe | PF | N | Status |
|---|---|---|---|---|---|---|---|
| #1 | VWAP Mean Reversion Long | mean_reversion | 53.6% | 0.72 | 1.57 | 7,147 | EDGE |
| #2 | RSI Oversold Bounce | mean_reversion | 56.9% | 0.68 | 1.61 | 2,153 | EDGE |
| #3 | Bollinger Lower Band Touch | mean_reversion | 58.1% | 0.65 | 1.55 | 2,798 | EDGE |
| #4 | Williams %R Oversold | mean_reversion | 54.0% | 0.32 | 1.24 | 11,744 | TEST |
| #5 | Stochastic Oversold | mean_reversion | 54.7% | 0.32 | 1.24 | 8,204 | TEST |
Key Takeaways
- The Bollinger Band bounce is a mean reversion strategy — it works in ranging markets and struggles in trending ones.
- Stocks365 backtested 3,255 band touch signals with a 49.6% overall win rate; crypto performs best at 56.7%, commodities worst at 41.5%.
- Confirm bounces with RSI, stochastic crossovers, and volume expansion — never act on a band touch alone.
- The 20-SMA middle band is the primary target. Extend to the upper band only if momentum confirms.
- Regime identification — flat vs. trending 20-SMA — is the single most important filter before entering any bounce trade.
- Stop placement below the band-touch candle's low keeps risk defined and prevents compounding losses on failed setups.