
Fast vs Slow Stochastic Oscillator: What Every Trader Needs to Know
Two versions. One concept. Wildly different results depending on which one you use.
The stochastic oscillator is one of the most widely used momentum indicators in technical analysis — but most traders treat "fast" and "slow" as interchangeable. They are not. Choosing the wrong version for your trading style can produce noisy, unreliable signals that hurt your edge rather than sharpen it. This guide breaks down exactly how fast and slow stochastic oscillators differ, when each one performs best, and how to integrate both into a disciplined, rules-based trading approach.
Before diving into the differences, it helps to understand the mechanics. If you want a full walkthrough of the underlying formula, start with our guide on how the stochastic oscillator works. For a visual, step-by-step reading guide, check out how to read the stochastic oscillator.
The Core Concept: What the Stochastic Oscillator Measures
The stochastic oscillator measures where price closes relative to its high-low range over a lookback period. The result is two lines — %K and %D — that oscillate between 0 and 100. Readings above 80 indicate overbought conditions. Readings below 20 indicate oversold conditions.
Simple enough. But here's where traders split into two camps: fast stochastic users and slow stochastic users. The difference comes down to smoothing — and smoothing changes everything about how the indicator behaves in real market conditions.
Fast Stochastic Oscillator: Raw, Reactive, Unfiltered
The fast stochastic oscillator uses the raw %K line and a 3-period simple moving average of %K as the %D signal line. No additional smoothing is applied to %K itself.
Fast Stochastic Formula
- Fast %K = (Current Close − Lowest Low over N periods) / (Highest High over N periods − Lowest Low over N periods) × 100
- Fast %D = 3-period SMA of Fast %K
The standard default is a 14-period lookback. This produces a %K line that responds immediately to every price swing. Sensitive. Fast. Volatile.
The upside: you get earlier signals. The downside: you also get more false signals. In choppy, sideways markets, the fast stochastic whipsaws constantly — firing overbought and oversold readings that lead nowhere.
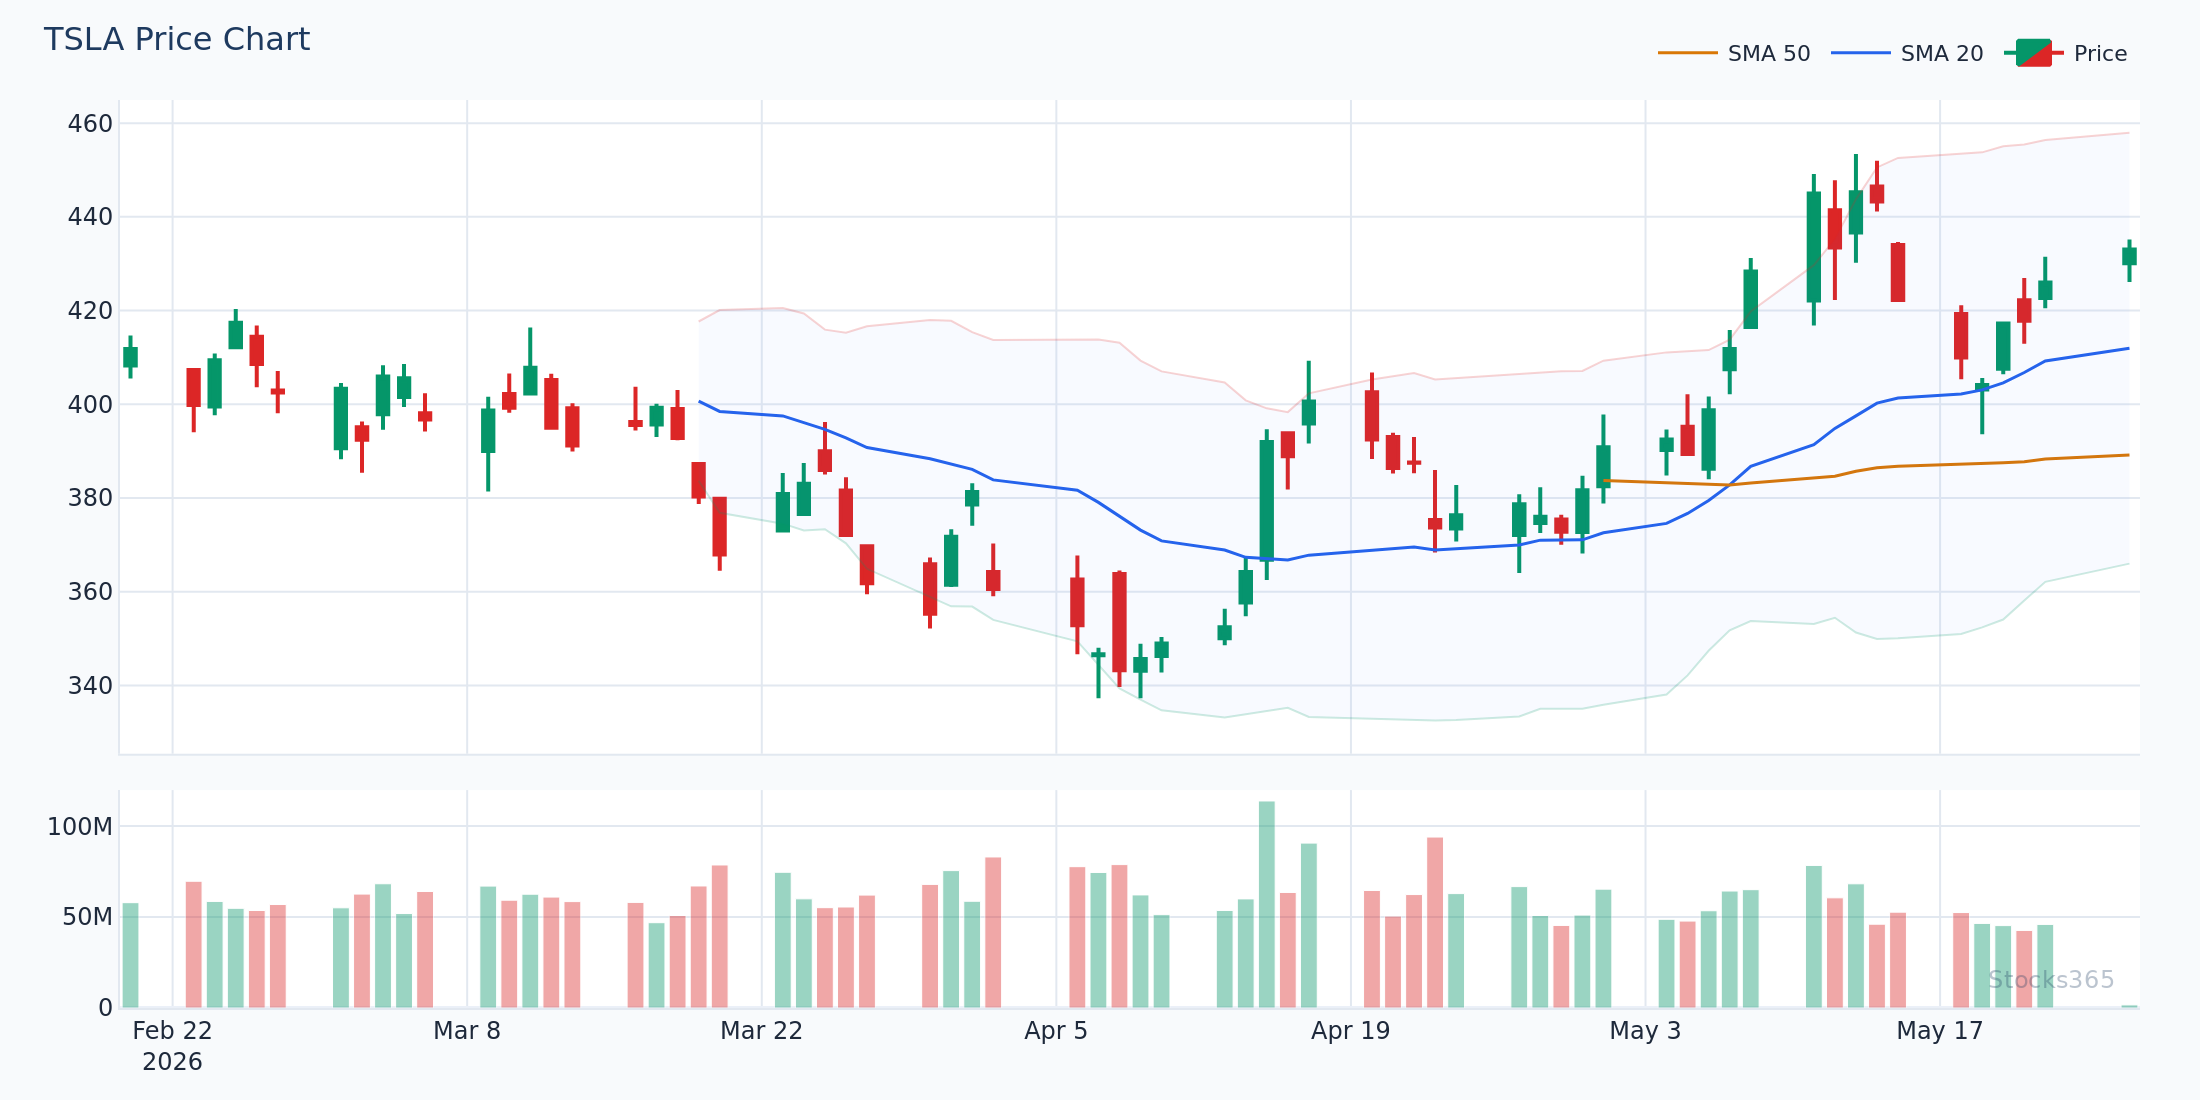
This chart shows TSLA in a tight consolidation range with the fast stochastic oscillating rapidly between overbought and oversold zones. Notice how %K crosses %D multiple times within just a few sessions — most of these crossovers produce no meaningful price follow-through. When price finally breaks out of the range in a clear direction, the fast stochastic confirms the move early, but at the cost of multiple false entries beforehand.
Slow Stochastic Oscillator: Smoothed, Stable, More Reliable
The slow stochastic oscillator applies an additional layer of smoothing. It takes the fast %D line and smooths it further — turning what was the signal line into the new %K, and then creating a new %D from that.
Slow Stochastic Formula
- Slow %K = 3-period SMA of Fast %K (this is essentially Fast %D)
- Slow %D = 3-period SMA of Slow %K
This double-smoothing process filters out the noise. The lines move more gradually, cross less frequently, and generate fewer — but generally higher quality — signals. Most professional traders default to the slow stochastic for exactly this reason.
The trade-off is lag. Slow stochastic signals arrive later than fast stochastic signals. In fast-moving momentum markets, that lag can cost you a meaningful portion of the move. But in trending and mean-reverting markets, the improved signal quality more than compensates.
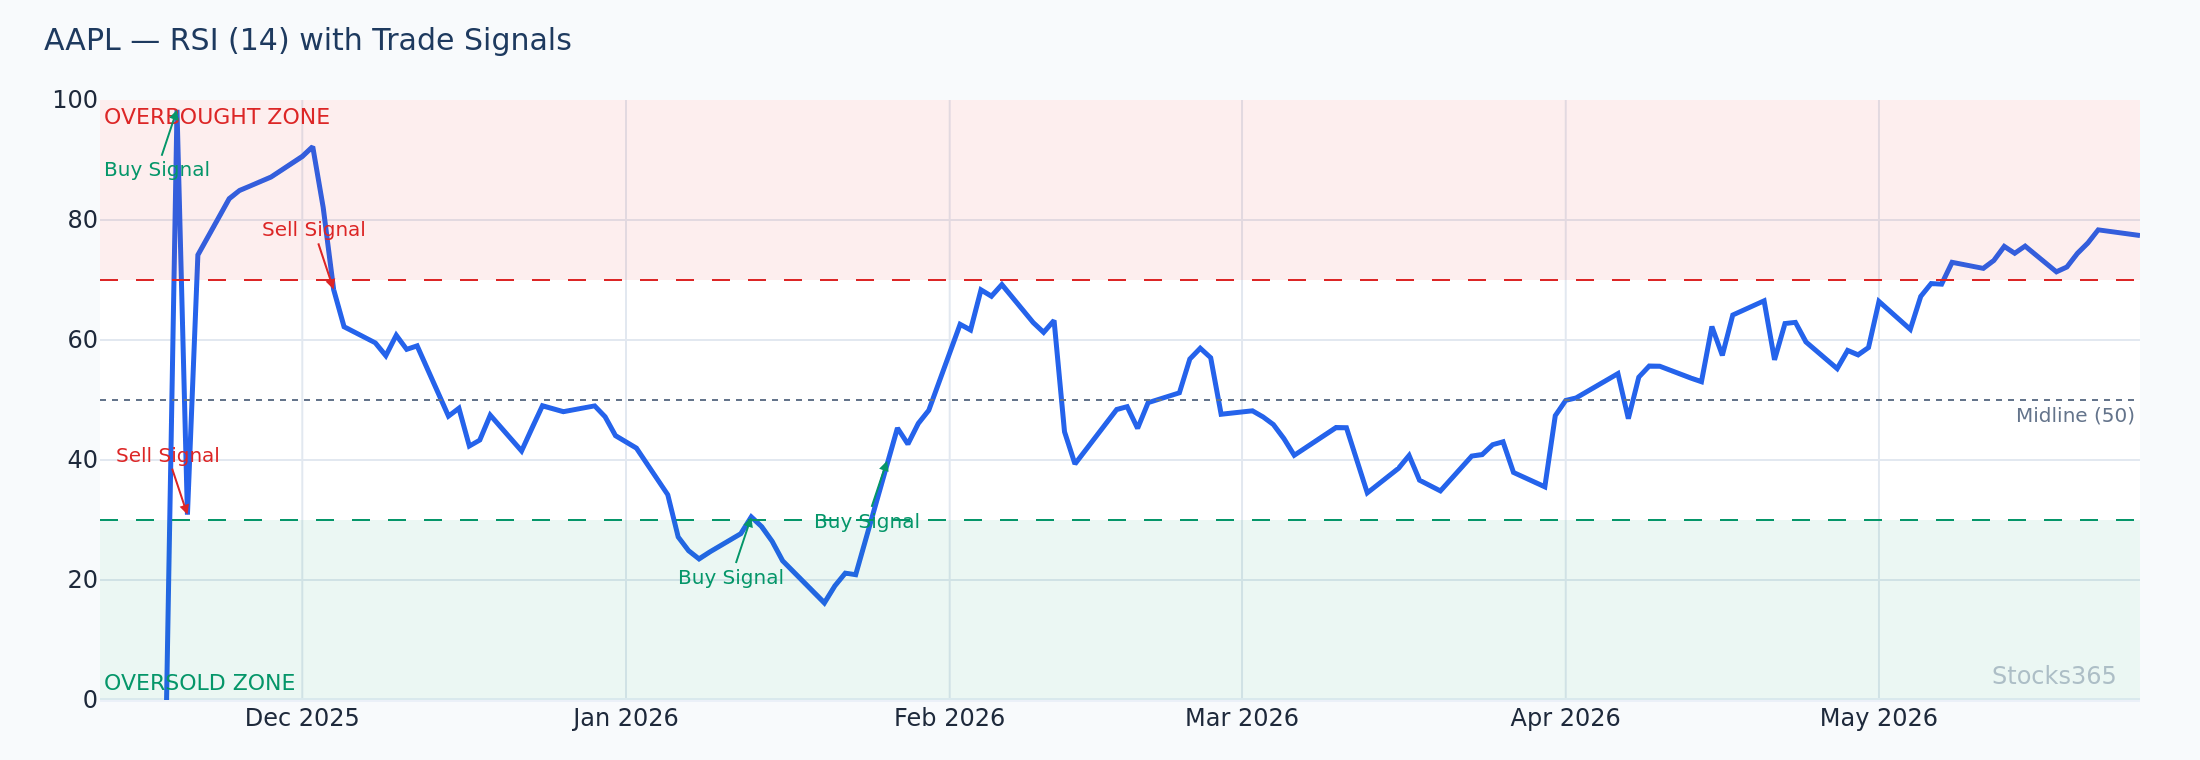
Here, AAPL's slow stochastic dips into the oversold zone below 20, and both %K and %D lines move in a measured, synchronized pattern before producing a clean bullish crossover. Compare this to the jagged fast stochastic equivalent — the slow version gives you far fewer crossovers, but the one that forms here aligns with a genuine price bottom. The signal is invalidated if %K reverses back below %D before price confirms upward movement.
Fast vs Slow Stochastic: Side-by-Side Comparison
Here is a direct comparison of the two versions across the dimensions that matter most for active traders:
- Signal Frequency: Fast = high (many signals per session). Slow = low (fewer, filtered signals).
- Sensitivity to Price: Fast = highly reactive. Slow = moderately reactive.
- False Signal Rate: Fast = higher. Slow = lower.
- Lag: Fast = minimal. Slow = moderate.
- Best Market Condition: Fast = strong trending markets with clear momentum. Slow = ranging or moderately trending markets.
- Best Timeframe: Fast = shorter intraday charts (1m–15m). Slow = daily, 4H, or swing trading timeframes.
- Trader Profile: Fast = scalpers, high-frequency day traders. Slow = swing traders, position traders.
"The slow stochastic is not a worse version of the fast stochastic. It is a different tool, designed for a different purpose. Using the fast version on a daily swing trade chart is like using a scalpel to chop wood."
What the Data Actually Shows About Stochastic Signals
Here is where theory meets reality. Stocks365 backtested 8,204 oversold stochastic signals across multiple asset classes and found a 54.7% win rate over a 10-day holding period, with a profit factor of 1.24. The best-performing asset class was forex at 57.0%, while crypto underperformed significantly at 48.9%.
That asymmetry matters. Stochastic oversold signals in forex — where mean reversion is structurally more reliable due to the bounded nature of currency pairs — consistently outperform the same signals applied to crypto, where trending behavior and volatility regimes dominate. Applying the slow stochastic oversold setup in forex on the 4H or daily chart aligns well with this edge. Visit our research dashboard to explore the full breakdown by asset class and timeframe.
The overbought side tells a different story. Across 9,257 stochastic overbought signals, the win rate drops to 48.8% — below breakeven — with a profit factor of just 0.86. Selling overbought stochastic readings as a standalone strategy simply does not work at a statistical level. Crypto is the exception, posting 58.9% on overbought signals, but every other asset class underperforms. This is critical context when choosing between fast and slow — the fast version generates more overbought signals, compounding the problem.
Here's What Most Traders Get Wrong
Most traders assume that a stochastic crossover inside the overbought or oversold zone is an automatic entry signal. Cross below 80? Sell. Cross above 20? Buy. Done.
Wrong. In trending markets, the slow stochastic can remain above 80 for extended periods — sometimes weeks — on a daily chart. The real edge is not in entering when the oscillator enters the extreme zone. The edge is in waiting for %K to cross back through the boundary — exiting the overbought zone back below 80, or exiting the oversold zone back above 20 — with price action confirming the reversal. That confirmation step is what separates disciplined stochastic traders from gamblers chasing crossovers.
When to Use the Fast Stochastic
Fast stochastic has legitimate use cases. Ignore the noise from traders who dismiss it entirely.
Best Applications for Fast Stochastic
- Scalping on 1-minute or 5-minute charts: The fast response time aligns with rapid price fluctuations in high-liquidity instruments.
- Confirming momentum breakouts: When price breaks above a consolidation range and volume surges above its 20-period average, a fast stochastic already approaching overbought confirms the breakout rather than signaling an exit.
- Intraday divergence detection: Because the fast %K is so sensitive, divergences between %K and price form earlier — giving scalpers a slight edge on anticipating intraday reversals.
Pair the fast stochastic with a moving average crossover to filter the noise. When price is above the 50-EMA and trending, fast stochastic oversold dips become pullback entries rather than reversal trades — a context-aware use of the indicator that dramatically reduces false signals.
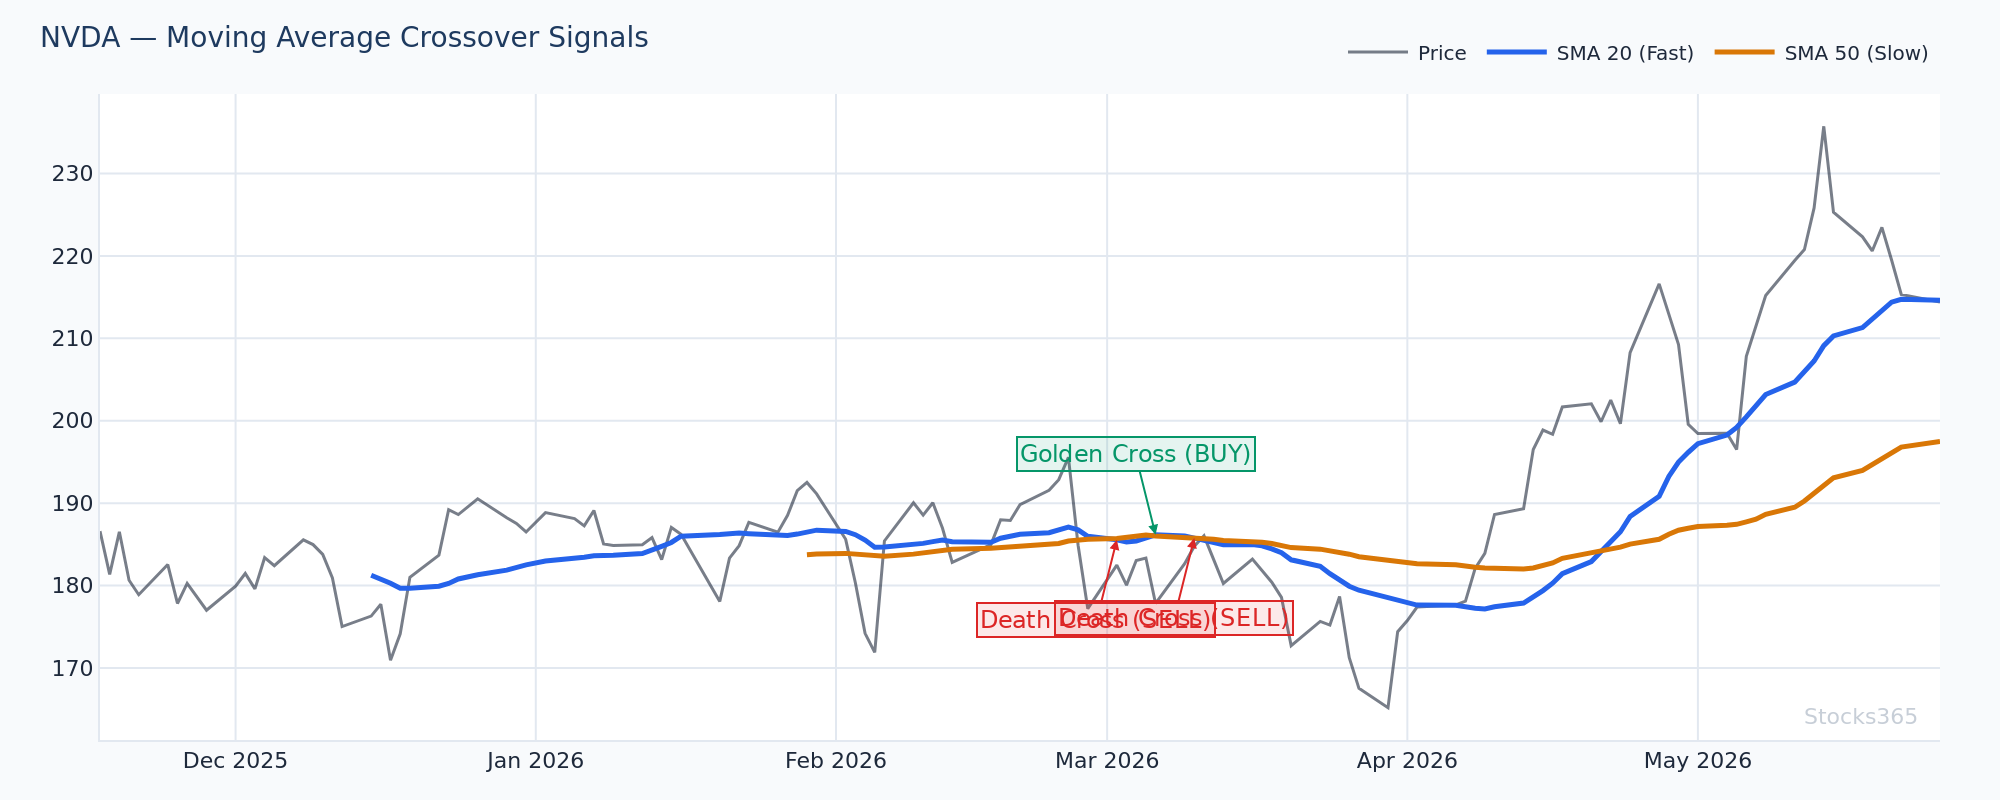
NVDA trades above a rising 50-EMA during a sustained uptrend. The fast stochastic drops below 20 — a typical overbought trap for reversal traders. Instead, price consolidates briefly and resumes upward. The fast stochastic signals the pullback entry in context of the dominant trend, with the 50-EMA acting as dynamic support confirmation. This setup fails when price closes below the 50-EMA, signaling a trend regime change rather than a simple pullback.
When to Use the Slow Stochastic
For most traders — especially swing traders and those holding positions overnight — the slow stochastic is the right starting point.
Best Applications for Slow Stochastic
- Daily and 4H swing trading: The smoothed lines reduce false reversals that plague the fast version on longer timeframes.
- Mean reversion setups in forex: As the backtested data confirms, oversold slow stochastic readings in forex pairs carry a demonstrable statistical edge.
- Confirmation within multi-indicator strategies: When combined with Bollinger Bands — particularly a double oversold condition where price touches the lower band and stochastic is below 20 — the edge improves significantly. Our research across 2,501 such signals found a 58.9% win rate and a profit factor of 1.61.
- Regime-filtering trend confirmation: Pair with a triple moving average strategy to distinguish trending regimes (where stochastic extremes are continuation signals) from ranging regimes (where they are reversal signals).
The slow stochastic also integrates naturally with Moving Average and Bollinger Bands strategies, where the additional smoothing aligns the oscillator signal timing with band compressions and expansions.
Combining Fast and Slow: The Dual Stochastic Approach
Some experienced traders run both simultaneously on the same chart. The logic: use the slow stochastic to identify the zone (overbought or oversold), then use the fast stochastic to time the precise entry trigger.
How the Dual Stochastic Setup Works
- Slow stochastic drops below 20 — oversold zone confirmed on the higher-quality indicator.
- Wait for fast %K to begin turning upward and cross above fast %D.
- Enter long on the candle close following the fast stochastic crossover.
- Use the slow %D crossing back above 20 as the confirmation that the reversal has structural support.
- Exit when slow %K reaches the 80 zone or when a bearish crossover appears in the slow stochastic.
This dual approach captures the sensitivity of the fast version while using the slow version as a quality filter. It reduces entries, which means smaller sample sizes — but those entries tend to be higher probability. Compare this methodology to similar dual-indicator logic in MACD-based forex strategies for additional context on combining momentum indicators.
Stochastic vs RSI: How They Fit Together
The stochastic oscillator and RSI are often treated as redundant. They are not. RSI measures momentum relative to recent price change magnitude. Stochastic measures momentum relative to the price range. Using both adds genuine diversification to your signal set.
An RSI trendline strategy identifies structural momentum shifts, while the slow stochastic identifies overbought/oversold extremes. Together, they create a two-layer confirmation framework — RSI breaks its trendline first, slow stochastic confirms the reversal with a %K/%D crossover. Neither signal alone is enough. Both together raise your conviction.
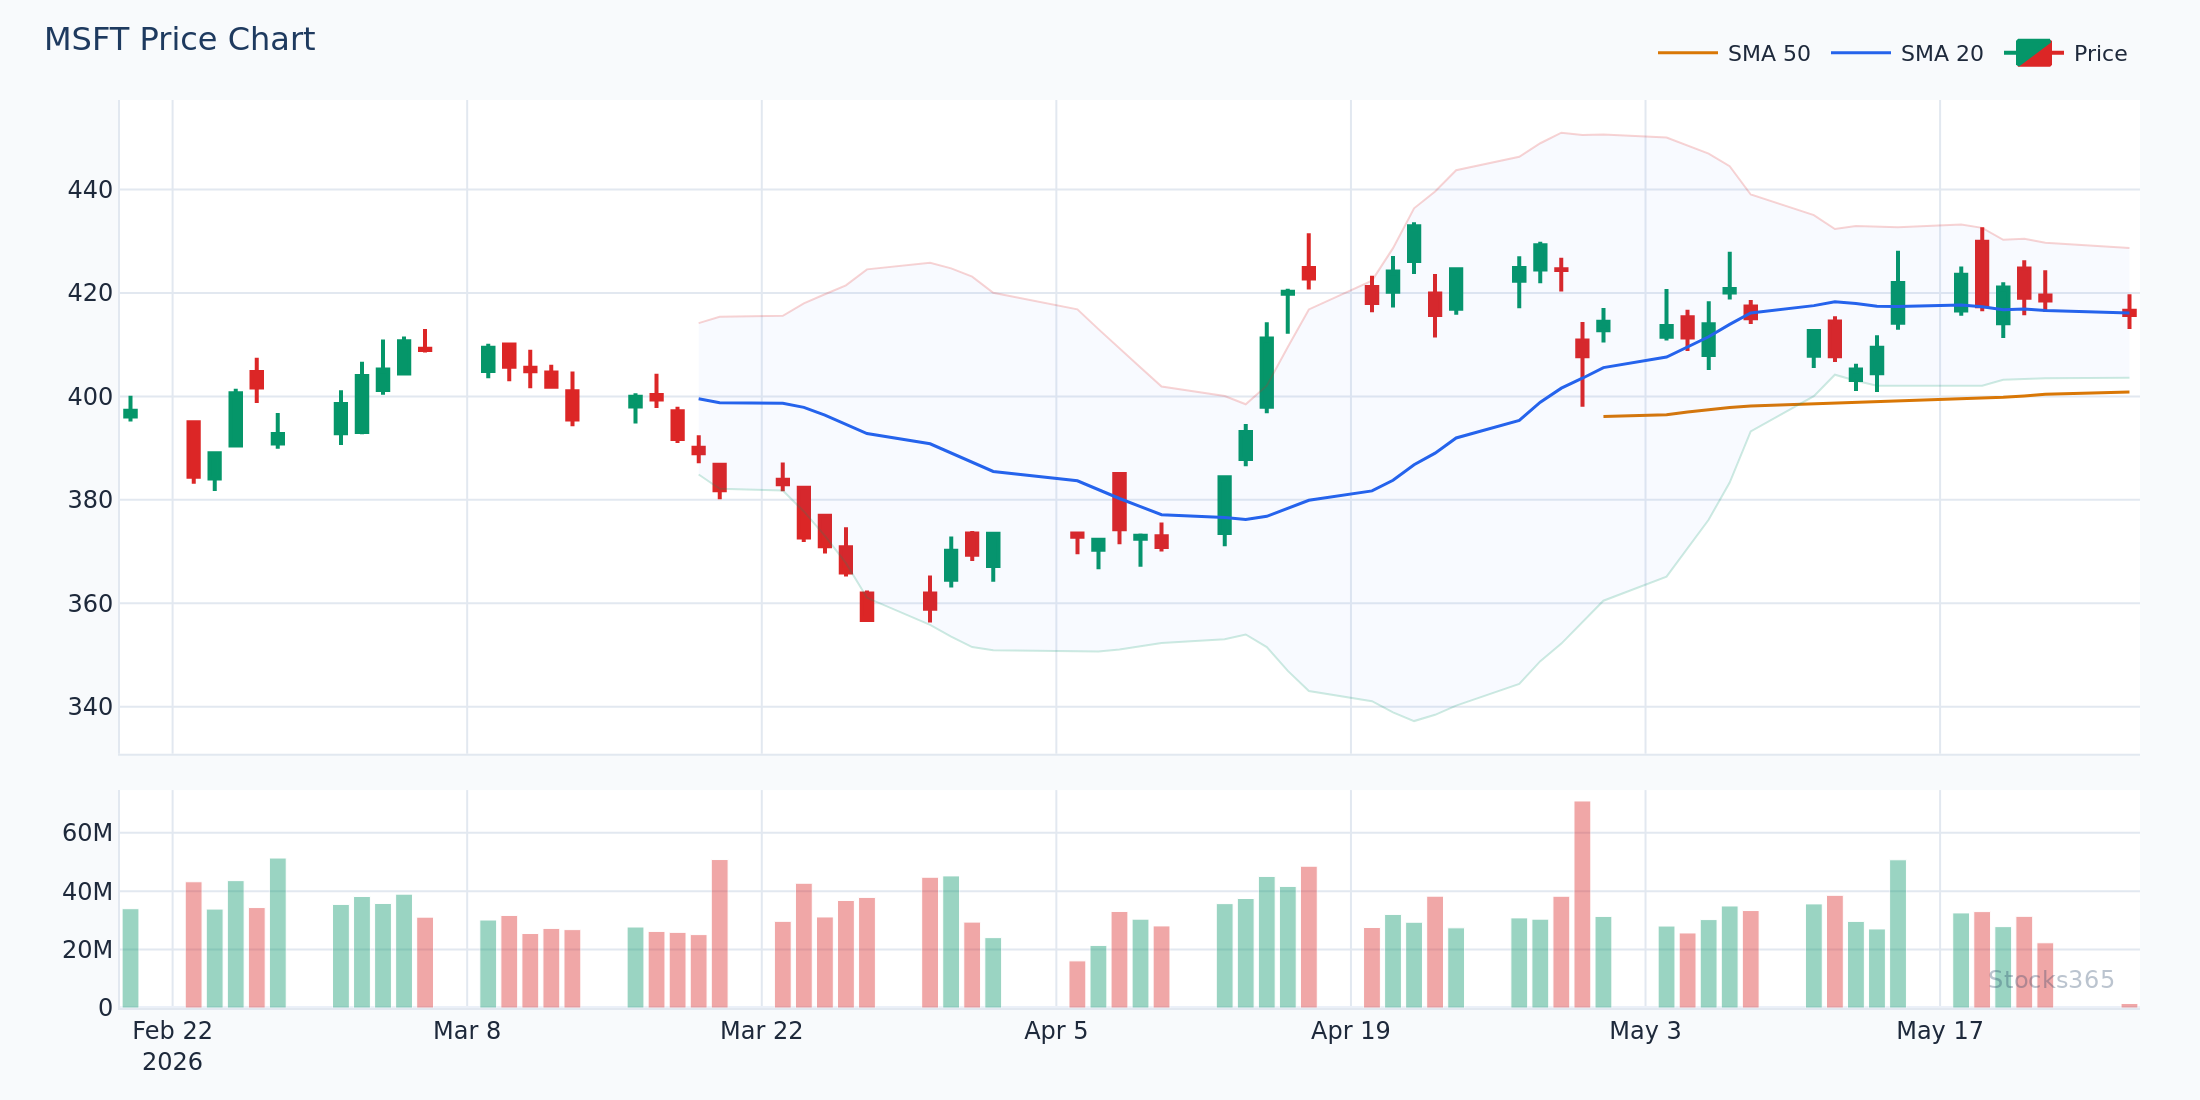
MSFT pulls back to a rising support zone as RSI approaches the 40 level — typical in bull market corrections. The slow stochastic simultaneously dips toward 20, with %K beginning to curve upward before crossing %D. When both momentum indicators align with price holding above support, the setup becomes a high-conviction long entry. The pattern is invalidated if price closes below the support zone before both oscillators confirm.
What to Watch For
- Slow stochastic %K crossing back above 20 in forex pairs: When this occurs after both lines have been below 20 for at least 3 sessions, the mean reversion setup aligns with statistically favorable territory — particularly on 4H and daily charts where the smoothing reduces noise most effectively.
- Fast stochastic divergence on intraday breakdowns: When price makes a new intraday low but fast %K forms a higher low, the divergence often precedes a sharp intraday reversal, especially in large-cap equities with high liquidity.
- Slow stochastic overbought persistence in strong uptrends: When slow %K holds above 80 for more than 5 consecutive sessions on the daily chart, the trend regime is strong — wait for a confirmed cross back below 80 before considering any short or exit, not just the first touch of the 80 level.
- Dual stochastic compression: When both fast and slow stochastic lines converge near the 50 midline during a Bollinger Band squeeze, the subsequent breakout often carries outsized momentum. The direction the fast stochastic breaks first gives an early directional bias.
- Slow stochastic bearish crossover while price holds near recent highs: This negative divergence pattern — price not confirming a lower oscillator reading — is a classic deterioration warning before a larger pullback in trending instruments.
Key Takeaways
Summary: Fast vs Slow Stochastic Oscillator
- The fast stochastic uses raw %K and is highly reactive — best for scalping and intraday momentum confirmation.
- The slow stochastic applies double smoothing, reducing noise — best for swing trading on 4H and daily charts.
- Stochastic oversold signals carry a 54.7% win rate (n=8,204) with the strongest edge in forex (57.0%) — the slow version is better suited to capture this structural edge.
- Overbought stochastic signals carry only a 48.8% win rate overall — avoid using either version as a standalone sell trigger except in crypto.
- The dual stochastic approach (slow for zone identification, fast for entry timing) combines the best attributes of both.
- Always confirm stochastic signals with price action, volume, or complementary indicators — never trade stochastic crossovers in isolation.
- Regime context determines whether an overbought/oversold reading is a reversal signal or a continuation setup.
How Stocks365 Uses This
Stocks365's proprietary trust score system aggregates signals from 12+ technical indicators to produce a composite confidence rating for each trade signal. The slow stochastic oscillator is one of the core momentum contributors to this system.
Specifically, stochastic %K/%D crossovers within extreme zones (overbought above 80, oversold below 20) contribute to the momentum agreement score — a sub-component that measures how many independent momentum indicators simultaneously confirm a directional bias. When the slow stochastic oversold crossover aligns with RSI recovering from below 30 and price holding above a key moving average, the trust score rises to reflect multi-indicator agreement rather than a single-indicator signal.
The system also incorporates a regime filter — distinguishing trending from ranging market conditions — so that the same stochastic signal receives different weighting depending on whether price is in a momentum regime (where overbought means strength) or a mean-reversion regime (where overbought means exhaustion).
You can see live signals generated by this system — including trust score ratings and stochastic component breakdowns — on the Stocks365 signals dashboard and on individual stock signal pages like AAPL signals.