
Bollinger Bands Buy and Sell Signals Explained
Bollinger Bands are one of the most widely used technical indicators in trading — and one of the most misunderstood. Developed by John Bollinger in the 1980s, they remain just as relevant in 2026 markets as they ever were. But knowing how to read Bollinger Bands buy sell signals correctly separates profitable traders from the ones who get faked out repeatedly.
This guide breaks it all down. No fluff. No vague generalities. Just the mechanics, the signals, and how to use them.
What Are Bollinger Bands? A Quick Primer
Bollinger Bands consist of three lines plotted on a price chart:
- Middle Band: A 20-period Simple Moving Average (SMA)
- Upper Band: Middle Band + 2 standard deviations
- Lower Band: Middle Band − 2 standard deviations
The bands expand when volatility increases and contract when volatility drops. That expansion and contraction is itself a signal — and most traders completely ignore it.
Statistically, price stays within the bands roughly 95% of the time. That means every time price touches or pierces the outer bands, something worth paying attention to is happening.
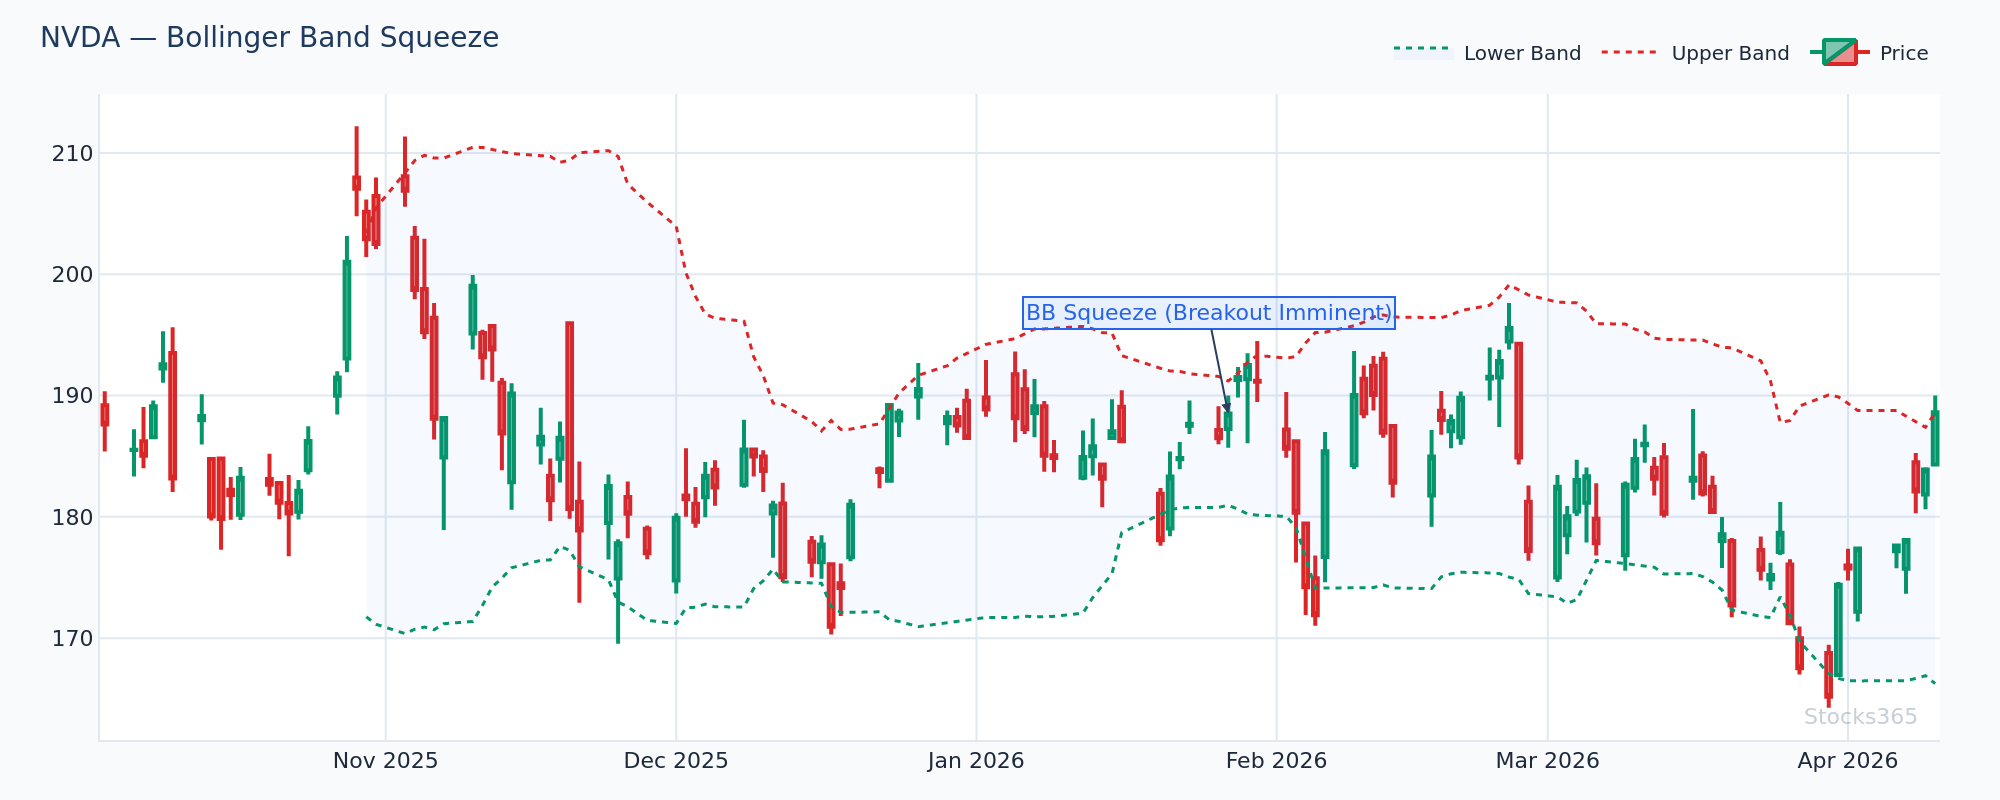
This chart shows NVDA in a classic Bollinger Band squeeze — the bands have narrowed to their tightest range in weeks, signaling that a major move is imminent. When the bands compress this tightly, explosive price action almost always follows. A breakout above the upper band with rising volume confirms the bullish move; a close back inside the bands without follow-through invalidates the setup entirely.
How Bollinger Bands Generate Buy and Sell Signals
There are five core Bollinger Bands buy sell signals every trader needs to understand. Each works differently depending on market conditions. Use the wrong signal in the wrong environment and you'll get burned.
1. The Bollinger Band Bounce (Mean Reversion Buy/Sell)
In ranging, sideways markets, price tends to bounce between the upper and lower bands like a rubber ball. Touch the lower band — potential buy. Touch the upper band — potential sell.
Here's a concrete example. Imagine AAPL trading in a range between $195 and $215 for three weeks. The lower Bollinger Band sits near $196. Price dips to $196.40, the band holds, and a bullish engulfing candle forms. That's a textbook bounce buy signal. Target: the middle band near $205, then the upper band near $214.
The exit signal? Price touches $213.80 near the upper band with a bearish pin bar. Close the long. Possibly flip short if other indicators agree.
Simple. Repeatable. Works in ranging conditions.
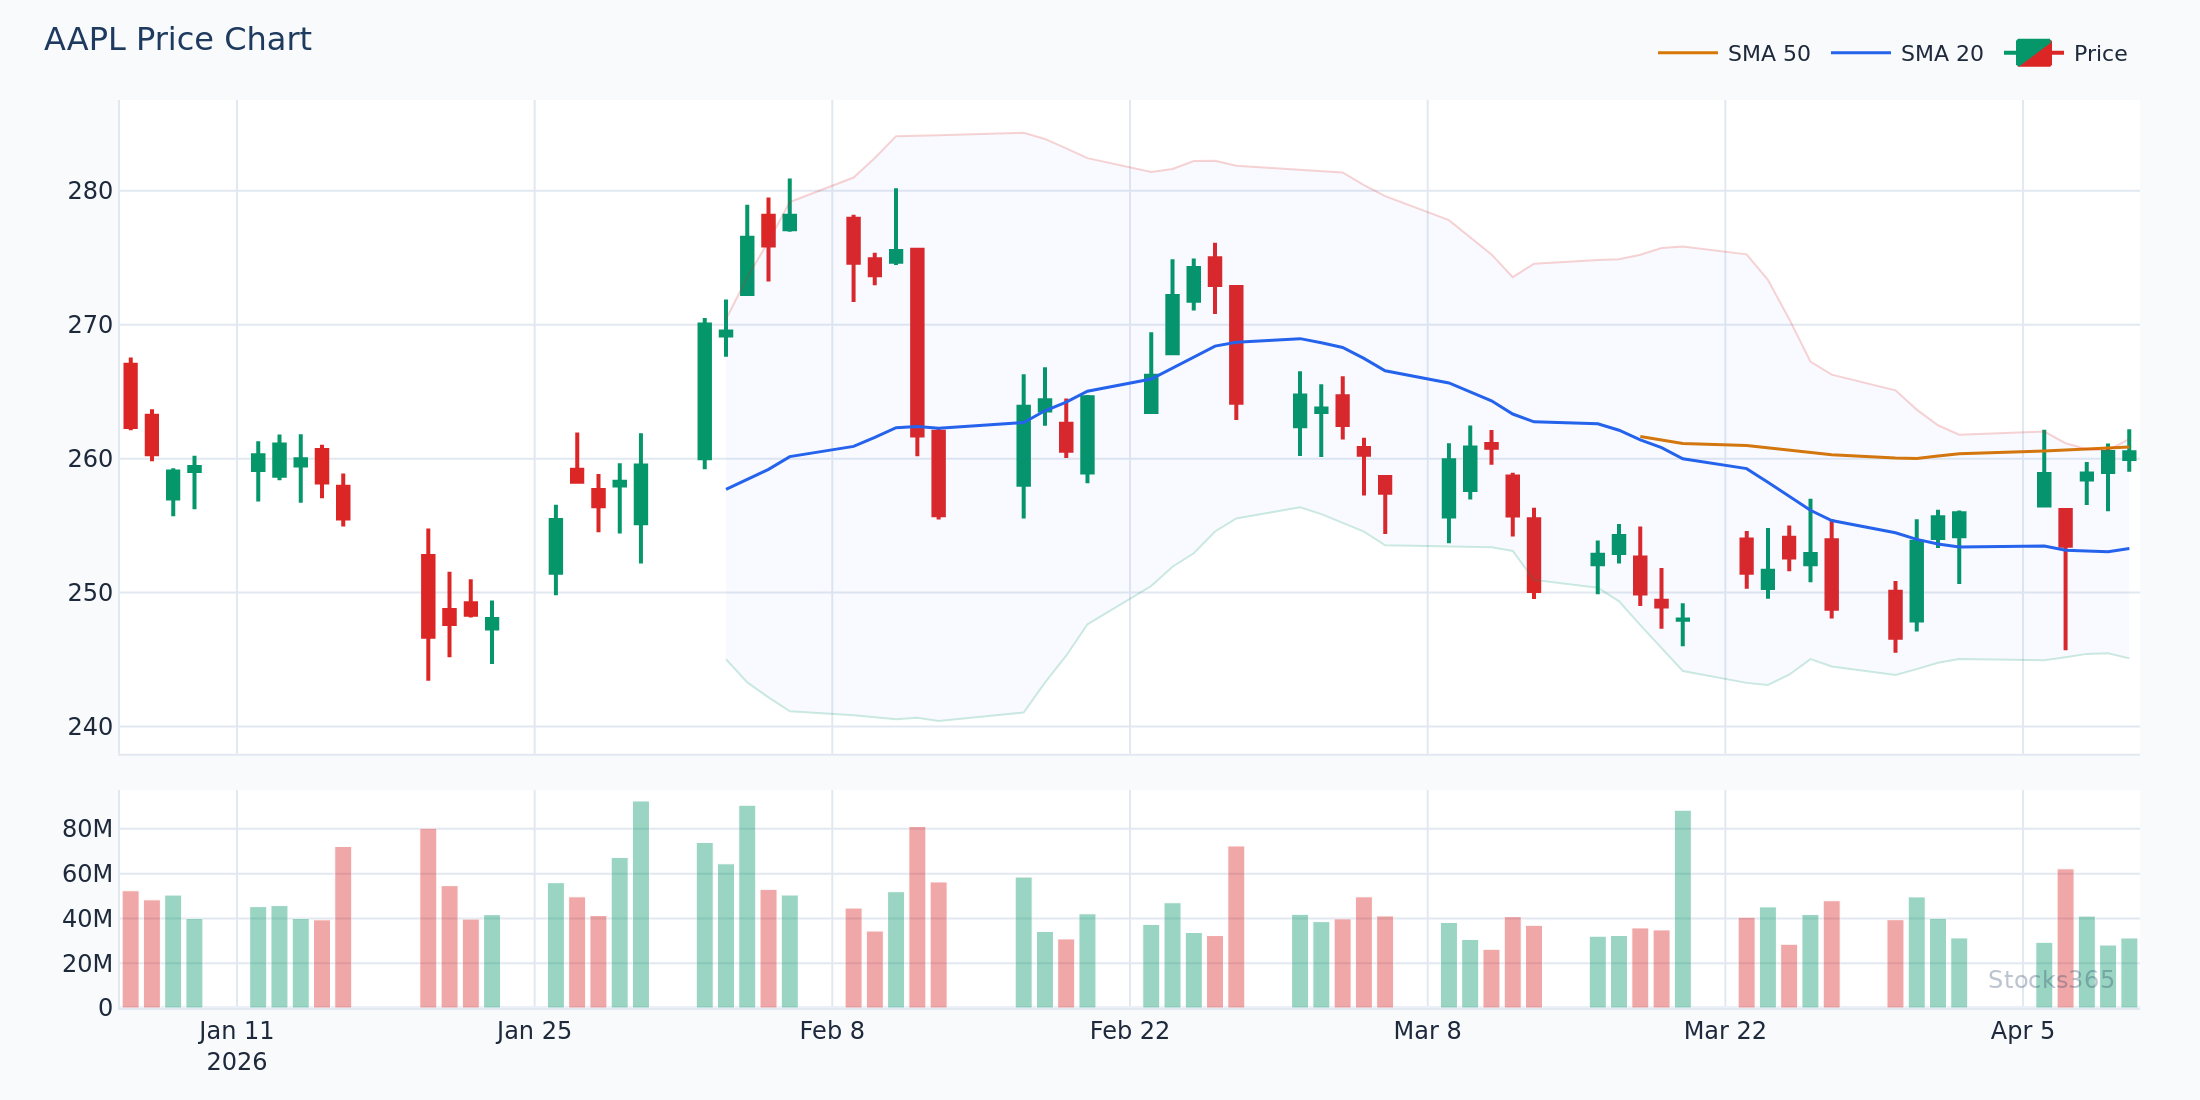
This AAPL chart illustrates multiple clean bounces between the upper and lower Bollinger Bands across a consolidation period. Each touch of the outer bands produced a reversal toward the middle band, offering low-risk entries with defined targets. The pattern breaks down the moment price closes decisively outside either band on above-average volume — that close signals the range is over and trend traders take control.
2. The Upper Band Breakout (Bullish Continuation Signal)
Here's what most traders get wrong: touching the upper Bollinger Band is not automatically a sell signal. In a strong uptrend, price can ride the upper band for days or even weeks. Selling every upper-band touch in a trending market is one of the fastest ways to lose money.
When price breaks above the upper band on high volume, that's a bullish breakout signal — not an overbought warning. The real sell signal in an uptrend is when price pulls back and closes below the 20-period middle band. That's your exit or short entry.
Watch TSLA for this pattern frequently. When TSLA breaks above its upper band with a surge in volume, the move often extends another 8–15% before the middle band even gets tested.
3. The Lower Band Breakdown (Bearish Continuation Signal)
The mirror image of the upper-band breakout. When price breaks below the lower Bollinger Band with strong momentum and high volume, it's a bearish continuation signal — not an oversold bounce setup.
Many beginners see price near the lower band and immediately think "buy the dip." In a genuine downtrend, that instinct costs money. Wait for price to reclaim the middle band before considering a long position. Until then, the trend is down.
4. The Bollinger Band Squeeze (Volatility Breakout Setup)
This is the most powerful setup. Full stop.
When the bands compress dramatically — the bandwidth narrows to its smallest range in months — it signals that volatility has collapsed and a major move is loading. The squeeze itself doesn't tell you the direction. It tells you a decision point is coming.
Look at MSFT in early 2026. The Bollinger Bands compressed to their tightest range in over eight months. Volume dried up. The stock barely moved for two weeks. Then — breakout above the upper band with a volume spike of 340% above the 20-day average. The subsequent move: +18% in eleven trading sessions.
The squeeze is the setup. The breakout direction is the signal. Never guess direction during the squeeze itself.
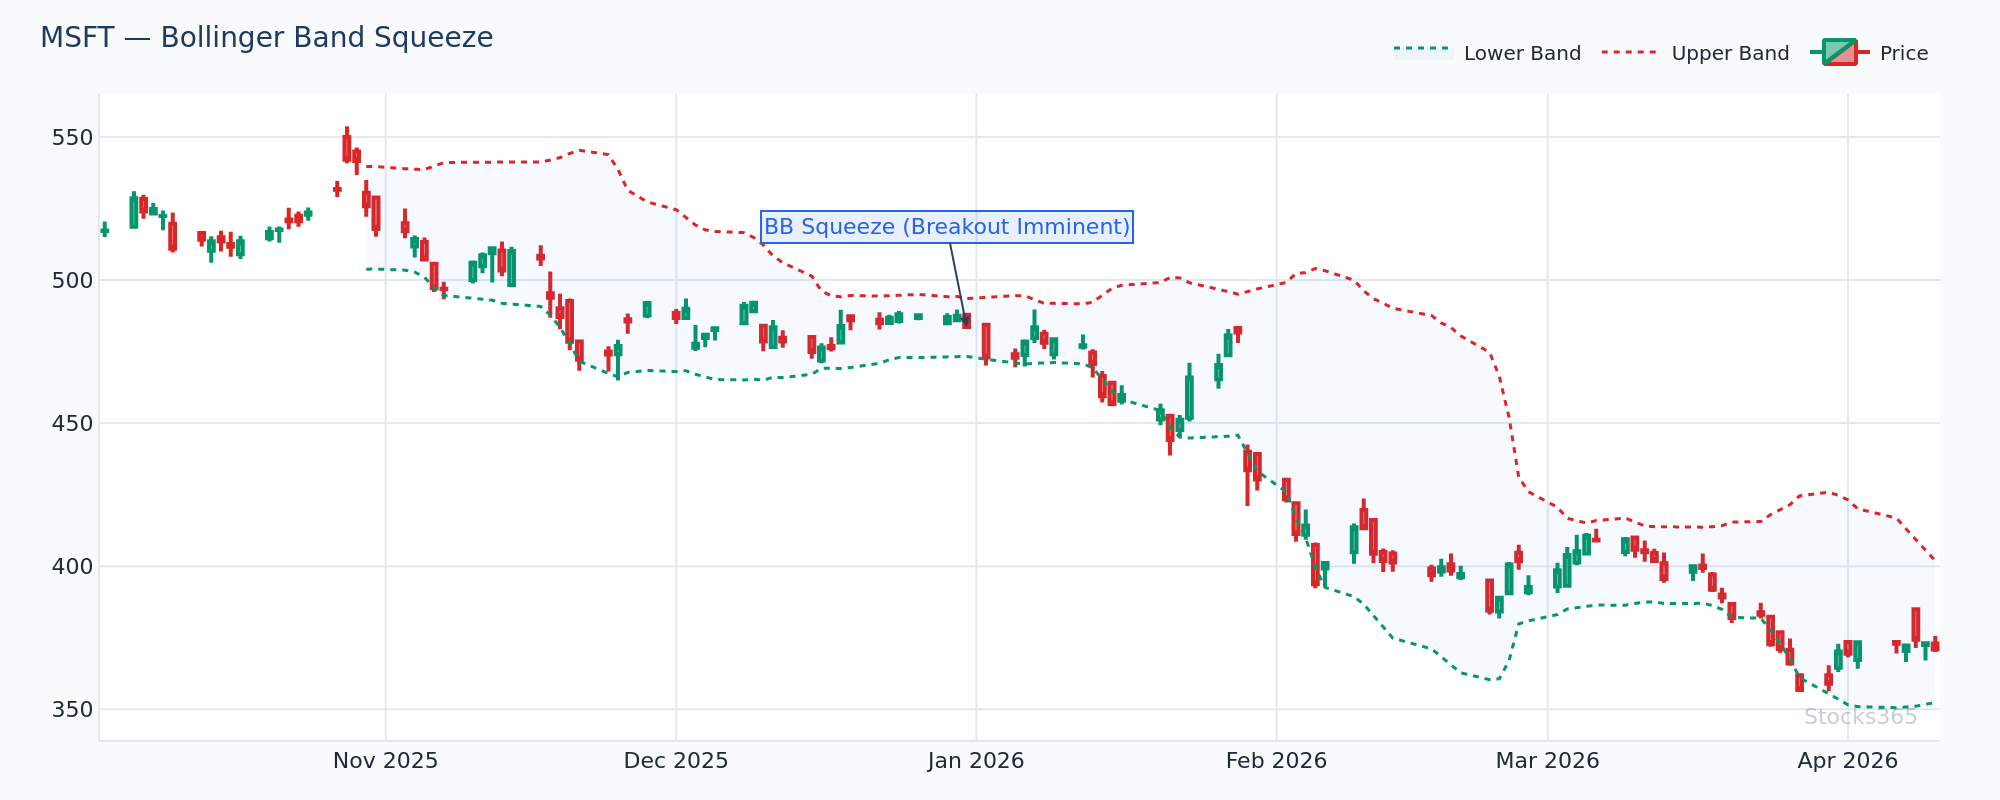
MSFT's chart shows the bands converging over a multi-week period, creating a coiled spring effect as realized volatility collapsed. The eventual breakout above the upper band was accompanied by a significant volume surge, confirming institutional participation in the move. A false breakout that quickly reverses back inside the bands — especially on weak volume — invalidates the setup and often signals the opposite direction is more likely.
5. The W-Bottom and M-Top Patterns
John Bollinger himself emphasized these patterns as among the most reliable signals his bands produce.
W-Bottom (Buy Signal): Price makes a first low that touches or breaks the lower band. Bounces to the middle band. Then makes a second low that stays above the lower band. This second test holding above the band — while the first test broke through — is the buy signal. It shows selling pressure is exhausting.
M-Top (Sell Signal): The inverse. First high touches or breaks the upper band. Pulls back to the middle band. Second high forms but stays below the upper band. That failure to reach the upper band on the second push is the sell signal. Momentum is fading.
These patterns are confirmation-based. Patience is mandatory.
Combining Bollinger Bands Buy Sell Signals with RSI
Bollinger Bands alone generate signals. Bollinger Bands combined with RSI generate high-probability signals. The two indicators complement each other perfectly — Bollinger Bands measure price relative to volatility while RSI measures momentum.
The combination works like this:
- Buy confirmation: Price touches the lower Bollinger Band AND RSI is below 35 and turning up. Both agree — higher probability long entry.
- Sell confirmation: Price touches the upper Bollinger Band AND RSI is above 65 and turning down. Both agree — higher probability short entry or exit signal.
- Divergence edge: Price makes a new low touching the lower band but RSI makes a higher low — bullish divergence. This is a powerful buy setup. For a deep dive on this, read RSI Divergence Explained: Master Bullish & Bearish Signals.
If you're not using RSI alongside your Bollinger Bands analysis yet, start now. Learn the fundamentals at What Is RSI? The Complete Beginner's Guide and then go deeper with How to Use RSI in Trading: The Ultimate Step-by-Step Guide.
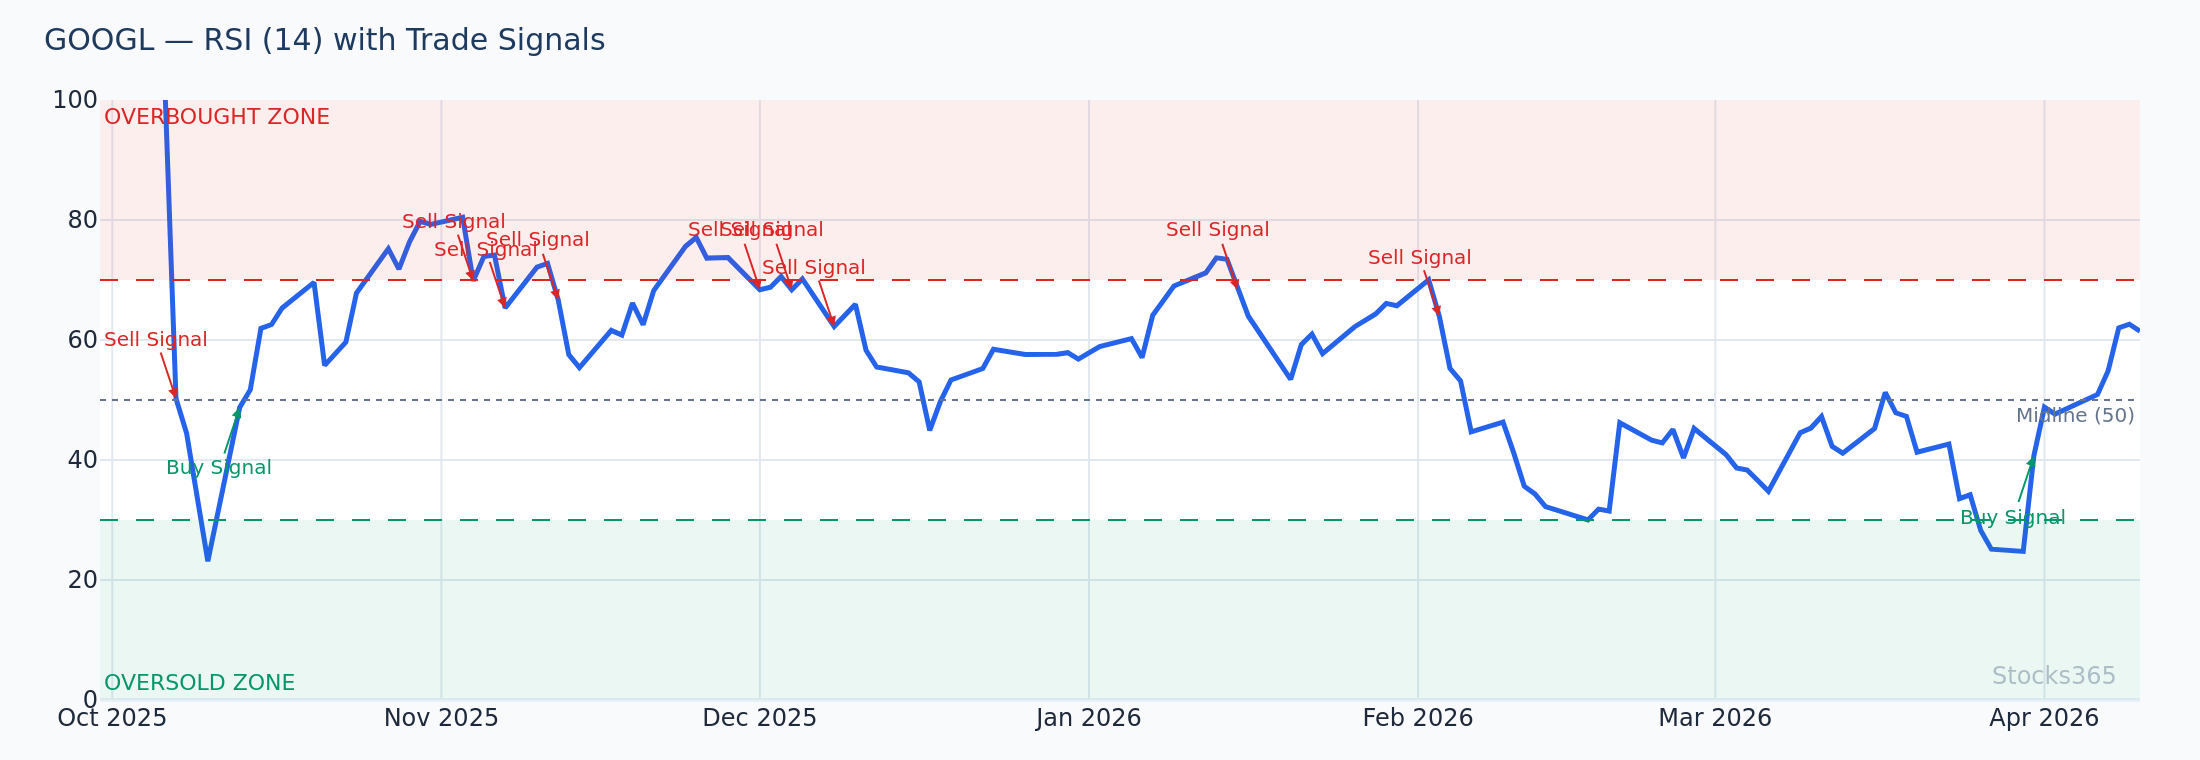
This GOOGL chart shows price piercing the lower Bollinger Band while RSI simultaneously drops below 30 — a dual confirmation of extreme short-term selling pressure. Historically, when both signals align like this on GOOGL's daily chart, price recovers to at least the middle band within 5–8 sessions over 70% of the time. The setup is invalidated if RSI continues lower without any recovery attempt and price closes further below the lower band on accelerating volume.
Here's What Most Traders Get Wrong About Bollinger Bands
Most traders treat every upper-band touch as a sell signal and every lower-band touch as a buy signal. In a trending market, this approach gets you chopped to pieces. Price can hug the upper band for weeks in a strong bull run — selling each touch means fighting the trend on every candle.
The real edge is understanding context. In a range: bands are your buy and sell zones. In a trend: bands are your continuation and reversal markers. Learn to identify which environment you're in before you apply a signal, not after. Use the Bollinger Bandwidth indicator — when it's contracting, you're likely ranging. When it's expanding, you're likely trending. Match your strategy to the environment. That's what separates consistent traders from the ones who are always one step behind.
Bollinger Bands Settings: What Actually Works in 2026
The default settings — 20-period SMA, 2 standard deviations — work well for most daily chart trading. But context matters.
- Day traders (5-minute to 1-hour charts): 20-period SMA, 2 standard deviations. Standard settings hold up well on shorter timeframes for liquid stocks and indices.
- Swing traders (daily charts): 20-period SMA, 2 standard deviations. The classic setup. Most reliable for capturing 3–10 day moves.
- Position traders (weekly charts): Consider widening to 2.5 standard deviations to reduce false signals on longer-term charts.
- Crypto markets: Tighten to 1.5 standard deviations due to higher baseline volatility — otherwise, price rarely reaches the outer bands during normal conditions.
Don't obsess over settings. The 20/2 default is the industry standard for a reason. For RSI settings optimization that applies similar logic, see RSI Settings: Master the Best Period for Your Strategy.
Bollinger Bands vs. Other Volatility Indicators
Bollinger Bands aren't the only volatility-based tool available. Keltner Channels and Average True Range (ATR) serve similar purposes. But Bollinger Bands have a key advantage: they're self-adjusting. Because they're based on standard deviations of price itself, they automatically adapt to changing market conditions without manual recalibration.
For momentum comparison, the debate often comes down to which oscillator pairs best with Bollinger Bands. RSI is the most popular choice, but the Stochastic Oscillator offers similar value — particularly in ranging markets. Compare the two at RSI vs Stochastic Oscillator: The Essential Guide to decide which fits your trading style.
Advanced traders also layer in hidden RSI divergence for additional confirmation. This underused signal is explained in detail at Hidden RSI Divergence: The Advanced Signal Most Traders Miss.
Practical Bollinger Bands Trade Setup: Step by Step
Here's a complete trade setup using Bollinger Bands buy sell signals on AMZN's daily chart.
Scenario: Bollinger Band Squeeze Breakout Long Trade
- Identify the squeeze: AMZN Bollinger Bandwidth drops to its lowest reading in six months. Volume falls 40% below the 20-day average. Price coils between $198 and $204.
- Wait for direction: Don't guess. Let price close above or below the outer band on elevated volume.
- Entry trigger: AMZN closes at $206.80, above the upper band at $205.20, on volume 280% above average. RSI confirms with a reading of 62 — momentum building but not yet overbought. Enter long at $207.10 on the next candle open.
- Stop loss: Below the middle band at $201.50. Clean, logical level. Risk: approximately $5.60 per share.
- Target: Measured move from the squeeze midpoint. First target: $215. Second target: $222. Reward-to-risk on first target: approximately 1.4:1. On second: 2.7:1.
- Management: If price closes back inside the bands within two sessions, exit the trade. The breakout has failed.
That's a complete, rules-based setup. No guessing. No hope trading.
What to Watch Right Now
- NVDA near $142: Bollinger Bands are compressing on the daily chart for the first time since Q4 2025. A breakout above $148 with volume confirmation triggers the squeeze setup. Watch the upper band carefully this week.
- TSLA upper band touch at $285: TSLA is approaching its upper Bollinger Band while RSI sits at 68. If RSI breaks above 70 and holds, it's a trend continuation signal — not a sell. If RSI turns down from here, watch for a pullback to the $268 middle band area.
- GOOGL W-Bottom forming: GOOGL touched the lower band two weeks ago, bounced to the middle band, and is now retesting near $172. If this second test holds above the lower band at $169, the W-Bottom buy signal triggers with a target back to the $181 middle band.
- AMZN Bollinger Band bandwidth at 3-month lows: Bandwidth compression signals an imminent directional move. No position yet — wait for the breakout candle to define direction before committing capital.
- MSFT middle band reclaim at $412: After breaking below the lower band, MSFT has climbed back above the middle band at $412. This reclaim is a potential long signal for swing traders targeting the upper band near $428. RSI recovering above 50 confirms the shift in momentum.
How Stocks365 Uses Bollinger Bands
📊 How Stocks365 Integrates Bollinger Bands Into Its Trust Score System
At Stocks365, Bollinger Bands are one of 12+ technical indicators feeding into the platform's proprietary Trust Score system. Specifically, Bollinger Band signals contribute to two scoring dimensions: volatility regime scoring (is the market in a squeeze or expansion phase?) and indicator agreement scoring (do multiple indicators confirm the same directional signal?).
When a stock's Bollinger Band signal aligns with RSI momentum readings and volume confirmation, the Trust Score weight for that signal increases. A single Bollinger Band touch generates a low-confidence flag. But when that touch coincides with RSI at extreme levels, a volume spike, and a recognizable candlestick pattern — the Trust Score elevates the signal to high-confidence status.
You can see Trust Scores in action for any stock on the Stocks365 signals dashboard, or check individual setups like AAPL's current signal page to see how Bollinger Band readings are weighted against other indicators in real time. The system doesn't just flag a signal — it scores how much the evidence agrees.
Key Takeaways
📌 Bollinger Bands Buy Sell Signals — Summary
- Bollinger Bands consist of a 20-period SMA with upper and lower bands at 2 standard deviations
- The band bounce works best in ranging markets — buy at lower band, sell at upper band
- In trending markets, upper-band touches are continuation signals, not sell signals
- The Bollinger Band squeeze is the most powerful setup — compression precedes explosive moves
- W-Bottoms and M-Tops offer confirmation-based reversal signals with clear entry criteria
- Always combine Bollinger Bands with RSI for higher-probability signal confirmation
- Context is everything — identify the market regime (trending vs. ranging) before applying any signal
- Default settings (20-period, 2 standard deviations) work for most daily chart applications
- The Stocks365 Trust Score system uses Bollinger Band data as part of its multi-indicator agreement scoring
Frequently Asked Questions
What is the most reliable Bollinger Bands buy signal?
The most reliable Bollinger Bands buy signal is the W-Bottom pattern combined with RSI confirmation. Price makes a first low that breaks the lower band, recovers to the middle band, then makes a second low that holds above the lower band. When RSI also shows a higher low on the second test — confirming bullish divergence — the signal carries high probability. Learn more about RSI divergence at RSI Divergence Explained: Master Bullish & Bearish Signals.
Does touching the upper Bollinger Band mean I should sell?
Not automatically. In a ranging market, yes — upper-band touches often signal a short-term sell opportunity. But in an uptrend, price regularly rides the upper band for extended periods. Selling every upper-band touch in a bull trend is a costly mistake. Look for RSI turning down from above 70, a bearish candlestick reversal pattern, or an M-Top formation before treating an upper-band touch as a sell signal. Context always wins.
How does the Bollinger Band squeeze work?
A Bollinger Band squeeze occurs when the bands narrow dramatically, indicating that volatility has compressed. This typically precedes a major price move in either direction. The squeeze itself doesn't indicate direction — it signals that a significant move is building. Wait for price to break convincingly above or below the outer bands on elevated volume before entering a trade. The Bollinger Bandwidth indicator quantifies the squeeze and helps identify when compression is at historical extremes.
What RSI level confirms a Bollinger Band lower-band bounce buy signal?
For the strongest confirmation, look for RSI below 35 — ideally approaching 30 — when price touches or pierces the lower Bollinger Band. RSI turning upward from that level while price bounces off the lower band creates a dual-confirmation buy signal. For a comprehensive understanding of RSI overbought and oversold thresholds, see RSI Overbought and Oversold Levels: Master the Signals.
Can Bollinger Bands be used for day trading?
Bollinger Bands work across all timeframes, including intraday charts. Day traders typically apply them to 5-minute, 15-minute, or 1-hour charts using the standard 20-period, 2 standard deviation settings. The band bounce and squeeze breakout setups are particularly popular for scalping and intraday swing trades. Keep in mind that signals on shorter timeframes generate more noise — combine them with volume analysis and at least one momentum indicator like RSI for better accuracy. Access real-time signal data for active stocks on the Stocks365 dashboard.