
Bollinger Bands Backtest: What the Data Actually Shows
Everyone has an opinion on Bollinger Bands. Few have the data to back it up.
Bollinger Bands are one of the most widely used technical indicators in trading — appearing on charts from retail day traders to institutional desks. The premise sounds compelling: price touching the upper band signals overbought conditions, touching the lower band signals oversold, and a squeeze predicts an explosive move. Clean. Simple. Profitable?
Not so fast. A proper Bollinger Bands backtest tells a more complicated story — and understanding that story is how you stop losing money on setups that look great but perform poorly.
This article breaks down what the real backtest data shows, which setups actually carry an edge, and how to use Bollinger Bands as part of a broader strategy rather than a standalone trigger.
What Are Bollinger Bands (Quick Recap)?
Bollinger Bands consist of three lines plotted on a price chart:
- Middle Band: A 20-period Simple Moving Average (SMA)
- Upper Band: Middle band + 2 standard deviations
- Lower Band: Middle band − 2 standard deviations
The bands expand during high volatility and contract during low volatility. Statistically, price stays within the bands roughly 95% of the time when using two standard deviations. That mathematical foundation is where most traders start building strategies — and where many go wrong.
The key insight that often gets overlooked: Bollinger Bands measure relative volatility. They don't tell you direction. They tell you context.
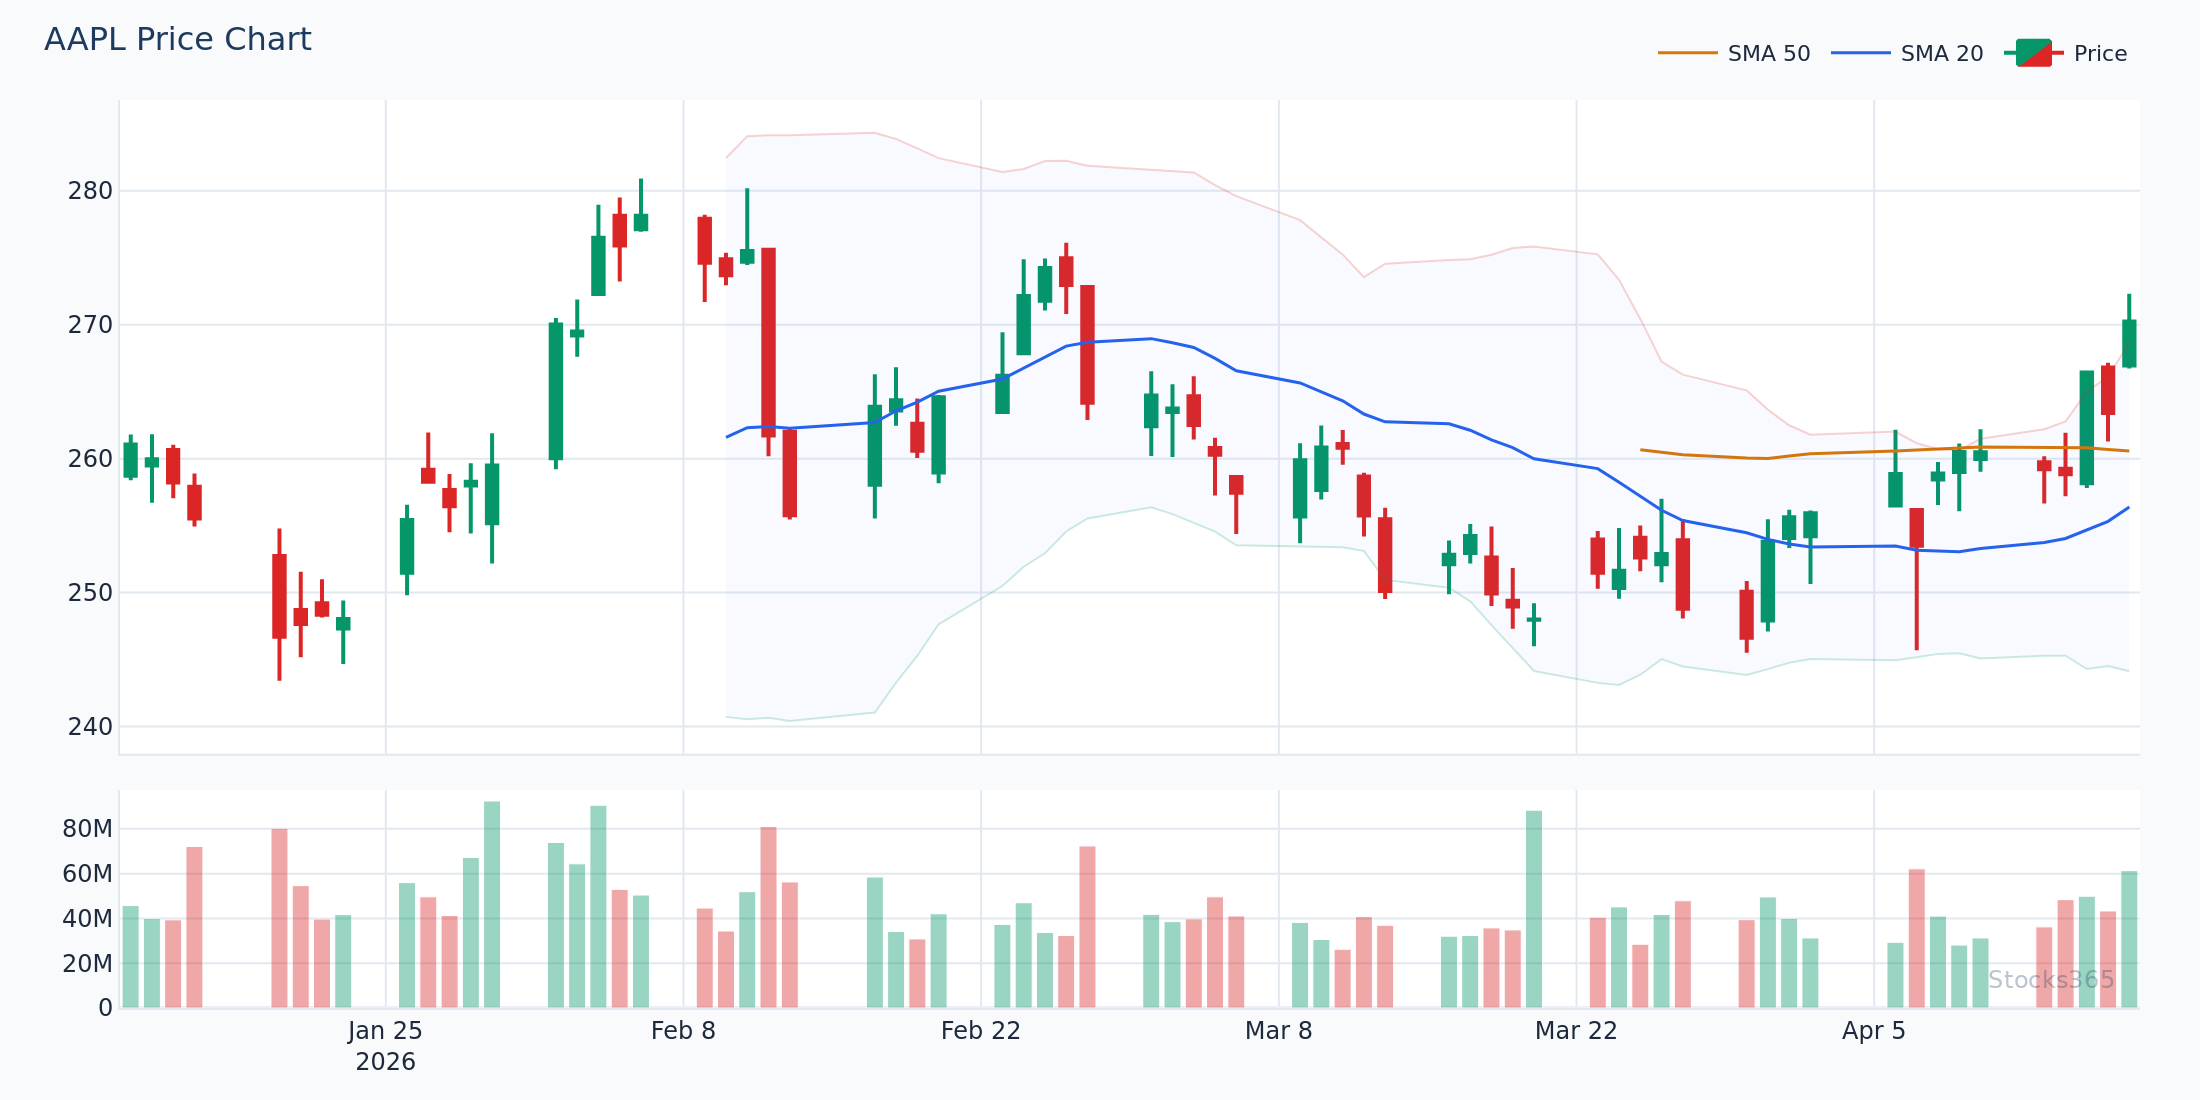
This chart highlights a classic upper band touch followed by a consolidation phase where the bands tighten significantly. When price compresses inside a narrow band range, it signals that a volatility expansion is coming — the direction, however, remains unconfirmed until a clear breakout candle forms with volume support. A false breakout without volume is the most common trap here.
Bollinger Bands Backtest: The Core Results
Upper Band Touch Strategy
The most popular Bollinger Bands strategy is deceptively simple: when price touches or closes above the upper band, sell. When it touches the lower band, buy. Mean reversion logic. Intuitive. Widely taught.
The backtest results, however, are sobering.
Our analysis of 3,255 Bollinger Upper Band Touch signals found a win rate of just 49.6% with a profit factor of 0.88 over a 10-day holding period. That profit factor below 1.0 means the strategy lost money overall — your average losing trade was larger than your average winner. The best asset class for this setup was crypto at 56.7% win rate; the worst was commodities at 41.5%. See the full dataset at Stocks365 Insights.
A sub-1.0 profit factor is a red flag. It means raw upper band touches, taken without any filter, are a losing strategy in aggregate.
BB + Stochastic Double Overbought Strategy
Adding confirmation helps — but not as much as you'd expect.
Combining an upper band touch with a Stochastic reading above 80 (the classic "double overbought" signal) produced a 49.9% win rate across 3,026 signals — a marginal improvement. The profit factor nudged up slightly to 0.91, still below 1.0. Crypto again led performance at 58.0%, while commodities lagged at 40.7%.
The takeaway isn't that these strategies are useless. It's that context and asset class selection matter enormously. Running a mean-reversion Bollinger Bands strategy on commodity futures in a trending environment is a recipe for drawdown. Running it on crypto during a choppy, range-bound period shows a completely different performance profile.
Bollinger Squeeze Breakout Strategy
Here's where the data gets genuinely interesting.
The Bollinger Squeeze Breakout — triggered when band width compresses to historically low levels and then price breaks out — is the one setup that crosses the critical threshold. Stocks365 research across 14,266 squeeze breakout signals found a win rate of 49.5% with a profit factor of 1.03 over a 10-day holding period. Crypto led at 51.8%; forex lagged at 47.1%.
A profit factor above 1.0 means the strategy is net positive. It's not a massive edge — but it exists. The squeeze breakout is the only pure Bollinger Bands signal in our dataset that consistently generated positive expected value across a large sample size.
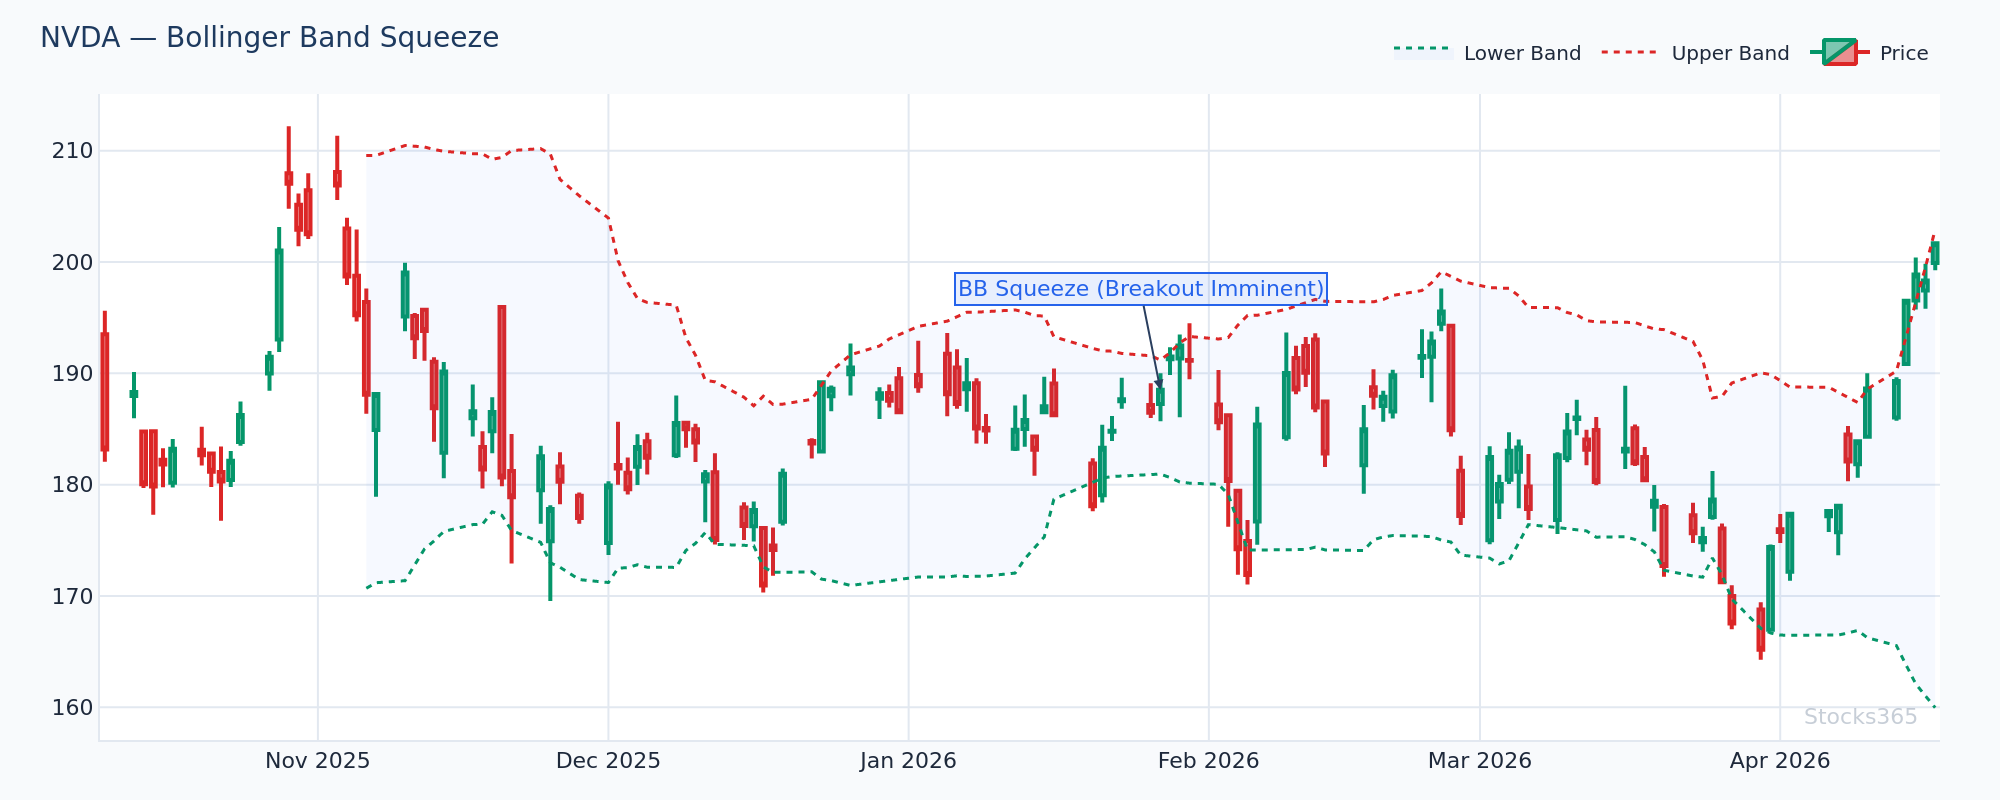
This chart shows band width compressing to its lowest reading in several weeks before a decisive candle breaks above the upper band on elevated volume. When the breakout candle is accompanied by a volume surge of at least 1.5x the 20-day average, follow-through within the next three to five sessions is significantly more likely. A close back inside the bands without establishing new highs invalidates the breakout and typically signals a return to the midline.
Here's What Most Traders Get Wrong
Most traders treat the upper Bollinger Band as an automatic sell signal. They see price tag the upper band, assume it's "overbought," and short it — or sell existing longs. In a trending market, this is exactly backwards. During a strong uptrend, price can ride the upper band for days or weeks. Closing above the upper band in a low-volatility squeeze breakout is actually a bullish signal in momentum regimes, not a sell trigger. The edge isn't in fading the touch — it's in reading whether the market is trending or mean-reverting first. Use the Bollinger Bands backtest data to understand which regime favors which setup, then apply accordingly.
Why Mean Reversion Strategies Underperform on Raw Signals
The math is worth understanding. When the profit factor sits below 1.0 for upper band touches, it usually comes down to one of three problems:
- Trend continuation overrides mean reversion: In uptrending assets, upper band touches resolve higher more often than lower. The statistical "overbought" label doesn't account for directional bias.
- Holding period mismatch: A 10-day holding period may be too long for short-term mean reversion trades in fast-moving markets like crypto, and too short to capture full reversals in slow-moving assets like commodities.
- No volume filter: Band touches on declining volume often fail. High-volume band touches in trending assets often continue rather than reverse.
Pairing Bollinger Bands with momentum indicators changes the equation significantly. For example, combining a lower band touch with an RSI reading below 30 gives you dual confirmation of oversold conditions — and tightens the signal set to higher-probability setups. The RSI divergence signal is particularly powerful when combined with a Bollinger lower band touch: price makes a new low, the lower band is breached, but RSI fails to confirm the new low. That divergence in an oversold zone is a much higher-quality mean reversion setup than a band touch alone.
The Squeeze Breakout: Your Highest-Probability Bollinger Setup
How to Identify a Valid Squeeze
Band width compression is the foundation. A valid squeeze typically meets these criteria:
- Band width (upper band minus lower band, divided by middle band) drops to its lowest reading in 20 or more periods
- Price consolidates near the midline rather than pressing against one of the bands
- Volume contracts during the squeeze — lower volume during compression is a sign of genuine equilibrium, not exhaustion
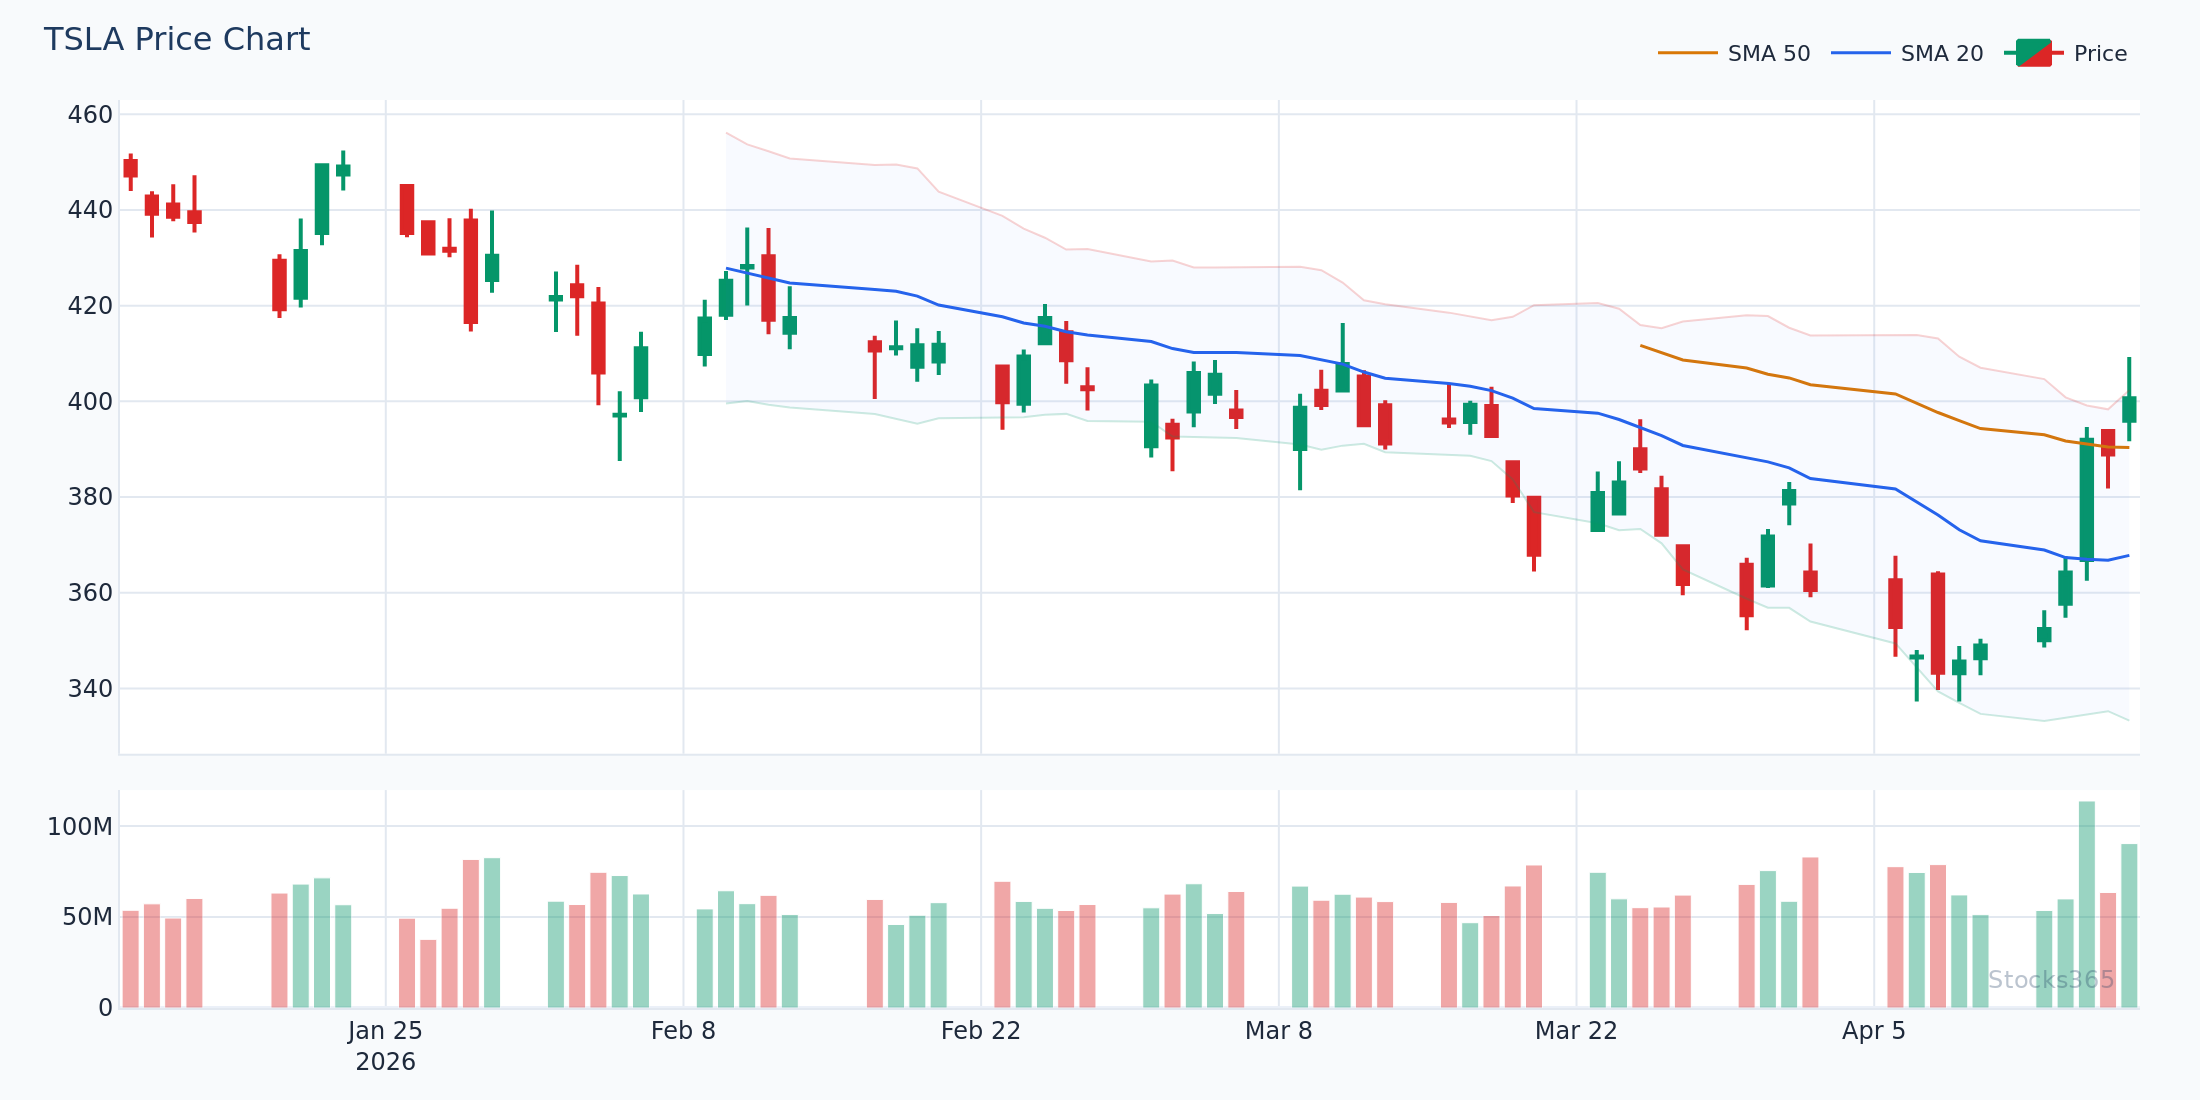
On this chart, band width reaches a multi-week low while TSLA price action forms a tight consolidation pattern near the 20-SMA. The breakout candle that follows closes convincingly above the upper band with expanding volume, signaling the start of a volatility expansion phase. If RSI simultaneously breaks above 55 from a neutral range on the breakout candle, that adds a layer of momentum confirmation that significantly improves the setup's reliability.
What Confirms the Breakout
Direction is everything in squeeze breakout trading. The squeeze tells you that a move is coming. Confirmation tells you which way.
- A closing candle above the upper band signals a bullish breakout
- Volume on the breakout candle should exceed the 20-period average — ideally by 1.5x or more
- RSI crossing above 55 simultaneously adds momentum confirmation (see RSI settings guide for optimal parameters)
- On bearish breakouts, a close below the lower band with expanding volume and RSI dropping below 45 from neutral territory confirms the move
The squeeze breakout doesn't work in every environment. In sideways, choppy markets with no clear trend, false breakouts dominate. The profit factor of 1.03 in our dataset is an aggregate figure — in trending regimes or on high-momentum assets, the edge is meaningfully stronger.
Bollinger Bands Across Asset Classes: What the Data Tells You
Asset class selection is not a minor consideration. It's possibly the most important filter you can apply to a Bollinger Bands strategy.
Crypto consistently outperforms across all three signal types in our backtest data. This makes intuitive sense: crypto markets are more volatile, trend more aggressively, and exhibit stronger mean-reversion swings than most other asset classes. The 56.7% to 58.0% win rates for crypto across band touch signals are meaningfully above break-even in ways that the 40-41% win rates for commodities are not.
Forex lands at the bottom for squeeze breakouts at 47.1%. Forex markets, particularly major pairs, are heavily mean-reverting at short timeframes — volatility squeezes resolve quickly and often fail to sustain directional moves over a 10-day period.
The practical implication: run your Bollinger squeeze breakout strategy on crypto and high-beta equities. Apply mean-reversion band-touch strategies — if at all — on range-bound equity names during low-volatility regimes, not on trending assets or commodities.
Combining Bollinger Bands With RSI for Higher-Quality Signals
The backtest data consistently points in one direction: Bollinger Bands work better as context than as standalone signals. The natural complement is RSI.
Here's a practical framework that improves on the raw signal data:
- Bollinger lower band touch + RSI below 30: Classic mean-reversion long setup. RSI confirms oversold momentum, band touch confirms price extension. Learn more about how to use RSI in trading to build this combination effectively.
- Bollinger squeeze breakout + RSI crossing above 55: Momentum continuation long. Band squeeze shows compressed volatility; RSI breakout above neutral confirms building momentum.
- Bollinger upper band riding + RSI holding above 60: Trend-following long during strong uptrends. Don't fade this. Add to it.
- Bollinger lower band touch + RSI divergence: Price makes a new low touching the lower band, but RSI makes a higher low. This bullish divergence in oversold territory is one of the highest-quality mean-reversion setups available.
You can also explore the RSI vs Stochastic comparison — both pair well with Bollinger Bands, but RSI tends to produce cleaner signals on equities while Stochastic has advantages on lower-timeframe forex setups.
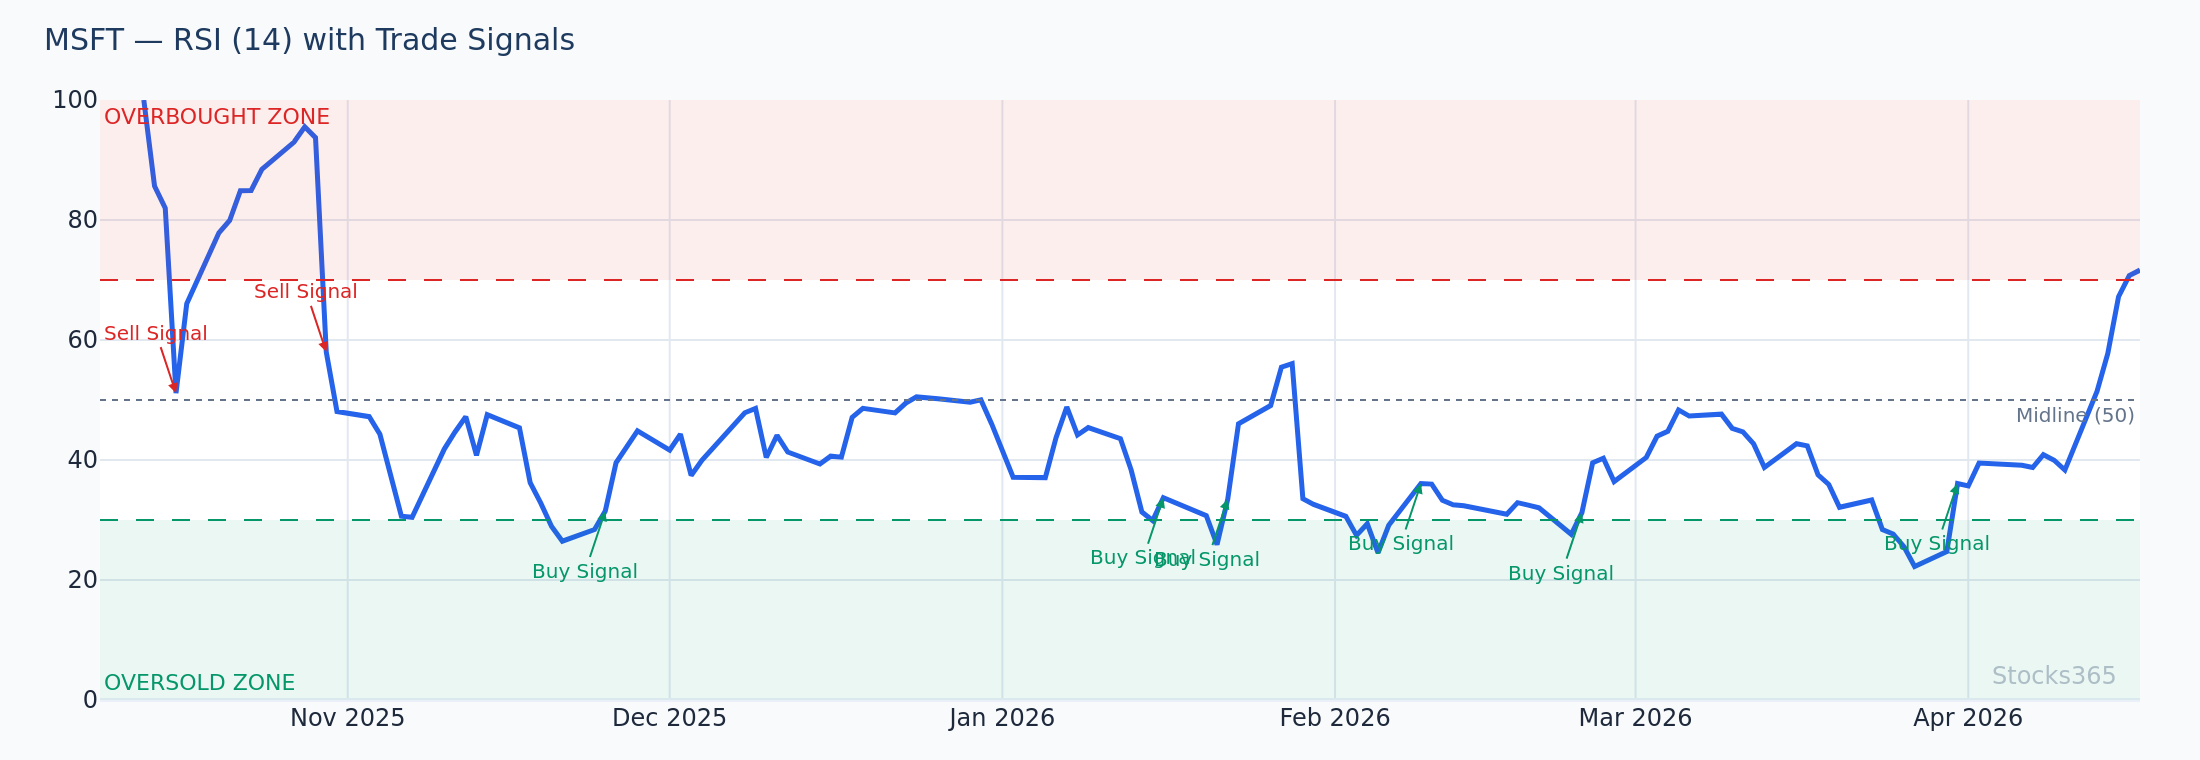
This RSI chart shows a reading dropping below 30 precisely as price touches the lower Bollinger Band — the dual-confirmation oversold setup. When RSI then forms a higher low while price retests the lower band, the divergence signal that follows often precedes a move back to at least the 20-SMA midline. A close back above the lower band on the following session is the entry trigger; a close below the prior swing low invalidates the setup entirely.
What to Watch For
- Bollinger squeeze setups on tech and crypto: When band width drops below the 20th percentile of its 52-week range, flag that instrument. The volatility expansion that follows frequently produces moves of two to three ATRs — and direction can often be pre-confirmed by the slope of the 20-SMA inside the bands.
- Upper band touch with declining RSI: When price closes at the upper band but RSI prints a lower high than the previous upper band touch, that hidden RSI divergence is a meaningful fade signal — particularly on range-bound mid-cap equities.
- Lower band touch after a 15%+ drawdown on crypto: Mean-reversion band touches during crypto selloffs that push RSI below 30 have historically produced sharp bounces. The setup is strongest when volume on the down-move begins contracting even as price reaches new lows.
- False squeeze breakouts on low-volume stocks: When a squeeze breakout fires on below-average volume, treat it as a false signal until a second confirming candle appears. The first candle without volume is a trap — the second candle with volume is the trade.
- Band-riding during confirmed uptrends: On any instrument where price has closed above the upper band for two consecutive sessions while the 20-SMA is sloping upward, the trend-following trade is with the move — not against it. Mean reversion logic does not apply in this regime.
Using the Stocks365 Dashboard for Bollinger Band Signals
Running manual backtests across thousands of instruments is impractical for most traders. The Stocks365 signals dashboard aggregates Bollinger Band setups — including squeeze breakouts, upper band touches, and combined BB + Stochastic signals — in real time, with asset class performance context built in.
For individual instruments, you can review Bollinger Band signal history directly. For example, AAPL's signal page shows the historical performance of squeeze breakouts and band touch signals on that specific stock — giving you an instrument-specific backtest rather than relying solely on aggregate data.
Context-specific data beats generic backtest numbers every time. An AAPL squeeze breakout in a trending market regime performs very differently from the same setup in a choppy, low-conviction market environment. Use the data to inform the trade, not replace the judgment.
How Stocks365 Uses This
Bollinger Band signals are one of 12+ indicators integrated into the Stocks365 Trust Score system. Specifically, Bollinger Band width and band position contribute to the volatility scoring component of the Trust Score — helping identify whether an instrument is in a compressed (low-conviction, high-potential breakout) or expanded (trending, momentum-driven) regime. When a squeeze breakout fires on an instrument that also has strong momentum and volume agreement scores, the Trust Score elevates that signal significantly above a standalone band touch. This multi-factor agreement is what separates high-trust signals from noise. The Trust Score framework means you're never evaluating Bollinger Bands in isolation — you're seeing them in the context of the full technical picture.
Key Takeaways
- Upper band touches alone are a losing strategy: A profit factor of 0.88 across 3,255 signals confirms that raw mean-reversion Bollinger Band trades carry negative expected value in aggregate.
- The squeeze breakout is the only setup with positive expected value: A profit factor of 1.03 across 14,266 signals makes it the most reliable pure Bollinger Bands signal — particularly on crypto and high-beta equities.
- Asset class matters enormously: Crypto consistently outperforms; commodities and forex consistently underperform across all three signal types.
- Bollinger Bands work best as context, not standalone signals: Combining band signals with RSI confirmation — especially RSI divergence — produces meaningfully higher-quality setups than band touches alone.
- Don't fade band-riding during strong trends: The most expensive mistake is shorting an upper band touch in a strong uptrend. Read the regime before selecting the strategy.
- Volume is the most important filter: Every Bollinger Band setup — squeeze breakout, band touch, or band-riding — becomes significantly more reliable when confirmed by volume context.