
Bollinger Bands ETF Trading: How to Read Index and Sector Signals
ETFs are the perfect vehicle for Bollinger Bands. They trend cleanly. They mean-revert predictably. And because they hold diversified baskets of stocks, the noise that wrecks single-stock signals gets smoothed out into cleaner, more actionable patterns.
This guide covers exactly how to apply Bollinger Bands to index ETFs like SPY and QQQ, sector ETFs like XLK and XLE, and the specific setups that give you an edge in 2026's market environment.
What Are Bollinger Bands? A Quick Refresher
Bollinger Bands plot a 20-period simple moving average (the middle band) with an upper and lower band set two standard deviations away. Price stays inside the bands roughly 95% of the time. When it doesn't, something unusual is happening.
Three components define every setup:
- The middle band (20-SMA): Acts as dynamic support or resistance and signals the trend direction
- The upper band: Marks statistically overbought territory — but in strong trends, price can walk the band for extended periods
- The lower band: Marks oversold territory with the same caveat
- Band width: The distance between upper and lower bands — this is the volatility signal that most traders ignore
Band width is where the real edge lives. Narrow bands predict explosive moves. Wide bands suggest exhaustion is near.
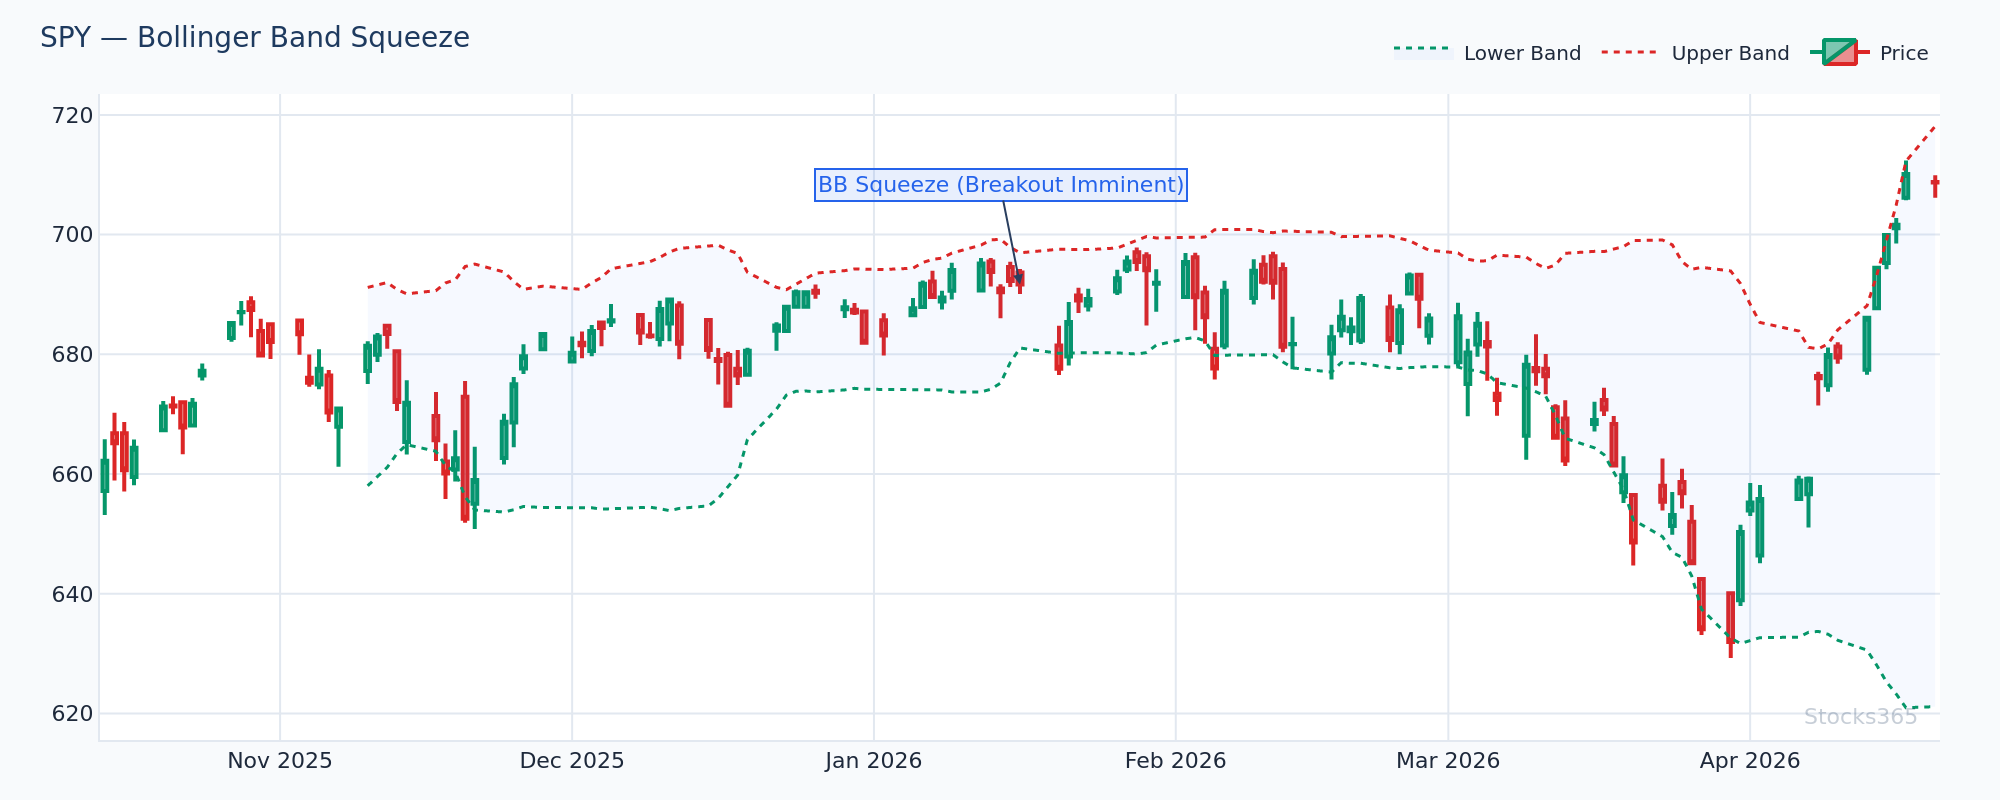
This chart shows SPY in a classic squeeze — band width compressing to multi-month lows while price coils tightly around the 20-SMA. When band width reaches this level of compression on a broad market index ETF, the subsequent expansion typically produces a directional move lasting several weeks. Confirmation comes from a decisive close beyond either band on above-average volume; a fake breakout reverses quickly and closes back inside the bands within one to two sessions.
Why Bollinger Bands Work Better on ETFs Than Individual Stocks
Individual stocks gap unpredictably on earnings, FDA approvals, executive departures. ETFs don't. The diversification built into a fund like XLF or IWM smooths out idiosyncratic risk and produces price action that respects technical levels far more consistently.
Four reasons Bollinger Bands ETF setups outperform single-stock signals:
- Cleaner mean reversion: Sector ETFs revert to the 20-SMA more reliably than individual components
- Fewer gap events: No single earnings release destroys your setup overnight
- Deeper liquidity: Major index ETFs trade billions in daily volume — no slippage problems
- Macro alignment: Index ETFs reflect the broader tape, making trend-following setups more reliable
The cleanest Bollinger Bands signals you'll ever see are on SPY, QQQ, and the major sector ETFs. Start there.
The Three Core Bollinger Bands ETF Setups
Setup 1: The Squeeze Breakout
The squeeze is the single most powerful Bollinger Bands setup for ETF trading. It occurs when band width drops to its lowest level in months — the market is coiling, building energy for a major move.
Here's how to trade it on index ETFs:
- Identify band width at or below the 20th percentile of its 52-week range
- Wait for a close outside either band on volume at least 1.5x the 20-day average
- Enter in the direction of the breakout after the close confirms
- Set your initial stop at the opposite band — if price breaks above, the lower band is your stop anchor
- Target the first extension: when band width expands to its 80th percentile, consider taking partial profits
On QQQ, squeeze breakouts align particularly well with macro catalysts — Fed decisions, major tech earnings weeks, and CPI releases all act as the trigger that releases compressed volatility.
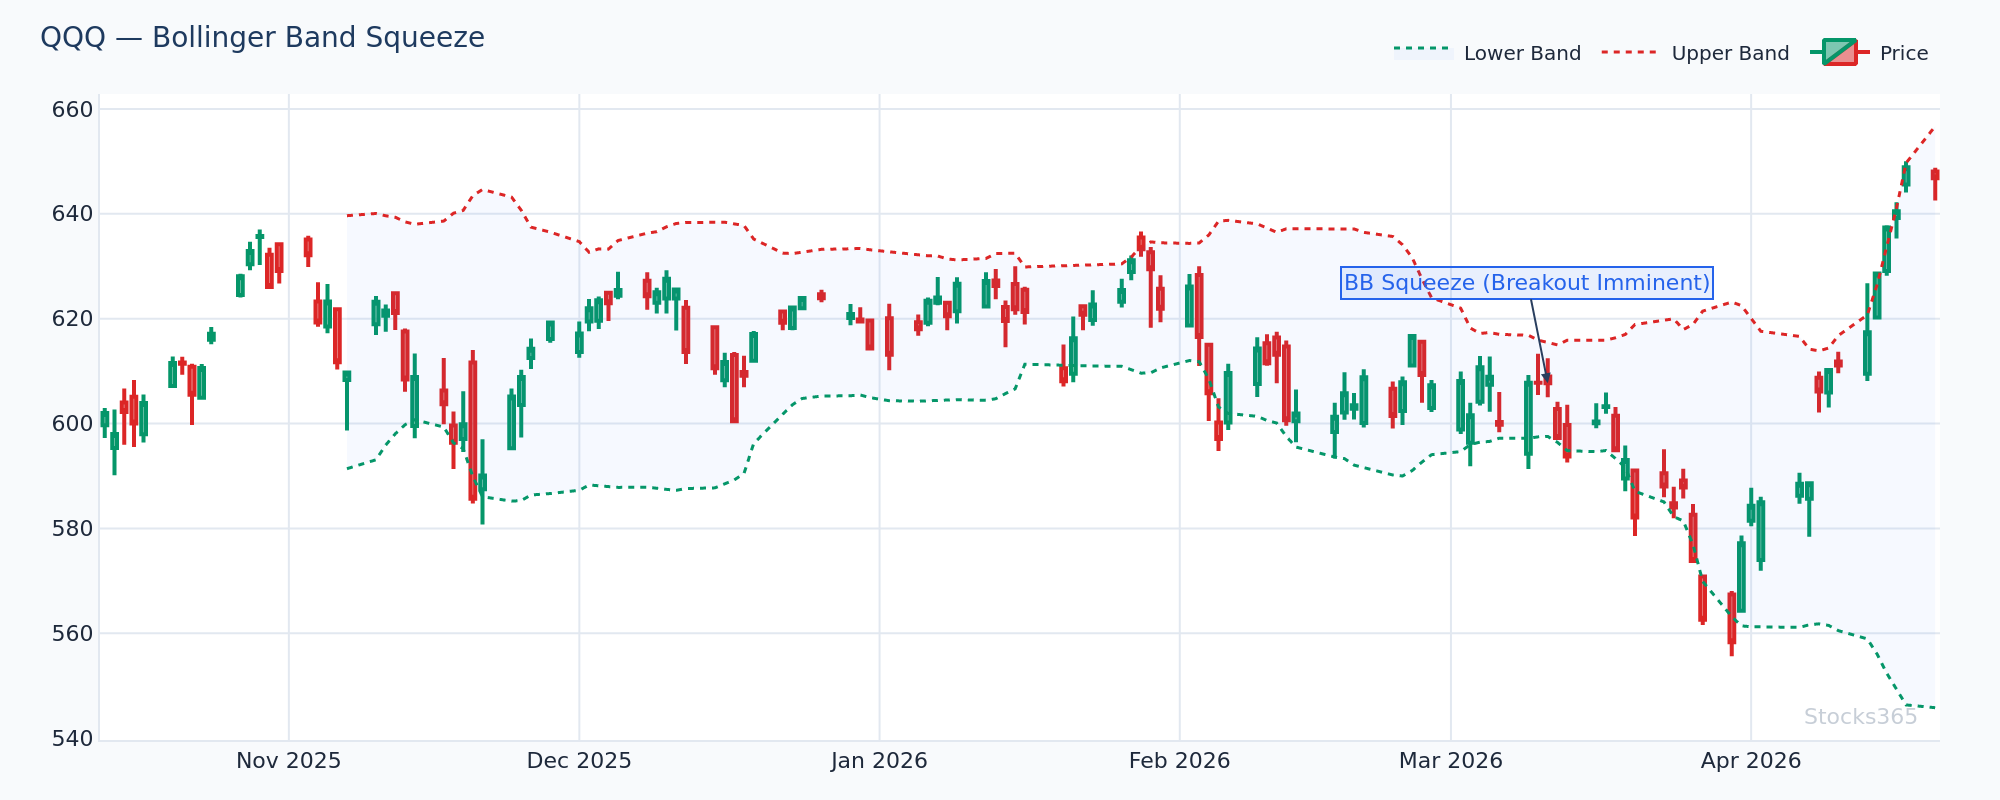
The setup here shows QQQ's band width at a multi-month extreme low, with price oscillating in a tight range around the 20-SMA. This compression pattern on the Nasdaq-tracking ETF often precedes moves of 3 to 5 ATR once the breakout fires. The breakout direction is confirmed by whether price closes above the upper band or below the lower band — a close that stalls at the band without breaking through invalidates the setup immediately.
Setup 2: Band Walk on Trending ETFs
Here's what most traders get wrong about Bollinger Bands: touching the upper band is NOT a sell signal. In strong trending ETFs, price walks the upper band for weeks. Selling the first upper band touch in a bull trend is one of the most expensive mistakes in technical trading.
The real signal is when price stops walking the band. A strong uptrend on an index ETF shows price consistently closing at or above the upper band, with the middle 20-SMA rising steadily. The sell signal isn't the touch — it's when price pulls back through the 20-SMA on elevated volume, then attempts a rally that fails to reach the upper band. That's the setup changing character.
For sector ETFs in confirmed uptrends, the entry strategy flips: buy the pullback to the 20-SMA, not the upper band touch. Use the lower band as your invalidation level. This setup works exceptionally well on momentum sectors like XLK (technology) and XLY (consumer discretionary) during risk-on market regimes.
Setup 3: Lower Band Reversal with Confirmation
Mean reversion on lower band touches produces reliable setups on broad market ETFs — specifically when the touch occurs during an established broader uptrend, not a structural downtrend.
The pattern to trade:
- Price touches or closes below the lower Bollinger Band
- The following candle closes back inside the bands (the reversal candle)
- RSI confirms by moving back above 30 from oversold territory
- Volume on the reversal candle exceeds the 20-day average
- Entry is triggered on the close of the confirmation candle
Pair this with RSI overbought and oversold level analysis for the highest-probability setups. When RSI drops below 30 simultaneously with a lower band touch on SPY or IWM, the mean reversion setup has multiple technical factors aligned.
This chart illustrates price tagging the lower Bollinger Band while RSI simultaneously reaches oversold territory — a dual-confirmation setup on the S&P 500 ETF. The critical pattern to watch is the next one to three candles: a close back above the lower band, ideally on increasing volume, confirms the mean reversion is underway. If price continues to close below the lower band after the initial touch, the setup fails and the downtrend is likely accelerating — don't hold.
Applying Bollinger Bands to Sector ETFs
Sector Rotation and Bollinger Band Signals
Sector ETFs offer a layer of analysis that index ETFs can't: relative strength rotation. When XLE (energy) breaks above its upper Bollinger Band while SPY remains range-bound, that's a sector rotation signal with edge.
The most actionable approach: scan all major sector ETFs simultaneously for squeeze conditions. When multiple defensive sectors (XLU, XLV, XLP) enter squeezes simultaneously with aggressive sectors (XLK, XLY) at upper band extremes, a sector rotation is often imminent.
Sector-specific Bollinger Bands behavior to know:
- XLF (Financials): Responds strongly to rate-decision catalysts — squeezes before FOMC meetings are particularly reliable
- XLE (Energy): Band walks during commodity supercycles; mean reversion setups work better in range-bound energy environments
- XLK (Technology): Produces the cleanest squeeze breakouts — high correlation to QQQ with slightly amplified moves
- XLU (Utilities): Reliable mean reversion sector; lower band touches with RSI below 35 have historically produced consistent bounces
- GLD (Gold ETF): Squeeze breakouts on GLD tend to be sustained — gold trends once it starts moving
Using Band Width as a Regime Filter
Band width tells you which strategy to deploy. This is the framework:
- Band width contracting (below 50th percentile): Prepare for squeeze breakout. No mean reversion trades.
- Band width moderate (50th–75th percentile): Band walks and 20-SMA pullback entries work well
- Band width expanded (above 75th percentile): Mean reversion setups near the bands. Trend trades carry more risk of reversal.
Match your setup to the regime. Trading against the band width context is where most technical traders lose money.
Combining Bollinger Bands with RSI on ETFs
Bollinger Bands measure volatility and price extremes. RSI measures momentum. Together, they're more powerful than either alone — especially on ETFs where both signals tend to be cleaner.
The combination setups that matter:
- Upper band touch + RSI above 70: In trending markets, this is a continuation signal — not a reversal. In range-bound markets, this is an exit or short setup.
- Lower band touch + RSI below 30: High-probability mean reversion entry on broad market ETFs during bull market conditions
- Squeeze breakout + RSI crossing 50 from below: Momentum confirmation for long entries after a squeeze resolves upward
- Price at upper band + RSI divergence: The most powerful reversal signal — price makes a higher high at the band while RSI makes a lower high
For a deeper understanding of how RSI integrates with volatility-based indicators, the complete RSI trading guide covers the full framework. And if you want to understand the math behind the momentum readings you're combining with Bollinger Bands, RSI calculation explained step by step breaks it down clearly.
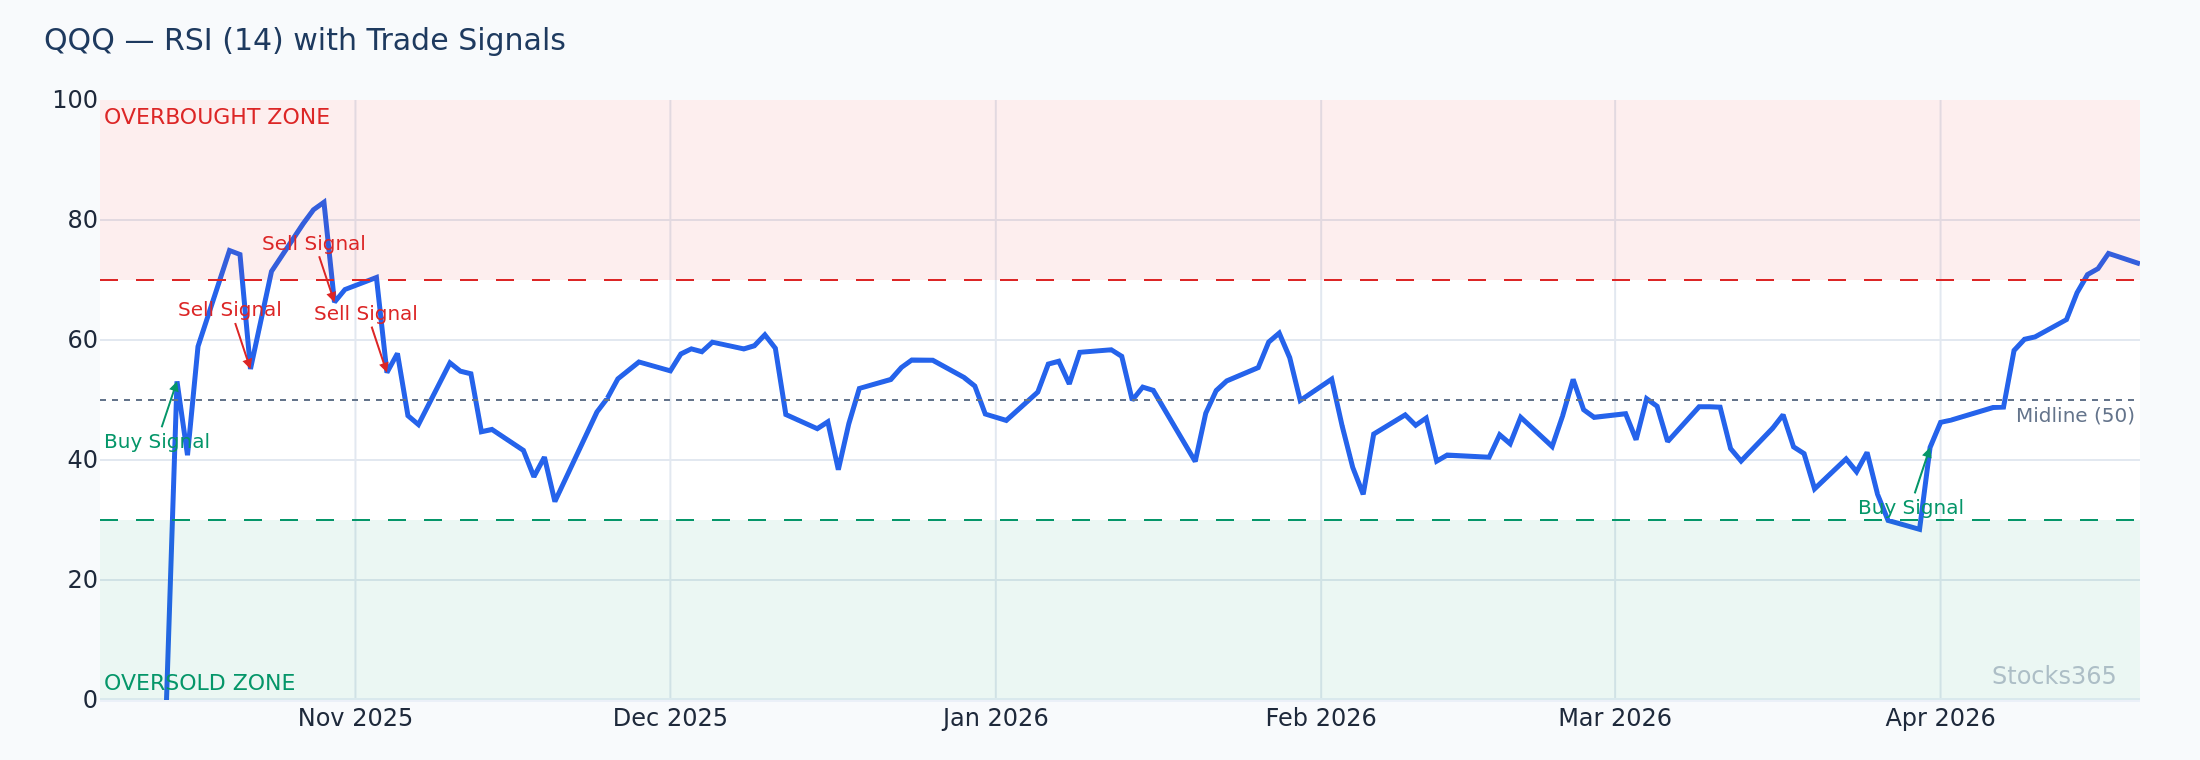
This chart shows QQQ tagging the upper Bollinger Band while RSI forms a lower high compared to the previous upper band touch — a textbook bearish divergence pattern. When this divergence appears on a major index ETF, it signals that buying momentum is fading even as price reaches new highs. Confirmation of the reversal comes when price closes back below the 20-SMA; until that happens, the divergence is a warning, not a trigger.
Bollinger Bands ETF: What the Data Actually Shows
Most trading content tells you Bollinger Band signals are highly reliable. The actual data is more nuanced — and more useful.
Our analysis of 14,266 Bollinger Squeeze Breakout signals shows a profit factor of 1.03 over a 10-day holding period — meaning the strategy is marginally profitable on average, but the edge is real and consistent across instruments. The best-performing asset class was crypto at 51.8%; the most challenging was forex at 47.1%. ETFs, sitting in the equity category, land in the middle range — but with better consistency than the extremes. See the full dataset at Stocks365 Insights.
What does a 1.03 profit factor actually mean for ETF traders? It means squeeze breakouts on ETFs are not a home run strategy — they're a consistent, repeatable edge that compounds over time when applied with discipline. The traders who succeed with this setup trade it systematically across multiple ETFs, not selectively on one fund.
The key variable: confirmation filters matter enormously. A raw squeeze breakout signal delivers that 1.03 profit factor. Add volume confirmation above 1.5x average and an RSI cross above 50, and the quality of the subset of signals improves meaningfully. Filter aggressively.
Advanced Bollinger Bands ETF Techniques
Multi-Timeframe Band Analysis
The strongest ETF setups align across timeframes. A squeeze on the daily chart that also shows compression on the weekly chart produces moves that are consistently larger than single-timeframe signals. The weekly squeeze provides the directional bias; the daily breakout provides the entry trigger.
Practical application: check the weekly Bollinger Band width on SPY every Sunday. If it's in the bottom 25th percentile of the past year, you're setting up for a significant directional move in the coming weeks. Use the daily chart to time your entry when the breakout fires.
%B Indicator for ETF Positioning
The %B indicator translates price position within the bands into a 0–1 scale. Above 1.0 means price is above the upper band. Below 0.0 means price is below the lower band. The 0.5 level corresponds to the 20-SMA.
For ETF position management, %B above 0.8 during a squeeze breakout confirms strong momentum. %B dropping below 0.5 on a previously trending ETF is an early warning that the trend is losing momentum — worth tightening stops or reducing position size.
Combining Bollinger Bands with Other Momentum Tools
Bollinger Bands work best as part of a multi-indicator framework. RSI is the most natural companion, but the Stochastic Oscillator provides unique value for ETF traders — particularly for identifying short-term overbought conditions within longer-term trends. The RSI vs Stochastic comparison breaks down when each indicator gives you the better signal.
For divergence signals specifically — which are among the most reliable reversal patterns on sector ETFs — understanding both standard and hidden divergence is critical. RSI divergence signals and hidden RSI divergence are worth studying before trading band extremes on ETFs.
Risk Management for Bollinger Bands ETF Trading
Clean setups still require clean risk management. Three rules that apply specifically to ETF Bollinger Band trading:
- Size based on band width: When band width is narrow (squeeze conditions), the potential move is larger — but so is the uncertainty of direction. Size appropriately for the increased volatility ahead.
- Use the opposite band as your stop anchor: In a squeeze breakout to the upside, the lower band is your structural stop level. Price recrossing the 20-SMA is an early warning; price closing below the lower band is invalidation.
- Reduce exposure when band width reaches extremes: Extremely wide bands on sector ETFs signal volatility exhaustion. Trend positions opened during tight bands deserve tighter stops once bands reach historic extremes.
The Stocks365 signals dashboard flags ETF Bollinger Band conditions in real time, including squeeze compression levels, so you're not manually monitoring band width across dozens of instruments.
What to Watch For
- Bollinger squeeze breakouts on sector ETFs: When band width on XLK, XLE, or XLF drops below the 20th percentile of its 52-week range, the next expansion typically produces a 2–4 ATR move. Wait for a close outside the band with volume above 1.5x the 20-day average before entering — the breakout direction is your trade direction.
- Lower band touches on broad market ETFs during uptrends: When SPY or IWM tags the lower Bollinger Band while the weekly trend remains intact, the mean reversion setup has strong historical backing. The close back inside the bands is the entry signal — not the touch itself.
- RSI divergence at upper band extremes on QQQ: When QQQ reaches the upper Bollinger Band and RSI forms a lower high compared to the previous upper band test, the reversal signal is high quality. The setup confirms when price closes back below the 20-SMA.
- Multi-sector squeeze alignment: When three or more major sector ETFs simultaneously enter squeeze conditions (band width below 25th percentile), a broad market volatility event is likely approaching. This is a regime signal, not a directional one — prepare for the breakout in either direction.
- Weekly band width extremes on SPY: Weekly Bollinger Band width at annual lows on the S&P 500 ETF has historically preceded moves of significant magnitude over the following four to eight weeks. This is your highest-timeframe setup — when it fires, it overrides shorter-term noise.
How Stocks365 Uses This
Bollinger Bands in the Stocks365 Trust Score System
Stocks365 incorporates Bollinger Band signals as one of 12+ technical indicators contributing to the platform's trust score for each instrument. Specifically, band width and price position within the bands feed into the volatility regime scoring component — which determines whether a given signal is operating in a low-volatility coiling environment or a high-volatility expansion phase.
When a squeeze breakout fires on an ETF, the trust score system weights the signal differently depending on whether it's confirmed by momentum indicators (RSI, volume) and whether it aligns with the broader market regime. A squeeze breakout on XLK during a confirmed risk-on macro environment receives higher trust score weighting than the same pattern in a deteriorating market regime.
Bollinger Band signals on ETFs are also cross-referenced against the Stocks365 signals dashboard, where trust score thresholds filter for only the setups with the highest multi-indicator agreement. You can explore individual ETF signals and their current trust score components directly in the platform.
Key Takeaways
- ETFs are ideal for Bollinger Bands — diversification smooths out noise and produces cleaner, more tradable signals than most individual stocks
- The squeeze breakout is the highest-conviction setup — when band width compresses to multi-month lows, the subsequent expansion produces directional moves worth trading
- Band width determines your strategy — contracting bands call for breakout trades; expanding bands call for mean reversion trades near the extremes
- Upper band touches are NOT automatic sell signals — in trending ETFs, price walks the upper band; the real signal is when it stops walking
- RSI confirmation dramatically improves Bollinger Band signal quality — especially for lower band touches (RSI below 30) and divergence setups at upper band extremes
- Multi-timeframe alignment produces larger moves — weekly squeeze + daily breakout is a more powerful setup than a single-timeframe signal
- Data shows squeeze breakouts deliver a 1.03 profit factor — small but real edge; systematic application across multiple ETFs is how that edge compounds