
Bollinger Bands vs Donchian Channels: Two Channels, One Decision
Every serious trader eventually confronts this choice. Both Bollinger Bands and Donchian Channels draw dynamic envelopes around price. Both help you spot breakouts, mean reversion setups, and volatility shifts. But they work in fundamentally different ways — and using the wrong one for your strategy costs you edge.
This guide cuts through the noise. By the end, you'll know exactly which tool belongs on your chart.
What Are Bollinger Bands? The Volatility-Adaptive Channel
John Bollinger introduced Bollinger Bands in the 1980s. The concept is elegant: wrap a moving average with bands that expand and contract based on actual price volatility.
How Bollinger Bands Are Constructed
The standard setup uses three lines:
- Middle Band: A 20-period simple moving average (SMA)
- Upper Band: Middle band + 2 standard deviations
- Lower Band: Middle band − 2 standard deviations
Standard deviation is the key. When price swings wildly, the bands widen. When price consolidates quietly, they compress. The bands breathe with the market's volatility — they're not static.
That adaptability is Bollinger Bands' greatest strength. A price touching the upper band during low volatility means something very different from a touch during a high-volatility expansion phase.
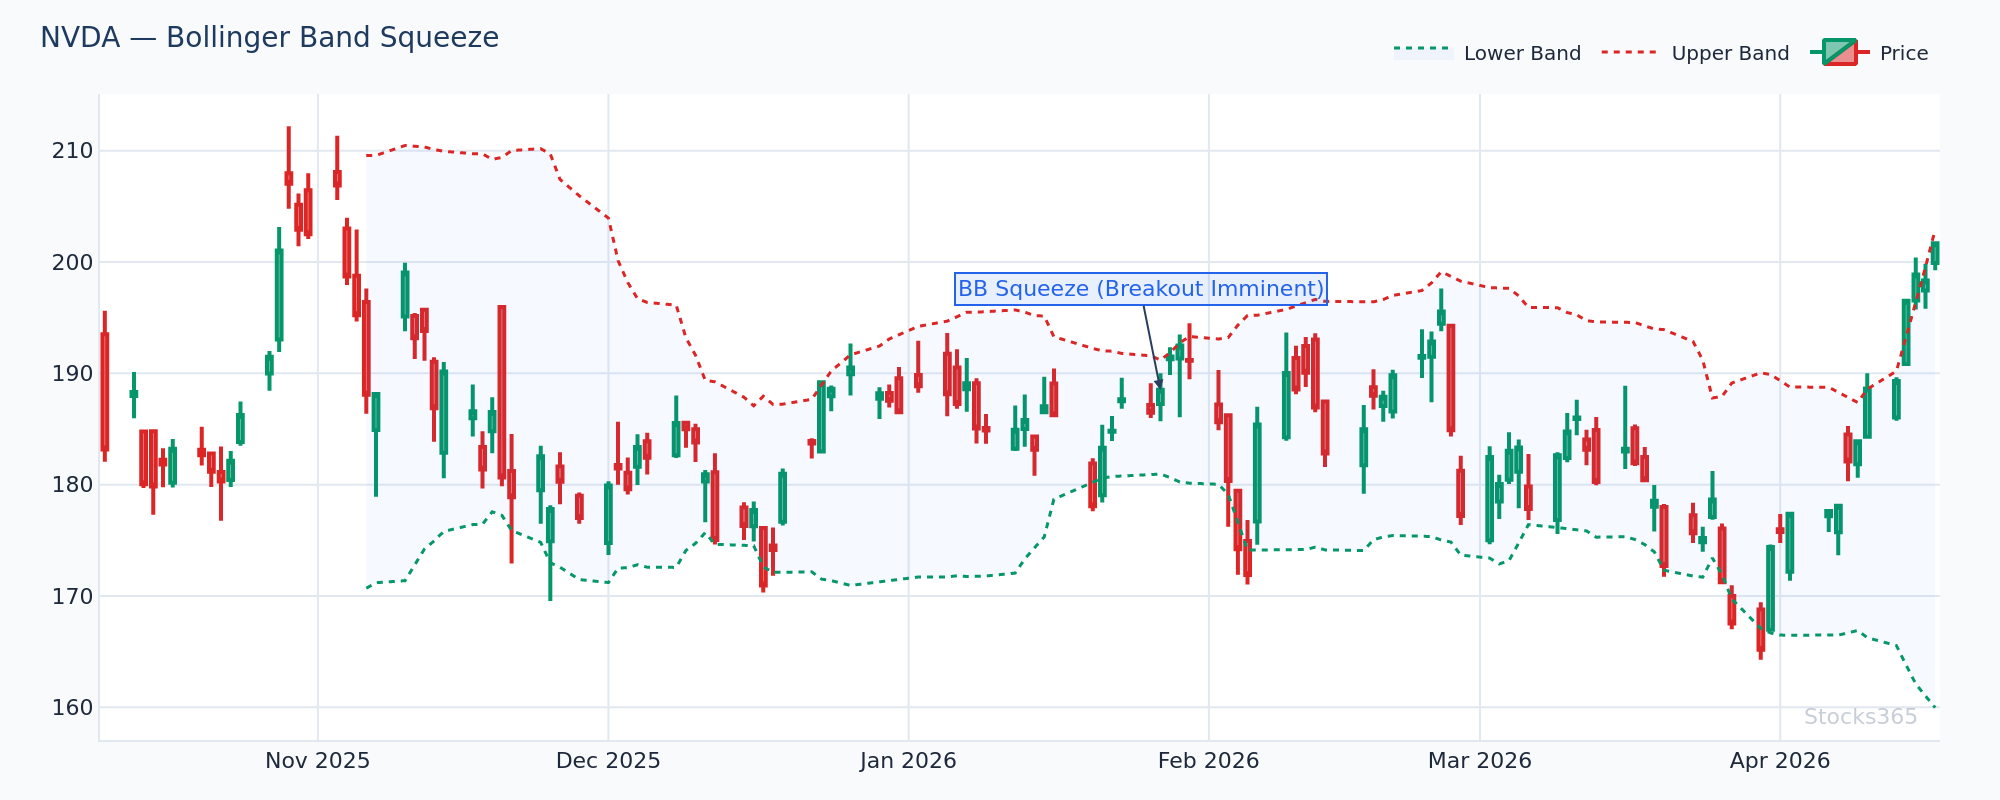
This chart shows NVDA's band width compressing to a multi-week low before price accelerates sharply higher. When bands squeeze this tight, a directional expansion is imminent — the question is always which direction. Volume confirmation and a close outside the bands are the key signals that validate the move rather than a false breakout that fades back inside.
What Are Donchian Channels? The Price-Range Channel
Richard Donchian, often called the father of trend following, developed Donchian Channels in the mid-20th century. The logic is simpler than Bollinger Bands — and sometimes simpler wins.
How Donchian Channels Are Constructed
Three lines again, but calculated differently:
- Upper Channel: Highest high over the past N periods (default: 20)
- Lower Channel: Lowest low over the past N periods
- Middle Line: Average of upper and lower channel
No statistics. No standard deviations. Donchian Channels simply track where price has been — the raw high-low range over a defined lookback period.
This makes Donchian Channels purely price-driven. A new high above the upper channel is a factual breakout to the highest level in N periods. There's no volatility adjustment obscuring that signal.
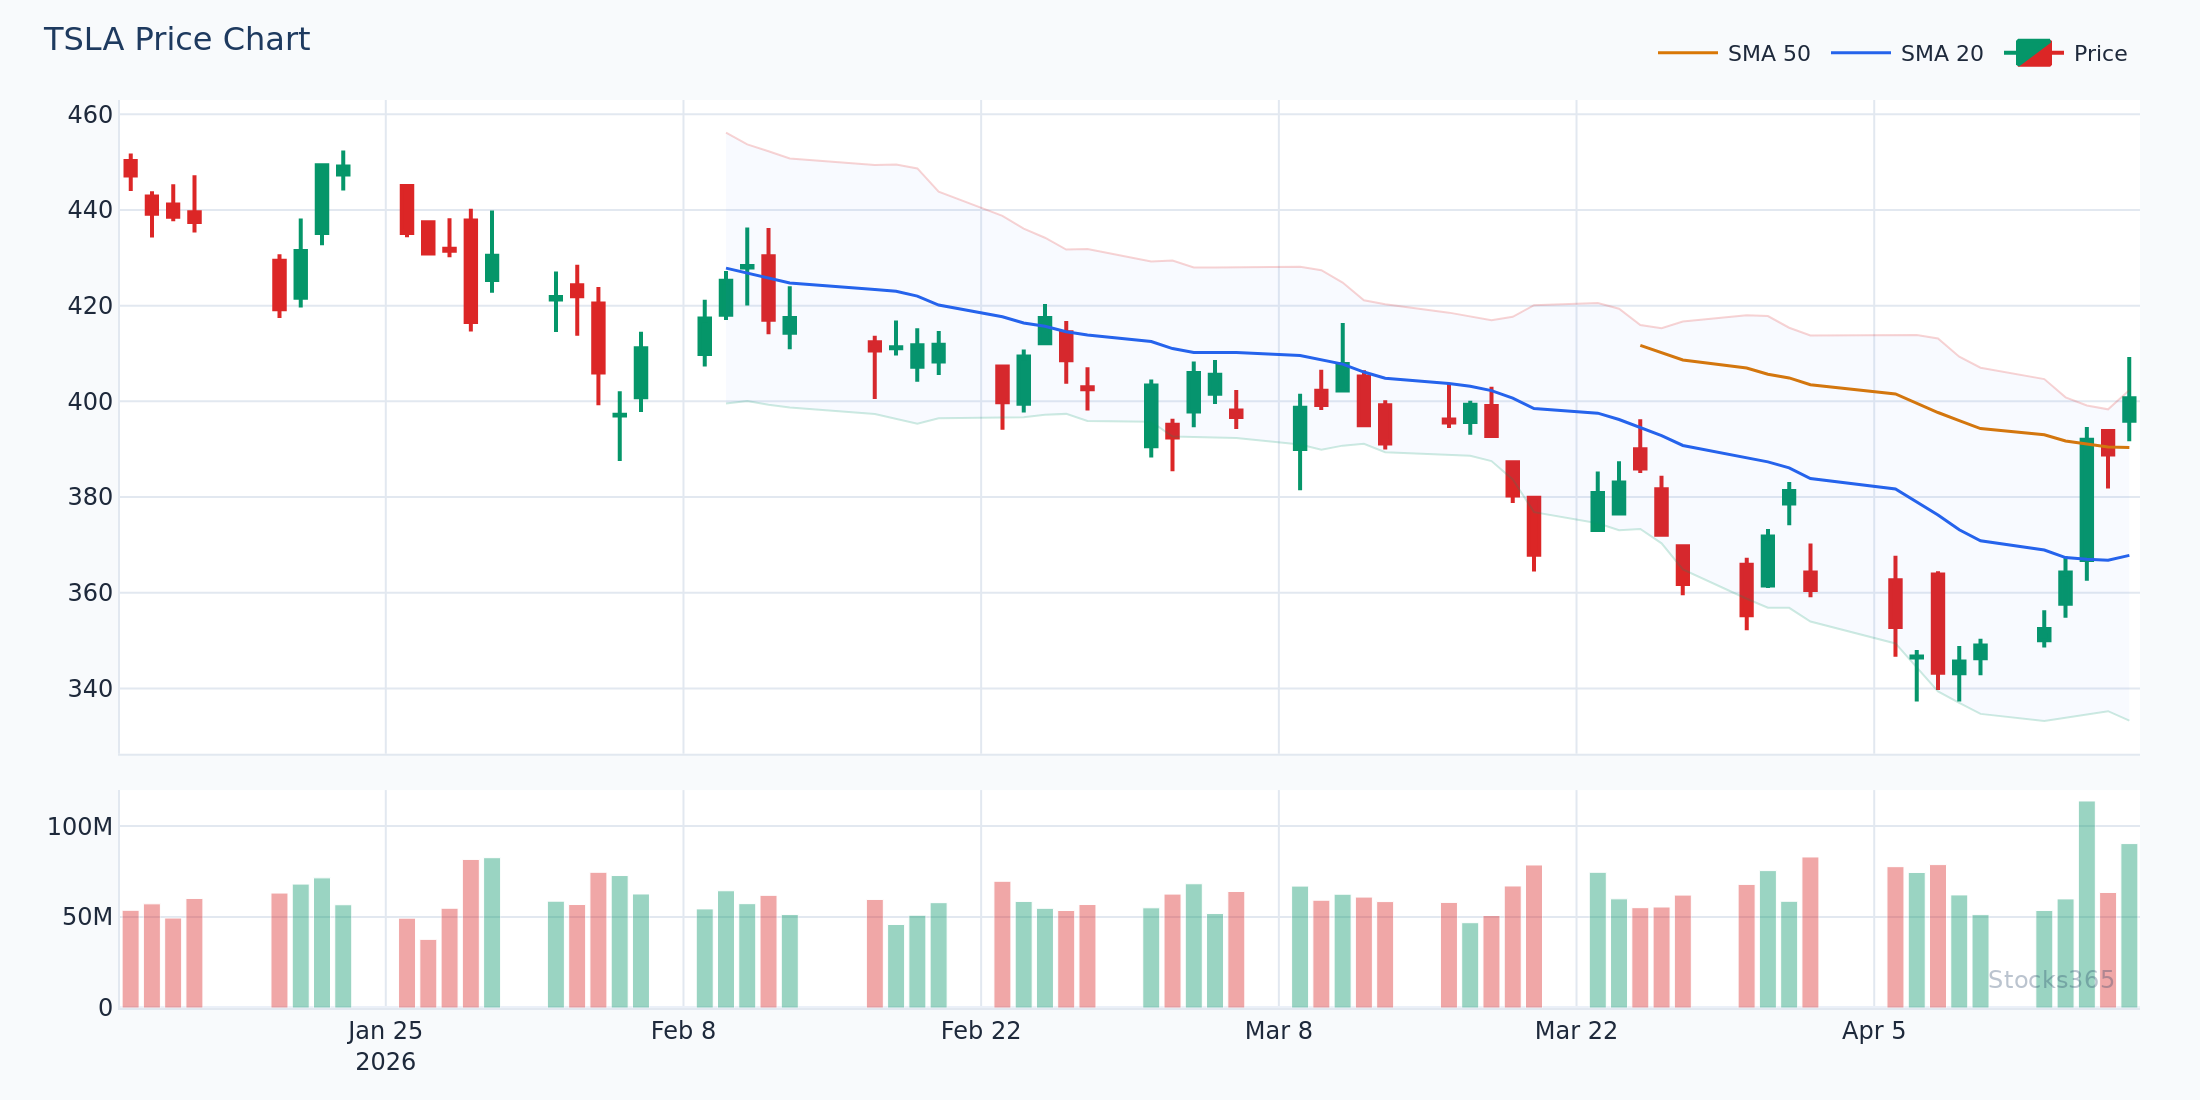
Here TSLA approaches its 20-period Donchian upper channel after a series of higher lows — a classic coiling pattern. A daily close above the upper channel line confirms a 20-period breakout; momentum traders typically enter on that close with a stop below the recent swing low. If price reverses back inside the channel within two candles, the breakout is likely a false signal and the setup is invalidated.
Bollinger Bands vs Donchian Channels: Core Differences
Understanding these differences determines which tool suits your strategy.
1. Volatility Sensitivity
Bollinger Bands adapt to volatility in real time. After a large price move, the bands widen, making it harder for price to touch either band again immediately. After quiet consolidation, they compress, making even modest moves look significant.
Donchian Channels do not adapt to volatility. They track raw price range. During low-volatility periods, the channels narrow only because price hasn't made new highs or lows — not because the indicator recalibrates itself.
2. Mean Reversion vs. Trend Following
Bollinger Bands are naturally suited to mean reversion strategies. Price tends to revert to the middle band (the 20-SMA) after touching either extreme. This creates high-probability fade setups in ranging, low-volatility environments.
Donchian Channels are built for trend following. A breakout above the upper channel signals that price is at a new N-period high — a structural statement about momentum, not a statistical extreme to fade.
3. Signal Types
| Signal Type | Bollinger Bands | Donchian Channels |
|---|---|---|
| Breakout Entry | Close outside band (low-conviction in trends) | Close above upper / below lower (primary signal) |
| Mean Reversion | Band touch + reversal candle | Channel boundary touch (weaker signal) |
| Squeeze / Expansion | Band width percentile compression | Channel width narrowing (less precise) |
| Stop Placement | Opposite band or middle band | Opposite channel boundary |
What Most Traders Get Wrong About Both Indicators
Here's what most traders get wrong: they treat a price touch on either channel as a standalone signal. Price touching the Bollinger upper band doesn't mean sell. Price breaking the Donchian upper channel doesn't guarantee a trend continuation. Both signals only have edge when confirmed by context — volume, momentum, and market regime. A Bollinger Band touch in a strong uptrend is not a reversal setup; it's a continuation signal in disguise. Ignoring regime turns channel indicators from useful tools into noise generators.
Bollinger Band Squeeze Breakouts: What the Data Shows
The Bollinger squeeze is one of the most talked-about setups in technical analysis. Band width compresses to historically low levels, and traders wait for the expansion breakout.
Our analysis of 14,266 Bollinger Squeeze Breakout signals found a profit factor of 1.03 over a 10-day holding period — marginally positive overall, but with meaningful variation by asset class. Crypto led with a 51.8% win rate while forex lagged at 47.1%. The full dataset is available at Stocks365 Insights.
That 1.03 profit factor tells an honest story. Squeeze breakouts aren't magic. They need confluence — a directional bias from a higher timeframe trend, a volume surge at breakout, or a momentum confirmation from an oscillator.
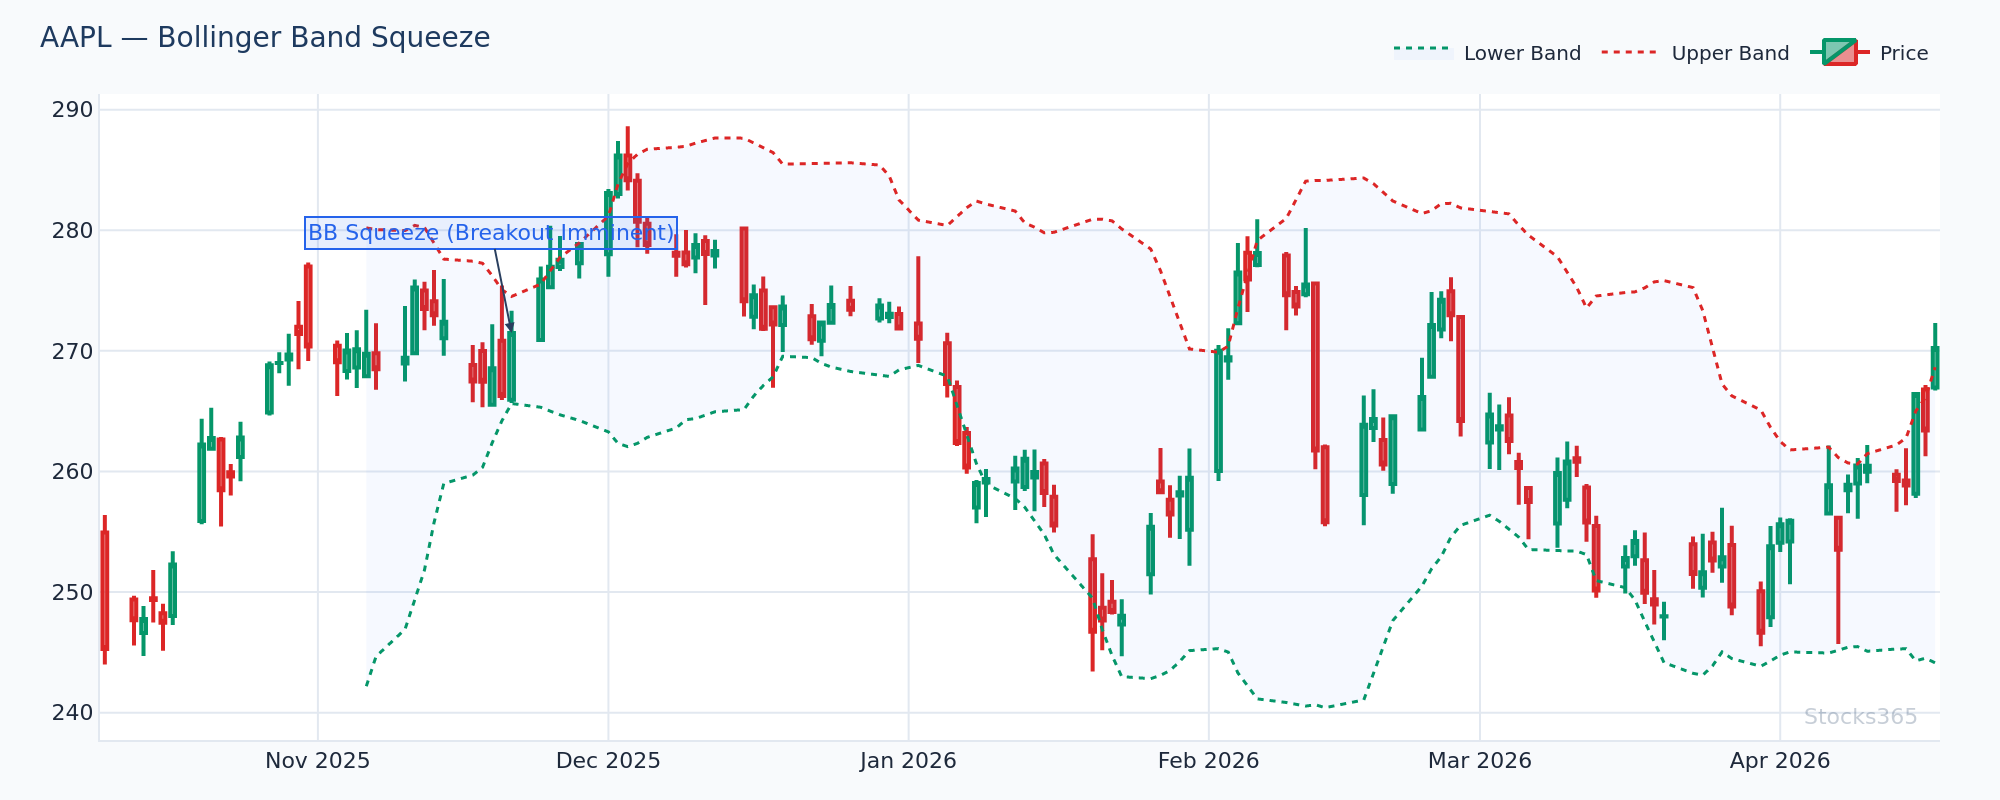
AAPL's band width here drops to its lowest reading in several months — a classic pre-breakout compression. The bands are nearly flat, and price oscillates in a tight range just below the declining upper band. A close above the upper band with volume running above the 20-day average would confirm the breakout direction; a failure to close above, followed by a return to the lower band, often signals the compression continues or resolves downward.
Donchian Channel Breakouts: Trend Following at Its Purest
The turtle traders made Donchian Channel breakouts famous. Enter on a 20-period high. Exit on a 10-period low. Simple rules, executed with discipline, generated extraordinary returns in trend-rich environments.
The mechanics still work in 2026. The 20-period Donchian breakout on daily charts is a reliable filter for meaningful momentum shifts — particularly in commodities, crypto, and large-cap equities during macro-driven trends.
The Donchian Breakout Setup
Look for these conditions before acting on a Donchian breakout signal:
- Price consolidates inside the channel for at least 5-10 periods before the breakout
- Volume expands 1.5x to 2x average on the breakout candle
- The broader trend (50-SMA or 200-SMA slope) aligns with the breakout direction
- No major resistance or support level directly ahead
Confirm with momentum. An RSI reading above 55 and climbing during a Donchian upper breakout strengthens the case significantly. Divergence between price making a new channel high and RSI failing to confirm is a red flag — see our guide to RSI divergence signals for exactly how that plays out.
When to Use Bollinger Bands
Bollinger Bands perform best in specific conditions. Know them.
Best Environments for Bollinger Bands
- Range-bound markets: When price oscillates between support and resistance, band touches become reliable mean-reversion entry points.
- Post-trend consolidation: After a major move, Bollinger Bands identify the compression phase before the next leg.
- Volatility-sensitive assets: Equities around earnings, crypto during low-liquidity windows, and assets with erratic volatility cycles benefit from the adaptive nature of the bands.
- Squeeze detection: No other channel indicator identifies low-volatility compression as precisely as Bollinger Bands using band width percentile.
Bollinger Bands Work Best With
Pair Bollinger Bands with momentum oscillators for confirmation. The RSI and Stochastic Oscillator both complement Bollinger Bands naturally — RSI confirms whether a band touch represents genuine overbought or oversold conditions, while Stochastic identifies momentum exhaustion at band extremes.
Volume matters too. A band touch on contracting volume is a much stronger mean-reversion setup than one accompanied by surging volume — high volume at a band touch suggests continuation, not reversal.
When to Use Donchian Channels
Trend following is where Donchian Channels shine. Period.
Best Environments for Donchian Channels
- Trending markets: Any sustained directional move — Donchian breakouts catch the entry and the exit precisely.
- Commodity markets: Donchian Channels have a proven track record in commodity trend following going back decades.
- Systematic strategies: Rules-based systems benefit from Donchian's objective, math-free construction. No parameter sensitivity from standard deviation calculations.
- Higher timeframes: Weekly Donchian Channels on major indices and large-cap stocks filter noise and capture structural trend changes effectively.
Donchian Channels Work Best With
Trend confirmation tools amplify Donchian signals. A 50-SMA or 200-SMA slope filter keeps you on the right side of the trend. Using RSI alongside Donchian breakouts adds a momentum layer — entries on Donchian breakouts where RSI simultaneously crosses above 50 from below have meaningfully better follow-through than breakouts where RSI is already extended above 70.
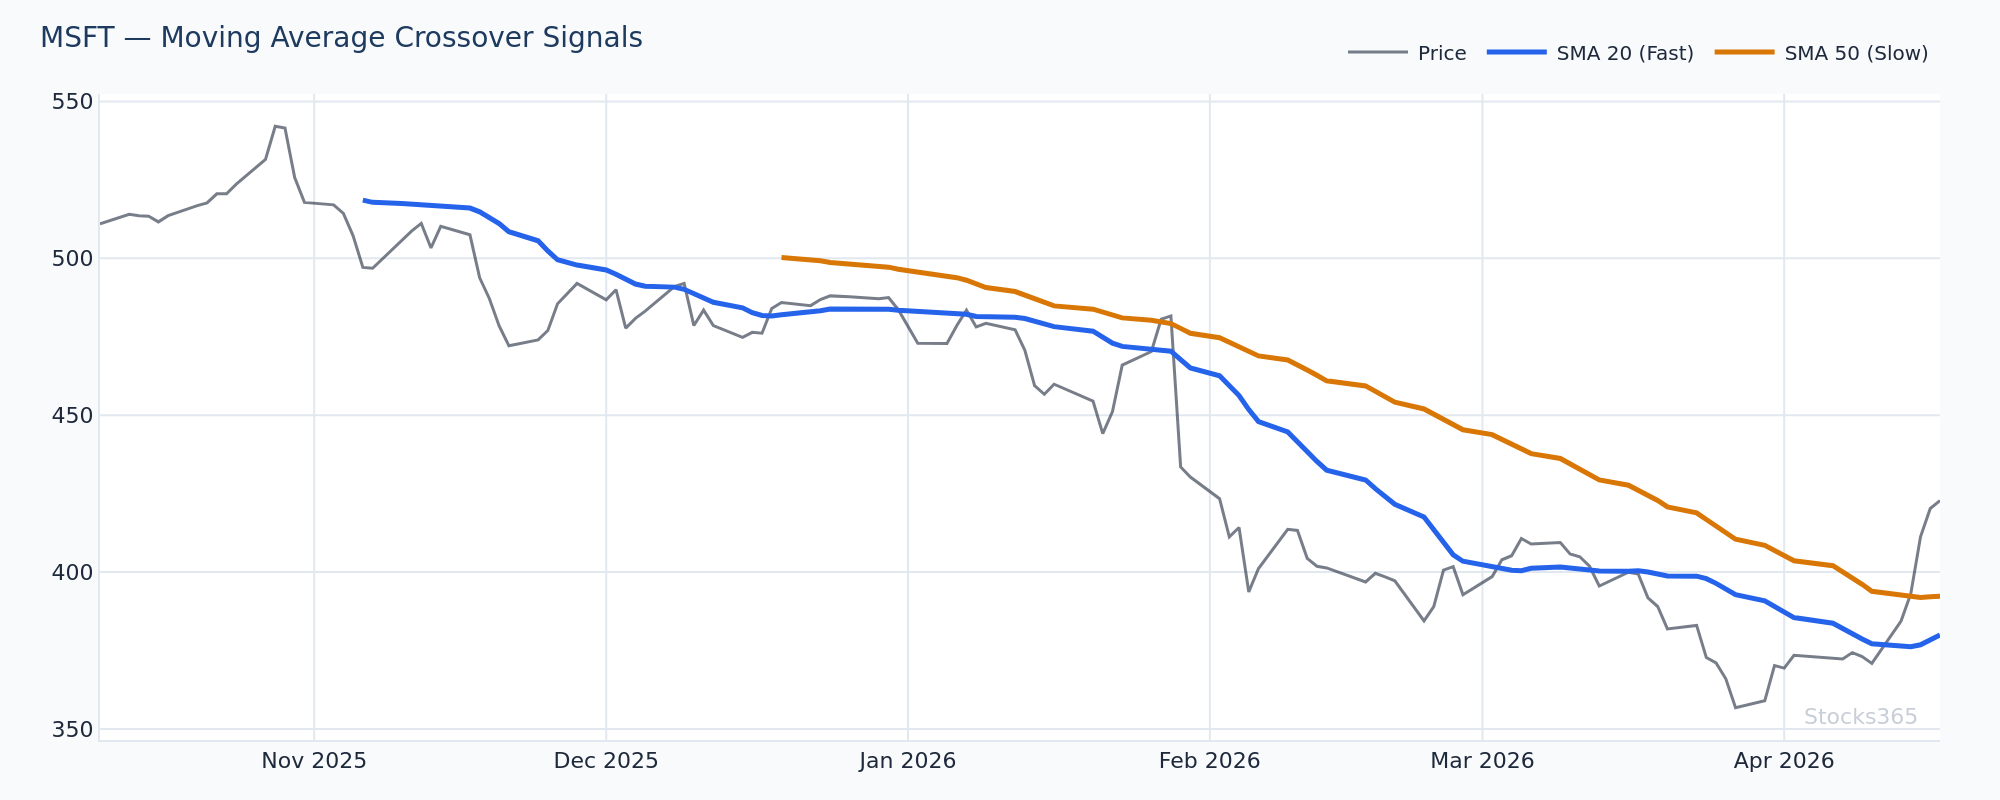
MSFT's 20-period Donchian upper channel aligns with price trading above a rising 50-SMA — both signals point to trend continuation. When the Donchian breakout and a bullish SMA alignment occur simultaneously, the probability of follow-through increases substantially. This setup invalidates if price closes back below the 50-SMA within the first few candles after breakout.
Can You Use Both Together?
Yes. And many experienced traders do.
The combination works because the indicators serve different purposes. Use Donchian Channels to define the structural trend and breakout level, and use Bollinger Bands to time the entry within that trend. Specifically:
- Donchian Channel signals a new N-period high breakout (structural signal)
- Price pulls back to the Bollinger middle band (20-SMA) in a healthy retracement
- Bollinger Bands compress during that pullback (mini-squeeze forms)
- Entry triggers on a Bollinger Band expansion candle in the direction of the Donchian breakout
This layered approach filters out many false breakouts. The Donchian Channel defines the trend; the Bollinger Band compression gives you a lower-risk entry point within it.
Confirmation stacks. That's the whole game.
Adjusting Parameters: Not All Settings Are Equal
Bollinger Band Settings
The default 20-period, 2 standard deviation setting works well for swing trading on daily charts. Shorter periods (10-15) make bands more reactive and generate more signals — useful for intraday trading but noisy on daily charts. Wider bands (2.5 SD) reduce false signals but push entry further from price. For strategy-specific optimization, the principle of matching indicator period to your holding timeframe applies directly to Bollinger Bands as well.
Donchian Channel Settings
The classic turtle trading system used 20 periods for entry and 10 periods for exit. In 2026 markets, 20-period channels remain the standard for daily charts. Wider channels (55 periods) reduce trade frequency but catch only the most significant breakouts — appropriate for position trading and lower-turnover portfolios.
Shorter Donchian settings (10 periods) on intraday charts can be used as micro-breakout filters, though noise increases substantially.
Stocks365 Research: Bollinger Band Upper Touch Performance
Stocks365 research across 3,255 upper band touch signals found a 49.6% win rate with a profit factor of 0.88 over a 10-day holding period — below breakeven without additional filters. Crypto again outperformed at 56.7% while commodities lagged at 41.5%. See the full dataset at Stocks365 Insights.
The takeaway is direct: Bollinger upper band touches alone are not a tradeable edge. They become valuable when combined with momentum divergence, volume contraction, or regime filters that identify genuine mean-reversion environments versus trend continuations.
What to Watch For
- Bollinger squeeze setups in crypto: When Bollinger Band width drops below the 20th percentile of its 6-month range on a major crypto asset, watch for the expansion candle closely. The first breakout candle with volume above the 20-period average often initiates a 2-3 ATR directional move.
- Donchian breakouts aligned with 50-SMA slope: On daily charts, when price breaks above the 20-period Donchian upper channel while the 50-SMA is sloping upward, the probability of follow-through increases. Enter on the close, stop below the pre-breakout consolidation low.
- Bollinger Band mean reversion after RSI divergence: When price tags the Bollinger upper band but RSI prints a lower high versus the prior band touch — classic bearish RSI divergence — the mean reversion to the middle band is far more reliable than a band touch without divergence.
- Donchian channel contraction before earnings: When a stock's Donchian channel width narrows to a multi-month low in the week before a catalyst event, the post-catalyst move frequently establishes a new 20-period high or low. The direction isn't predictable, but the magnitude often is.
- Double confirmation breakouts: Watch for setups where price simultaneously breaks the Donchian upper channel AND closes above the Bollinger upper band on expanding volume. This dual breakout signal — both a raw price-range breakout and a statistical volatility expansion — has stronger momentum follow-through than either signal alone.
How Stocks365 Uses This
How Stocks365 Integrates Bollinger Bands and Donchian ChannelsThe Stocks365 trust score system incorporates over 12 technical indicators, and both Bollinger Bands and Donchian Channels contribute meaningfully to that framework.
Bollinger Band signals — including squeeze breakouts, upper/lower band touches, and band width percentile — feed directly into the volatility regime scoring layer of the trust score. When band width is in the lowest quartile of its historical range, the system flags a volatility compression regime, which adjusts signal weighting for mean reversion setups versus breakout setups accordingly.
Donchian Channel breakouts contribute to the trend agreement scoring layer. A 20-period Donchian breakout across multiple timeframes that aligns with the broader trend direction increases the trust score for momentum-based signals on that instrument.
You can see these signals in action on any stock's signal page — for example, the AAPL signal page shows real-time Bollinger and channel-based signals weighted within the trust score. The Stocks365 dashboard surfaces the highest-conviction setups where multiple indicators, including channel indicators, agree on direction.
Key Takeaways
Bollinger Bands vs Donchian Channels: Summary
- Bollinger Bands use standard deviation to create volatility-adaptive bands — best for mean reversion, squeeze detection, and ranging markets.
- Donchian Channels use raw high-low range to define price boundaries — best for trend following, systematic breakout strategies, and momentum confirmation.
- Bollinger Band upper touches alone carry a sub-breakeven profit factor (0.88) — they require confluence with momentum divergence or volume to produce edge.
- Bollinger squeeze breakouts show a 1.03 profit factor across 14,266 signals — marginal positive edge, significantly better in crypto (51.8% win rate).
- The most powerful setups combine both: Donchian Channels define the structural trend, Bollinger Bands time the entry.
- Always confirm channel signals with a momentum oscillator like RSI — band touches without momentum confirmation are noise.
- Match your indicator choice to your strategy: mean reversion traders use Bollinger Bands; trend followers use Donchian Channels.