
Why Most Traders Use Bollinger Bands Wrong
Bollinger Bands are on nearly every trading platform. They look intuitive. Price touches the upper band — sell. Price touches the lower band — buy. Simple, right?
Wrong. That logic loses money.
The reality is that Bollinger Bands are a volatility and statistical tool, not a price target system. Treating the bands as hard support and resistance is one of the most expensive Bollinger Bands mistakes a trader can make — and it's just the beginning. This guide covers the full list of errors, what the data actually shows, and how to use these bands the right way.
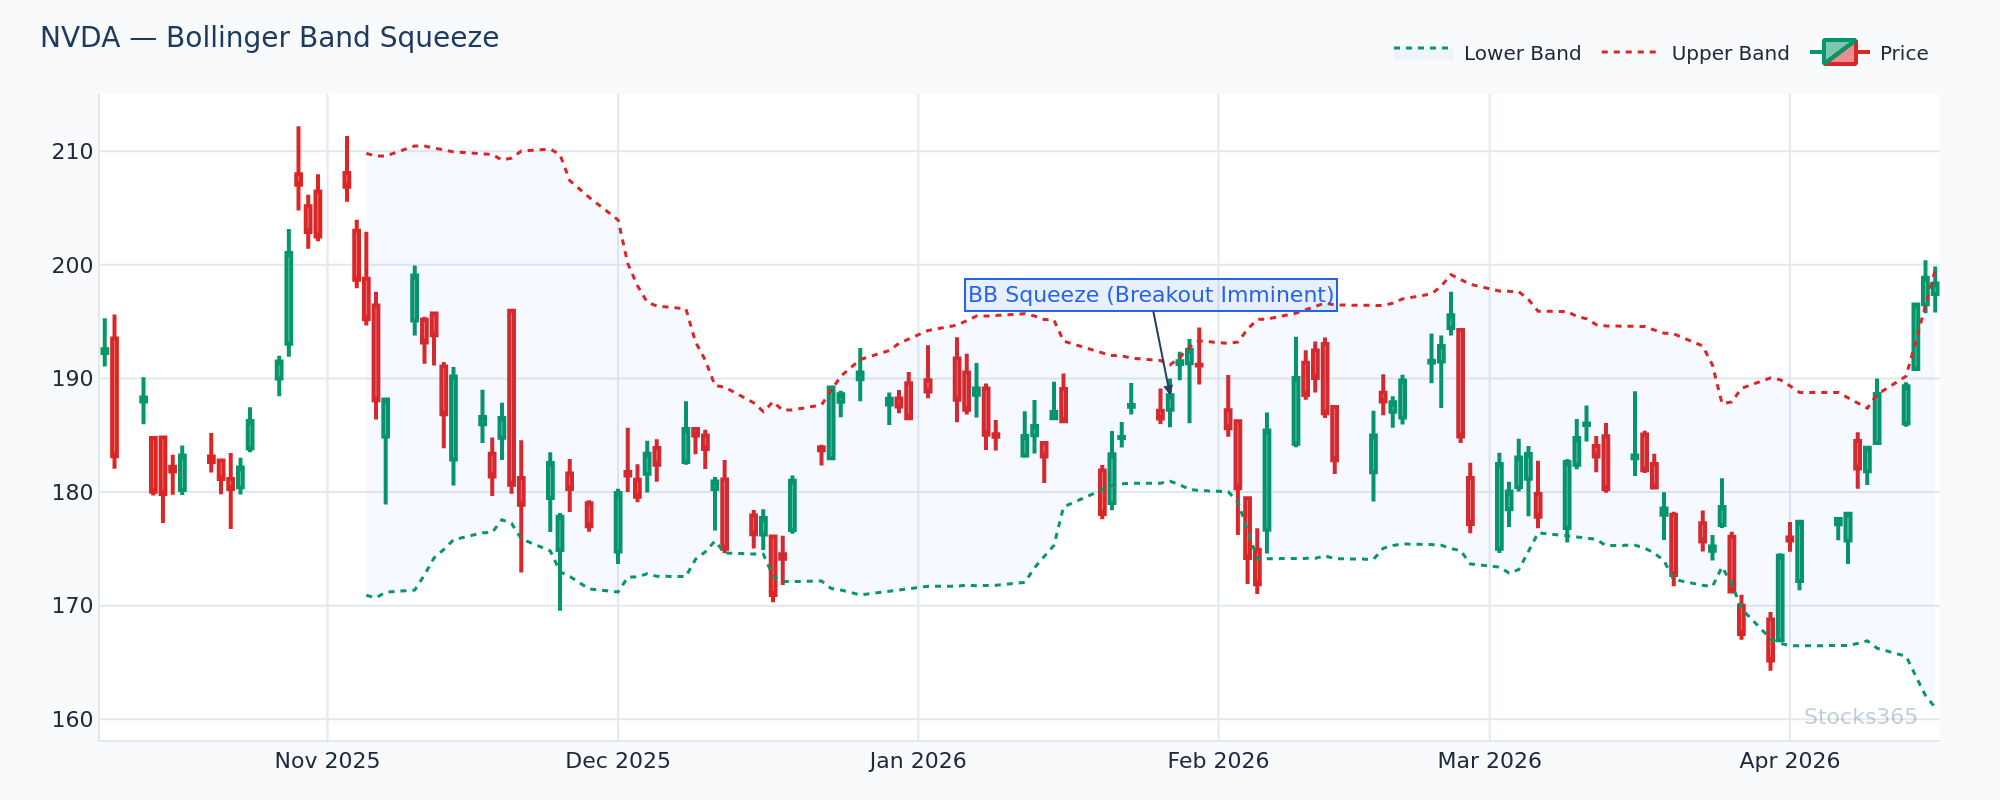
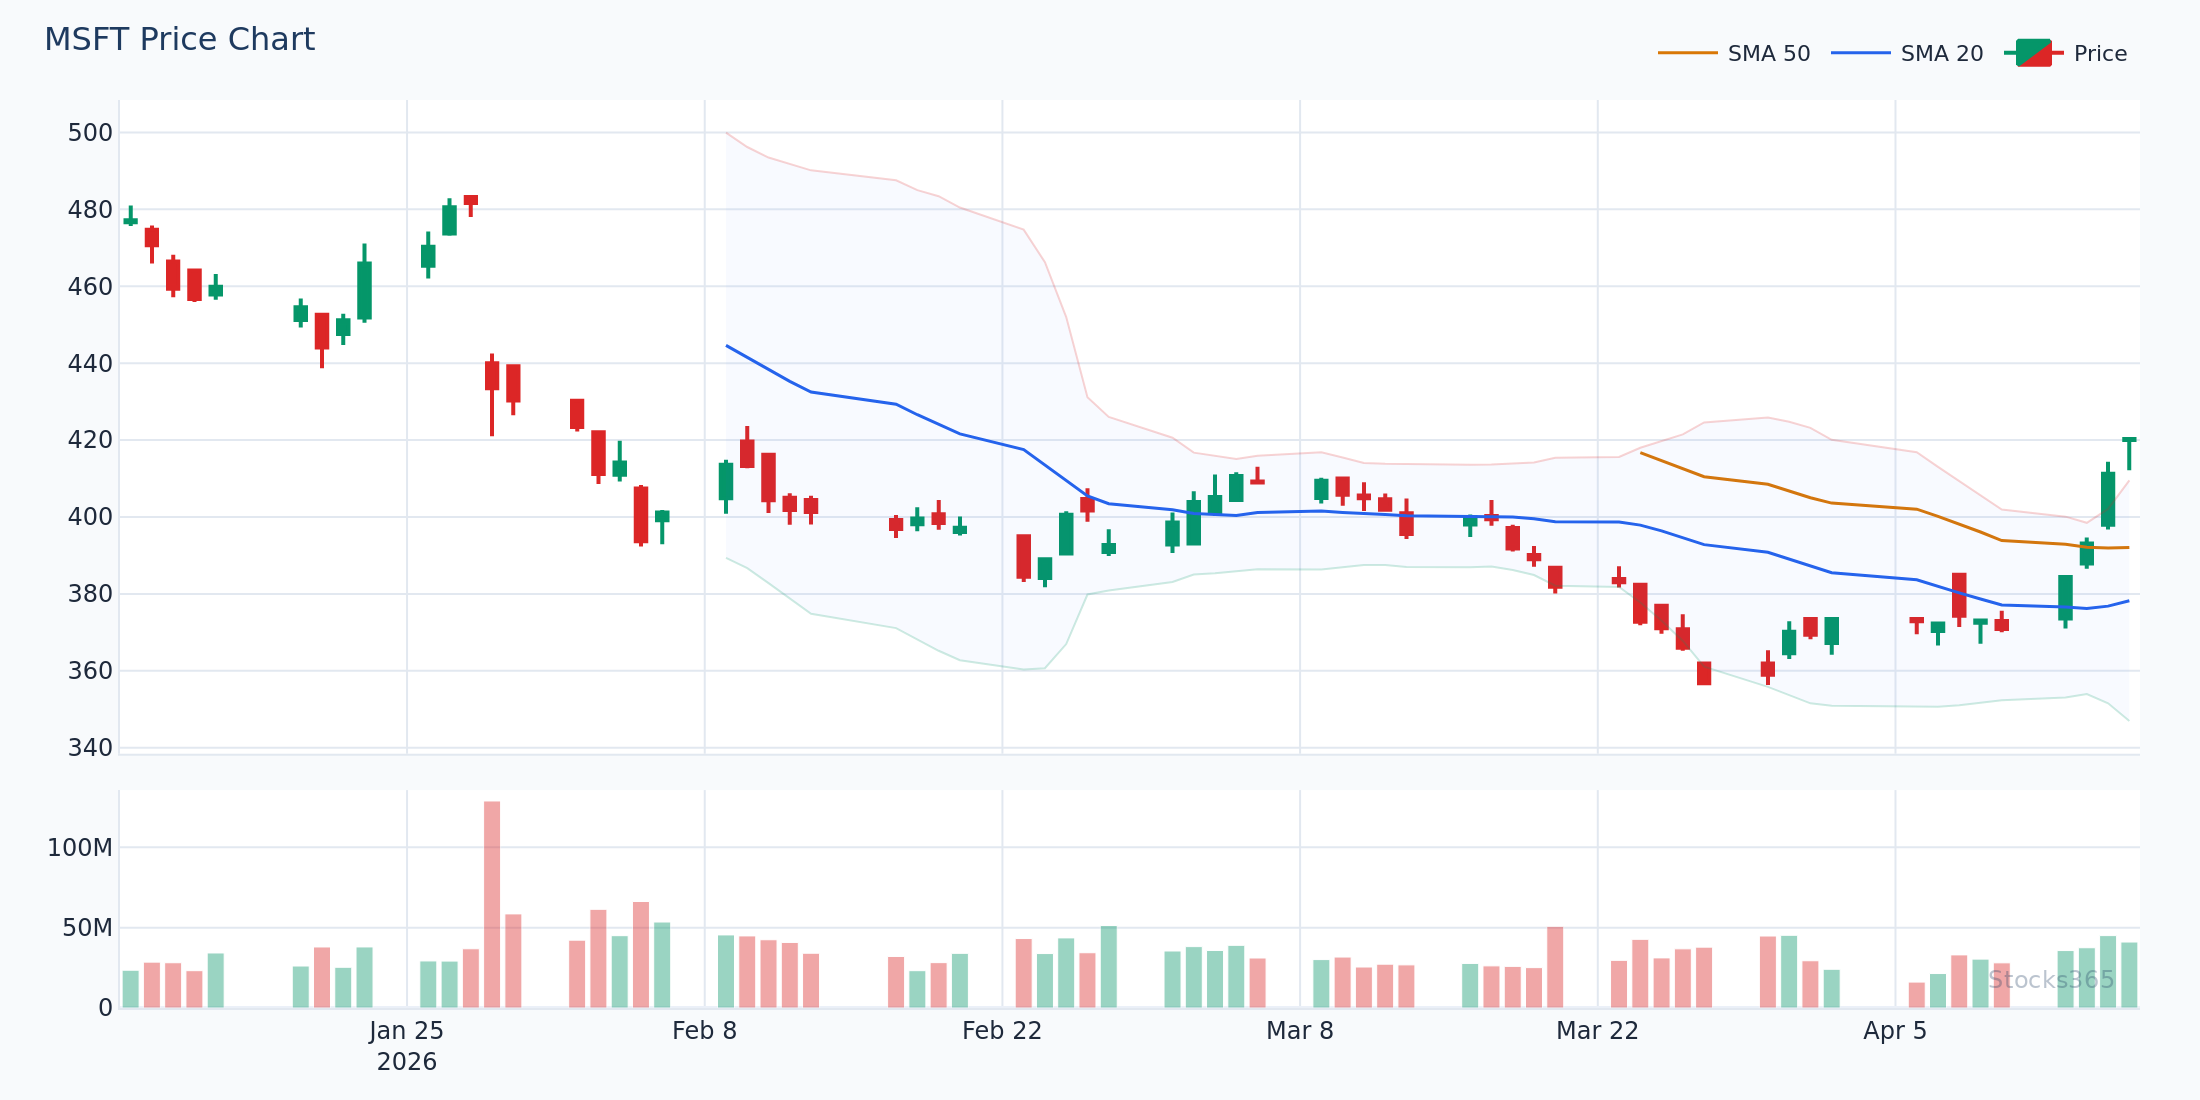
This chart shows a Bollinger squeeze forming as band width narrows to a multi-week low. Historically, these compressions precede sharp directional moves. Watch volume confirmation on the initial breakout candle — a surge above average volume strengthens the case. If price breaks out and immediately reverses back inside the bands, treat the breakout as failed and reassess.
Mistake #1: Treating Band Touches as Automatic Buy or Sell Signals
This is the most common Bollinger Bands mistake. A price touch of the upper band does not mean price is overextended and ready to reverse. In a strong trend, price can walk the upper band for days — sometimes weeks — without ever pulling back significantly.
Here's what most traders get wrong: they assume the bands define a price ceiling and floor. They don't. The bands define where price is statistically relative to recent volatility. In a trending market, that statistical edge keeps shifting in one direction. Selling every upper band touch during a breakout trend is a fast way to miss the biggest moves of the year.
The edge is watching how price reacts at the band — not just that it reached it. A price candle that touches the upper band and immediately closes well below the midline is a far stronger reversal signal than a touch followed by a tight inside bar.
What to Look for Instead
- A close back inside the band after a brief penetration — not just a touch
- Volume declining as price reaches the band (fading conviction)
- Divergence from a momentum indicator like RSI at the same time — see RSI Divergence Explained: Master Bullish & Bearish Signals for how to layer these signals
Mistake #2: Ignoring the Middle Band
The 20-period simple moving average — the middle band — is the most underused part of the Bollinger Band system. Most traders fixate on the outer bands and completely ignore what the midline is doing.
The middle band acts as a dynamic trend filter. In an uptrend, price tends to bounce off the 20-SMA and continue higher. In a downtrend, it acts as resistance. If you're only watching the outer bands, you're reading half the chart.
Use the middle band to define your bias. Price above the 20-SMA? Look for long setups. Price below? Look for shorts. It sounds straightforward — because it is. But traders skip this step constantly.
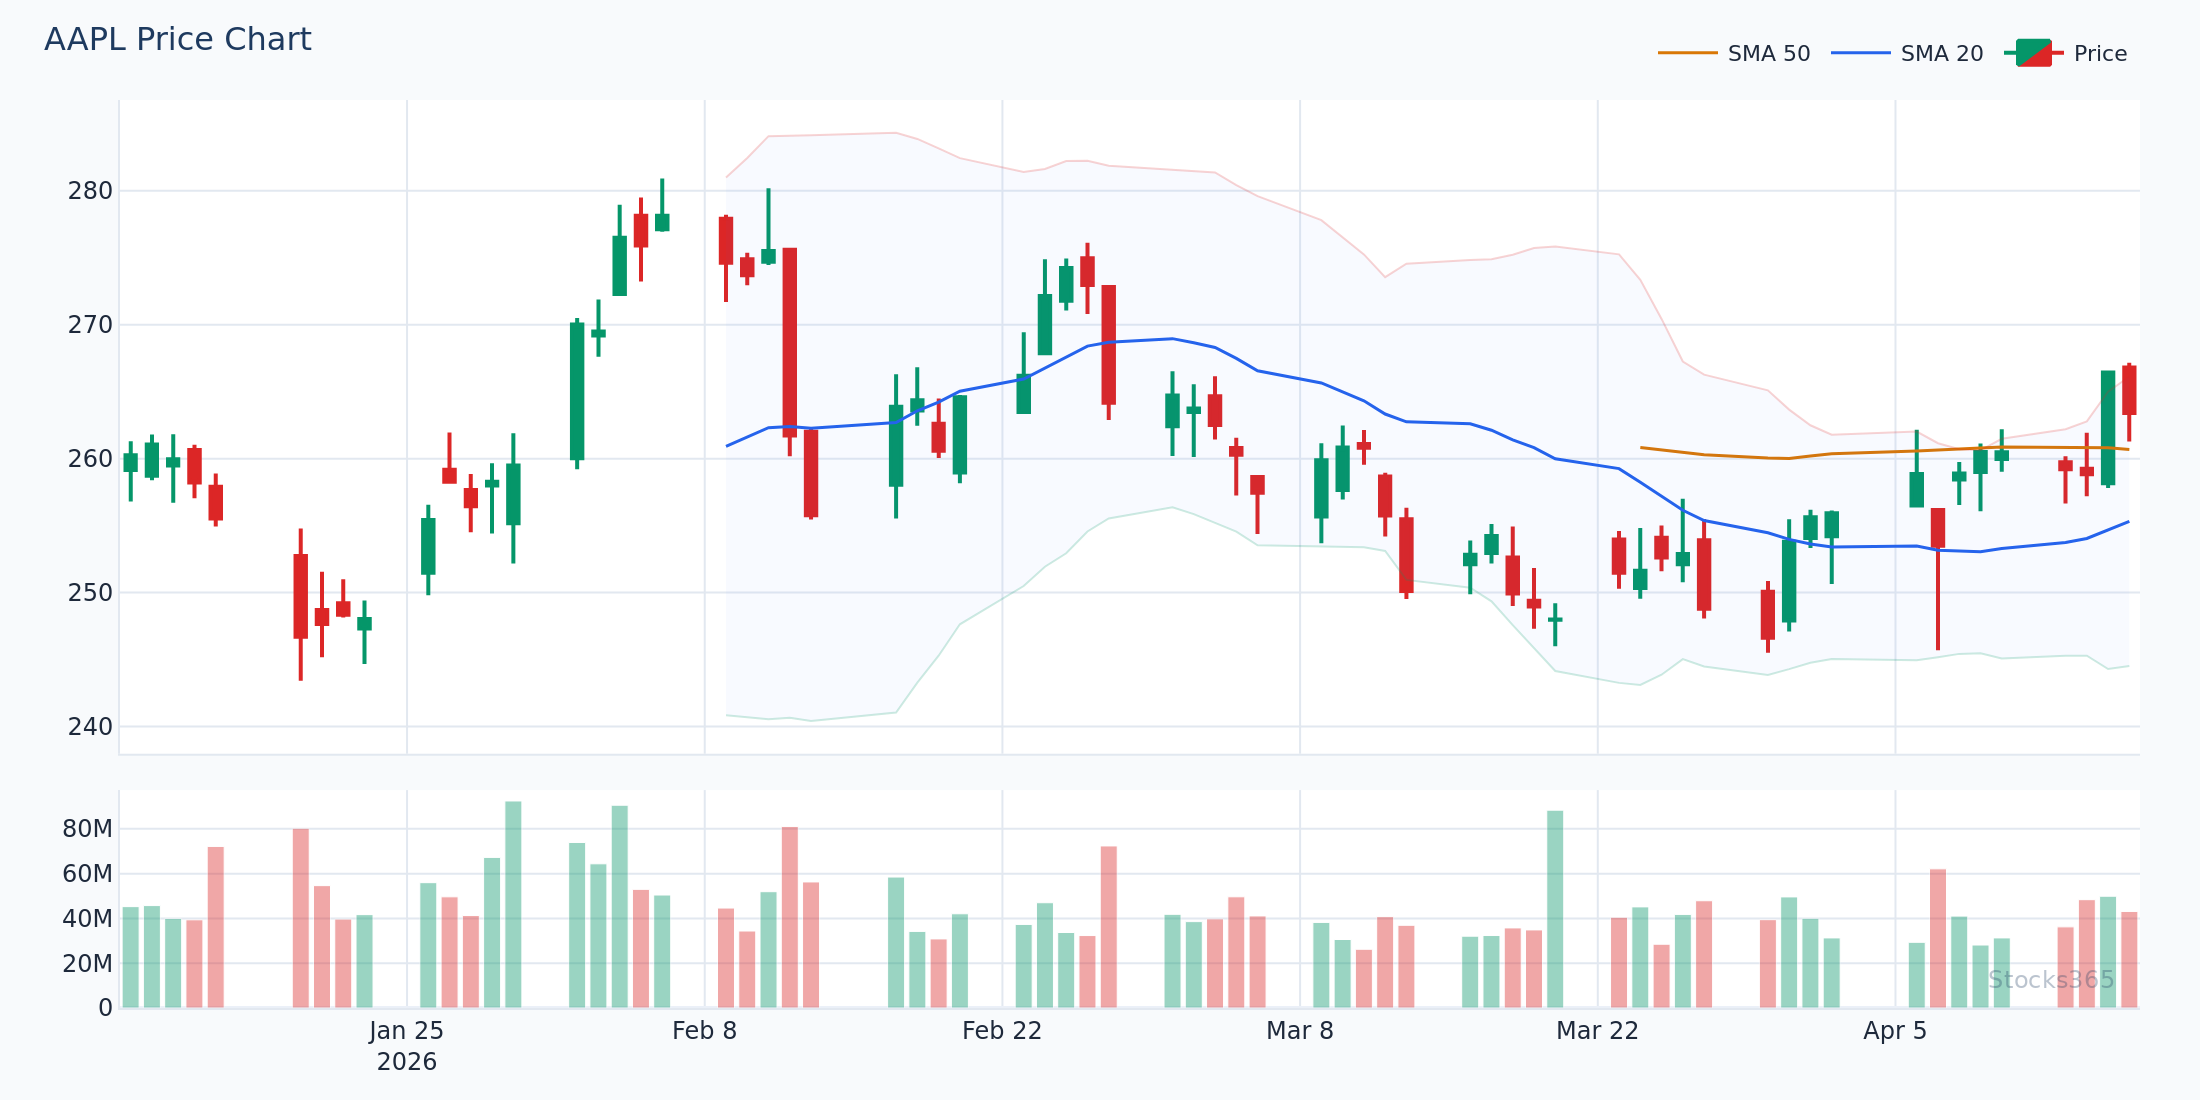
In this setup, price pulls back to the 20-SMA (middle Bollinger band) after an extended move higher, with the outer bands still pointing upward. This is a textbook continuation setup. Confirmation comes from a bullish engulfing or close back above the midline on above-average volume. A daily close below the lower band invalidates the uptrend thesis.
Mistake #3: Misreading the Bollinger Squeeze
The Bollinger squeeze — when the bands compress to unusually tight levels — signals that a big move is coming. What it does not tell you is which direction that move will be.
Traders make the mistake of entering a position during the squeeze, before direction is confirmed. This is a coin-flip trade with no edge. The squeeze identifies energy buildup. The breakout direction tells you where to go.
Our analysis of 14,266 Bollinger Squeeze Breakout signals found a profit factor of 1.03 — marginal positive expectancy overall, but with a notable split: crypto led with a 51.8% win rate, while forex trailed at 47.1%. The edge exists, but it's asset-class specific and requires proper confirmation. See the full breakdown at Stocks365 Insights.
How to Trade the Squeeze Correctly
- Wait for a candle to close outside the band in one direction before committing
- Use volume to validate — a breakout on low volume is suspect
- Set your invalidation level at the opposite band or the midline, depending on your holding period
- Avoid trading squeezes into major earnings or macro events without adjusting position size
Mistake #4: Using Default Settings Without Understanding Them
The standard Bollinger Band setup — 20-period SMA, 2 standard deviations — works reasonably well for daily charts on liquid equities. But applying those same settings to a 5-minute crypto chart or a slow-moving commodity produces misleading signals.
Different assets and timeframes have different volatility profiles. A 2-standard-deviation band on a high-beta growth stock captures roughly 95% of price action under normal conditions. On a low-volatility commodity, you may need to drop to 1.5 standard deviations to get meaningful signals. On an ultra-volatile crypto pair, 2.5 may be more appropriate.
Customizing your settings isn't optional — it's essential. This is the same logic that applies to RSI period selection. For a deeper look at how period settings affect signal quality, check out RSI Settings: Master the Best Period for Your Strategy.
Mistake #5: Using Bollinger Bands in Isolation
Bollinger Bands alone are not a trading system. They're one component. Traders who rely entirely on band touches or squeezes without confirming signals from momentum, volume, or trend direction are working with incomplete information.
Stocks365 research across 3,026 signals found that combining Bollinger Bands with a Stochastic double-overbought reading produced a 49.9% win rate — essentially a coin flip without further filtering. Yet the best-performing asset class in that dataset, crypto, hit 58.0%, while commodities sat at 40.7%. That spread tells you context and asset selection matter far more than the signal in isolation. Full data lives at Stocks365 Insights.
The fix is layering. Use Bollinger Bands to assess volatility and band position. Use RSI or a momentum oscillator to confirm overbought/oversold conditions. Use volume to validate conviction. Each layer filters out weaker setups.
For a practical approach to combining RSI with Bollinger signals, start with How to Use RSI in Trading: The Ultimate Step-by-Step Guide.
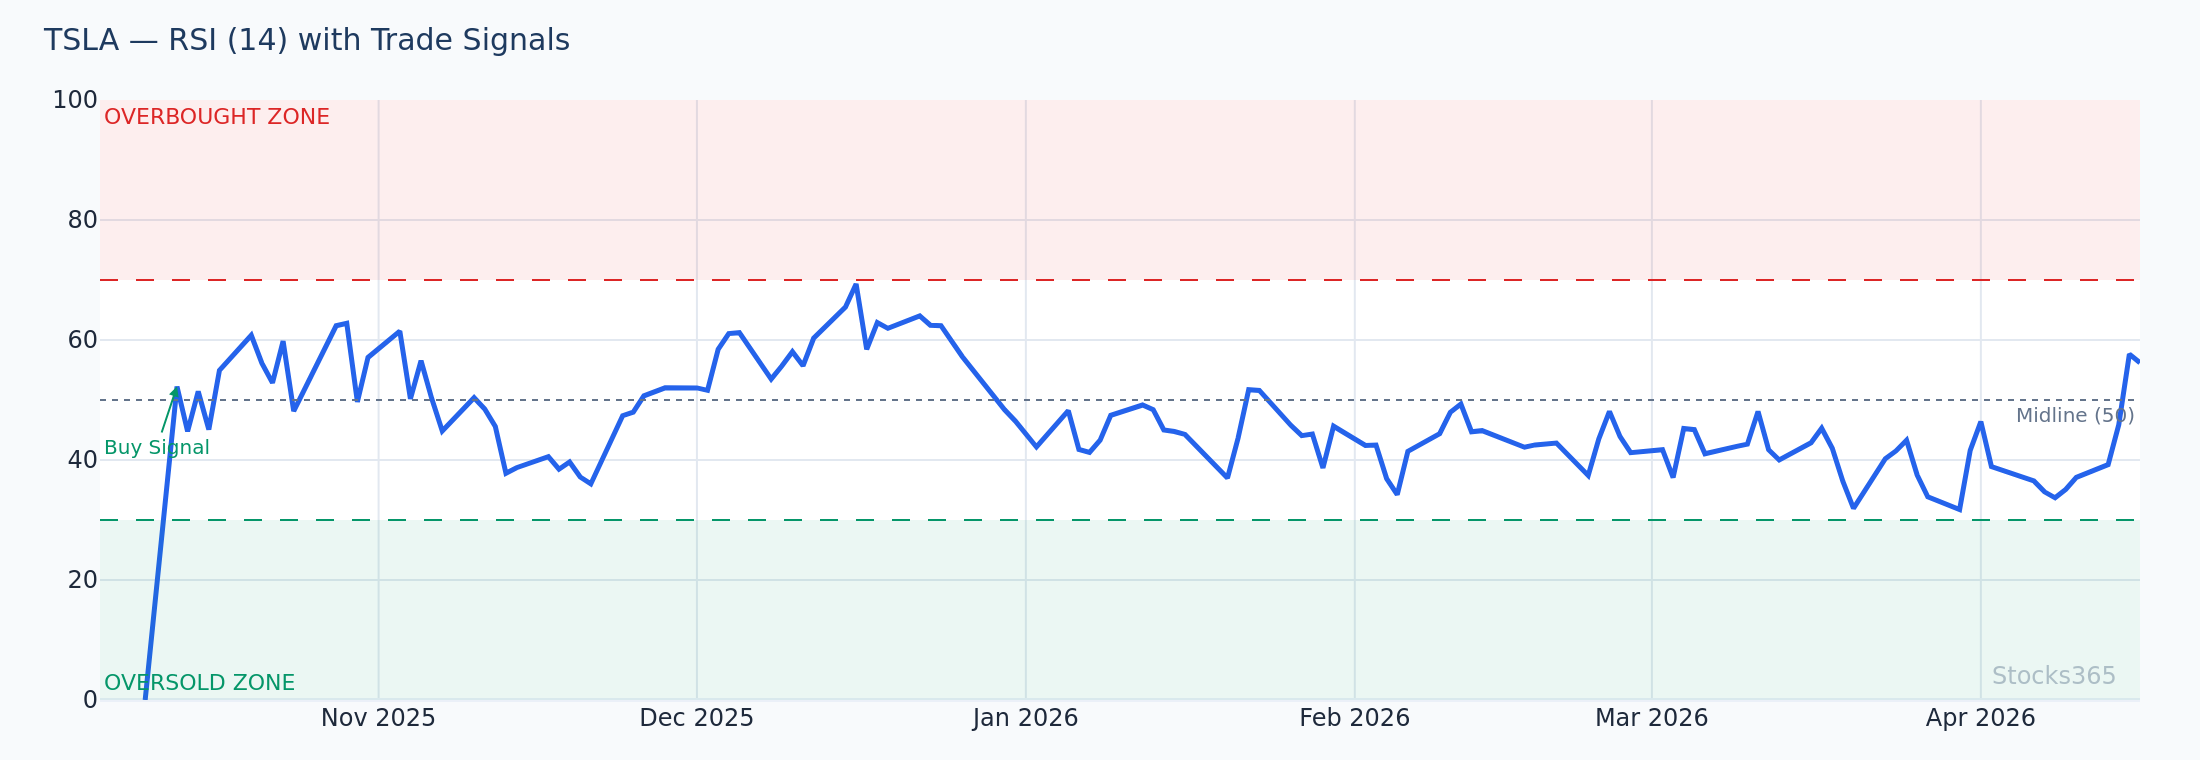
This chart shows price making a new high and touching the upper band while RSI prints a lower high — bearish divergence. This combination is significantly more reliable than either signal alone. The setup confirms when price closes back inside the band on elevated selling volume. A move back above the prior RSI high would invalidate the divergence reading.
Mistake #6: Confusing Band Width With Trend Strength
Expanding bands mean volatility is increasing. That's it. They don't confirm trend direction or strength on their own.
Traders often see expanding bands during a strong uptrend and assume the trend is accelerating in a sustainable way. Sometimes it is. Sometimes expanding bands during a sharp rally signal a blow-off move about to exhaust itself. Context — the direction of the move, the timeframe, recent structure — determines the read.
Similarly, contracting bands don't mean a trend is dying. They often precede the most explosive trend initiations. The squeeze is setup. The breakout is signal.
Mistake #7: Chasing Price After a Band Penetration
Price gaps through the upper band on news. Momentum traders pile in. By the time the retail crowd enters, the move is exhausted and price snaps back inside the bands.
This is a pattern that repeats constantly, especially on earnings gaps and macro announcements. A band penetration on a news event often reflects a one-time volatility spike, not a new trend. Chasing that move without waiting for a pullback and re-test of the breakout level is one of the most emotionally driven Bollinger Bands mistakes traders make.
Wait for the dust to settle. Let price establish a new base. Then look for the continuation setup.
Price gaps above the upper band on a high-volume catalyst, then consolidates below the band for several sessions before re-testing it as support. This re-test, when it holds on lower volatility, is the higher-probability entry — not the initial gap. Failure to hold the band on the re-test signals the gap was unsustainable and a deeper pullback to the midline is likely.
Mistake #8: Ignoring the Regime
Bollinger Bands behave differently in trending markets versus ranging markets. In a trend, price consistently touches one band and avoids the other. In a range, price oscillates between both bands with the middle band acting as the pivot.
Traders who apply the same rules across all regimes will be wrong half the time. Identify the regime first. If price has been trending above the 20-SMA for multiple weeks, treat lower band touches as buying opportunities, not reversal signals. If price is chopping between two levels with no directional bias, the band-to-band oscillation strategy makes more sense.
Regime awareness is fundamental. Without it, you're using the right tool the wrong way.
What to Watch For
- Bollinger squeeze breakouts on technology stocks: When band width drops below the 20th percentile of its recent range, the subsequent expansion frequently produces a 2–3 ATR move. Wait for the directional candle close outside the band before entering.
- Upper band walks on crypto during risk-on regimes: In strong trending crypto environments, price can ride the upper band for 5–10 sessions. Look for the first daily close below the 20-SMA as the exit signal rather than fighting the trend at each band touch.
- RSI divergence at the outer bands: When price reaches the upper or lower band while RSI prints a diverging high or low, the probability of a meaningful reversal increases substantially. Use Hidden RSI Divergence techniques to catch earlier signals in these setups.
- Midline rejection in downtrends: In a confirmed downtrend, price rallying back to the 20-SMA (middle band) and failing to close above it is a high-quality short setup. Volume declining on the rally into the midline confirms fading buying pressure.
- Post-squeeze directional confirmation: After a squeeze, if the initial breakout candle closes back inside the bands within 1–2 sessions, the breakout has failed. The next move typically tests the opposite band — a pattern worth tracking on your watchlist.
How Stocks365 Uses This
📊 How Stocks365 Integrates Bollinger Bands
Stocks365 incorporates Bollinger Band analysis as one of 12+ indicators that contribute to its proprietary trust score system. Band position and squeeze conditions feed directly into the platform's volatility regime scoring — helping classify whether a signal is occurring in a low-volatility setup (higher breakout potential) or an already-extended environment (higher reversal risk).
When Bollinger signals align with momentum confirmation from RSI and volume agreement, the trust score reflects higher signal confidence. A Bollinger squeeze breakout that also triggers positive momentum agreement will score materially higher than a band touch with no supporting confirmation. This multi-indicator agreement model is what separates high-probability setups from noise.
You can explore live signals incorporating these models on the Stocks365 signals dashboard, or drill into individual stock signals like AAPL's signal page to see how band conditions are currently scored.
Key Takeaways
✅ Key Takeaways: Avoiding Bollinger Bands Mistakes
- Band touches are not automatic buy or sell signals — confirm with price action and volume
- The middle band (20-SMA) is a critical trend filter most traders ignore entirely
- A Bollinger squeeze signals energy buildup — not direction. Wait for the confirmed breakout
- Default settings don't fit all assets or timeframes — calibrate to your specific instrument
- Bollinger Bands work best when combined with momentum indicators like RSI, not used in isolation
- Regime identification (trending vs. ranging) must come before applying any band-based strategy
- Chasing band penetrations on news events is one of the most repeated and costly errors in this strategy
Frequently Asked Questions
Are Bollinger Bands reliable for day trading?
They can be, but the settings and asset matter significantly. On lower timeframes, band signals generate more false positives due to noise. Day traders using Bollinger Bands typically adjust the period and standard deviation settings for the specific instrument and timeframe, and always layer in volume and momentum confirmation before acting on a signal.
What's the best indicator to combine with Bollinger Bands?
RSI is the most common and practical pairing. When Bollinger Bands show a price at the upper band and RSI shows divergence or an overbought reading breaking down, the combined signal is substantially more reliable than either alone. For a full breakdown of RSI mechanics and application, see What Is RSI? The Complete Beginner's Guide and RSI Overbought and Oversold Levels: Master the Signals.
How do I know if I'm in a Bollinger squeeze?
A Bollinger squeeze occurs when band width — the distance between the upper and lower bands — compresses to unusually low levels relative to recent history. Many platforms display band width as a separate indicator. A common rule of thumb is to look for band width at or below the 20th percentile of its 6-month range. The lower the width relative to recent history, the more energy the potential breakout carries.
Why do Bollinger Bands expand during a strong trend?
The bands use standard deviation, which expands when price moves sharply in one direction. A strong, sustained trend creates larger candles and wider swings, which increases the statistical spread of recent closes — causing the bands to widen. Expanding bands during a trend simply mean volatility is elevated, not that the trend is ending.
Do Bollinger Bands work the same on crypto as on stocks?
Not exactly. Crypto markets are structurally more volatile and trade 24/7, which changes the character of band signals. Squeezes on crypto tend to produce larger moves, and upper band walks in bull markets can persist longer than on equities. The data supports this: squeeze breakouts showed a 51.8% win rate on crypto versus 47.1% on forex in Stocks365's signal database — a meaningful difference worth accounting for in your setup criteria.