
How Do Bollinger Bands Work? A Complete Mathematical Guide
Few technical indicators have stood the test of time like Bollinger Bands. Developed by legendary technical analyst John Bollinger in the 1980s, this indicator has become a cornerstone of modern trading strategy — and for good reason. Understanding how Bollinger Bands work at a mathematical level transforms them from a vague visual aid into a precision instrument for reading market volatility, momentum, and price extremes.
In this guide, we break down the exact math behind Bollinger Bands, walk through real trading examples with specific price levels, and show you how to apply them alongside other technical tools — including momentum indicators like RSI — to build a more complete trading framework.
Key Insight: Bollinger Bands are not a standalone buy or sell signal. They are a dynamic volatility envelope that tells you where price is relative to its recent statistical range — and that context is everything.
The Three Components of Bollinger Bands
Before diving into the math, it helps to understand that every Bollinger Band chart is made up of exactly three lines:
- The Middle Band: A simple moving average (SMA), typically over 20 periods
- The Upper Band: The SMA plus two standard deviations
- The Lower Band: The SMA minus two standard deviations
These three lines work together to create a dynamic channel that expands during high-volatility periods and contracts during low-volatility periods. That expansion and contraction is where the real trading intelligence lives.
The Bollinger Band Formula: Step-by-Step Math
Step 1: Calculate the Simple Moving Average (Middle Band)
The middle band is simply the arithmetic mean of closing prices over n periods. With the standard 20-period setting:
Middle Band = (Sum of closing prices over 20 periods) ÷ 20
For example, if NVDA has closed at an average of $142.50 over the last 20 trading sessions, the middle band is plotted at $142.50.
Step 2: Calculate the Standard Deviation
This is where Bollinger Bands get genuinely mathematical — and genuinely powerful. Standard deviation measures how far individual prices deviate from the mean. Here's how it works:
- Calculate the mean (SMA) for the period
- Subtract the mean from each closing price in the period and square the result
- Sum all those squared differences
- Divide by the number of periods (n)
- Take the square root of that result
Standard Deviation (σ) = √[ Σ(Close - SMA)² ÷ n ]
A higher standard deviation means prices have been moving erratically — high volatility. A lower standard deviation means prices have been clustering tightly — low volatility. This is precisely why the bands widen and narrow dynamically.
Step 3: Plot the Upper and Lower Bands
Once you have the SMA and the standard deviation, the upper and lower bands are straightforward:
- Upper Band = SMA + (2 × σ)
- Lower Band = SMA - (2 × σ)
The multiplier of 2 is the default — and it's not arbitrary. Statistically, approximately 95% of price data falls within two standard deviations of the mean under a normal distribution. This means that when price touches or breaks through the upper or lower band, it's a statistically unusual event worth paying attention to.
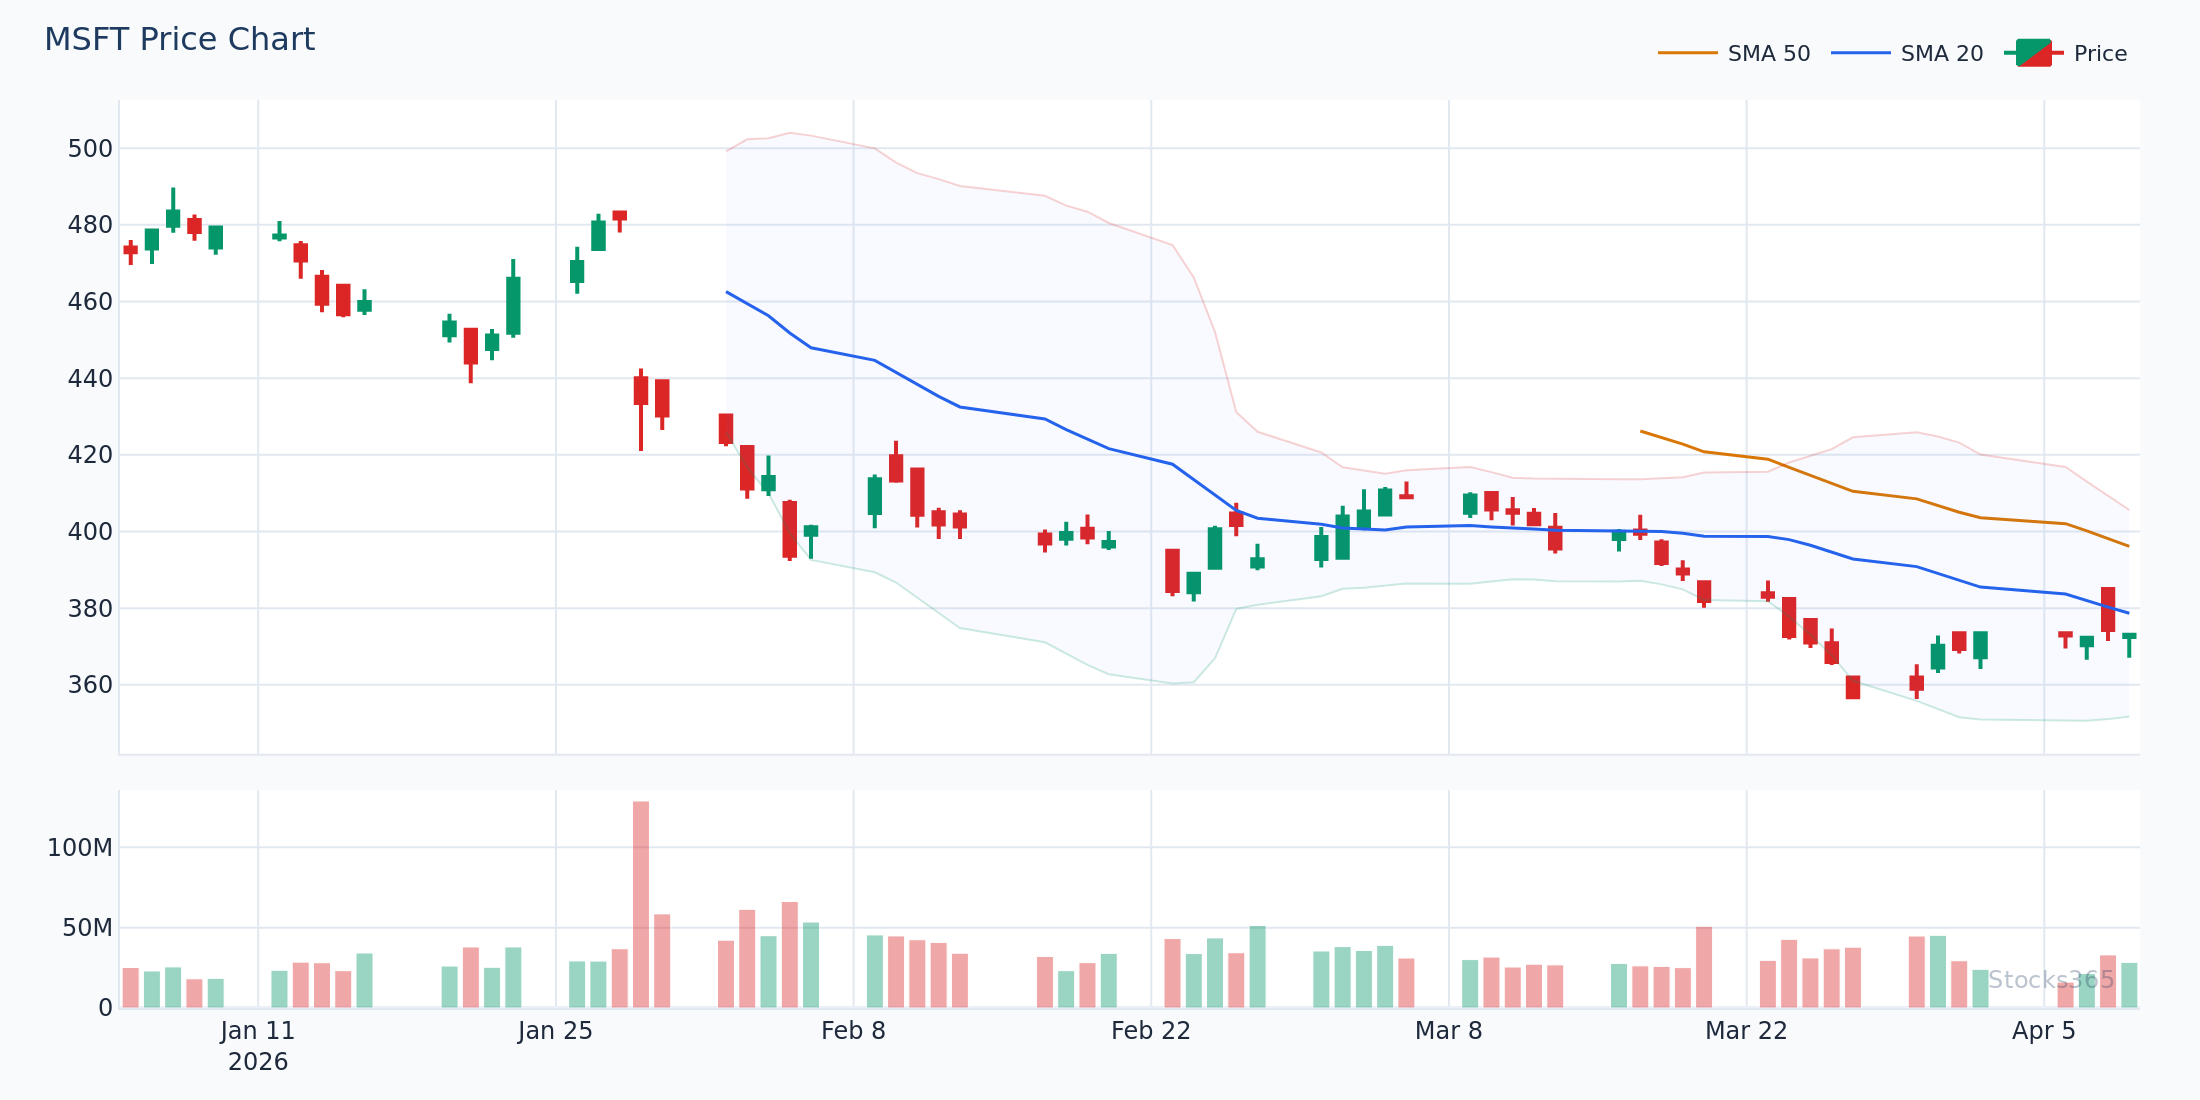
Practical Example: MSFT Bollinger Band Calculation
Imagine Microsoft (MSFT) has a 20-period SMA of $415.00. The standard deviation of closing prices over those 20 sessions is $8.50. The bands would be:
- Upper Band: $415.00 + (2 × $8.50) = $432.00
- Middle Band: $415.00
- Lower Band: $415.00 - (2 × $8.50) = $398.00
If MSFT's price pushed up to $431.50, it would be testing the upper band — statistically stretched, potentially signaling exhaustion or a reversion opportunity depending on context.
What Bollinger Band Width Tells You About Volatility
One of the most actionable aspects of how Bollinger Bands work is the concept of bandwidth — the distance between the upper and lower bands. Traders calculate this as:
Bandwidth = (Upper Band - Lower Band) ÷ Middle Band × 100
When bandwidth is historically low, it signals a squeeze — a period of compressed volatility that almost always precedes a significant directional move. When bandwidth is historically high, it indicates a volatile, trending market.
The Bollinger Band Squeeze: Reading Compressed Volatility
The squeeze is arguably the most powerful setup Bollinger Bands reveal. Here's how it plays out in practice:
- Price consolidates in a tight range — the bands visibly narrow
- The squeeze compresses energy like a coiled spring
- A breakout occurs — bands expand rapidly in the breakout direction
- Price often trends strongly in that direction before reverting
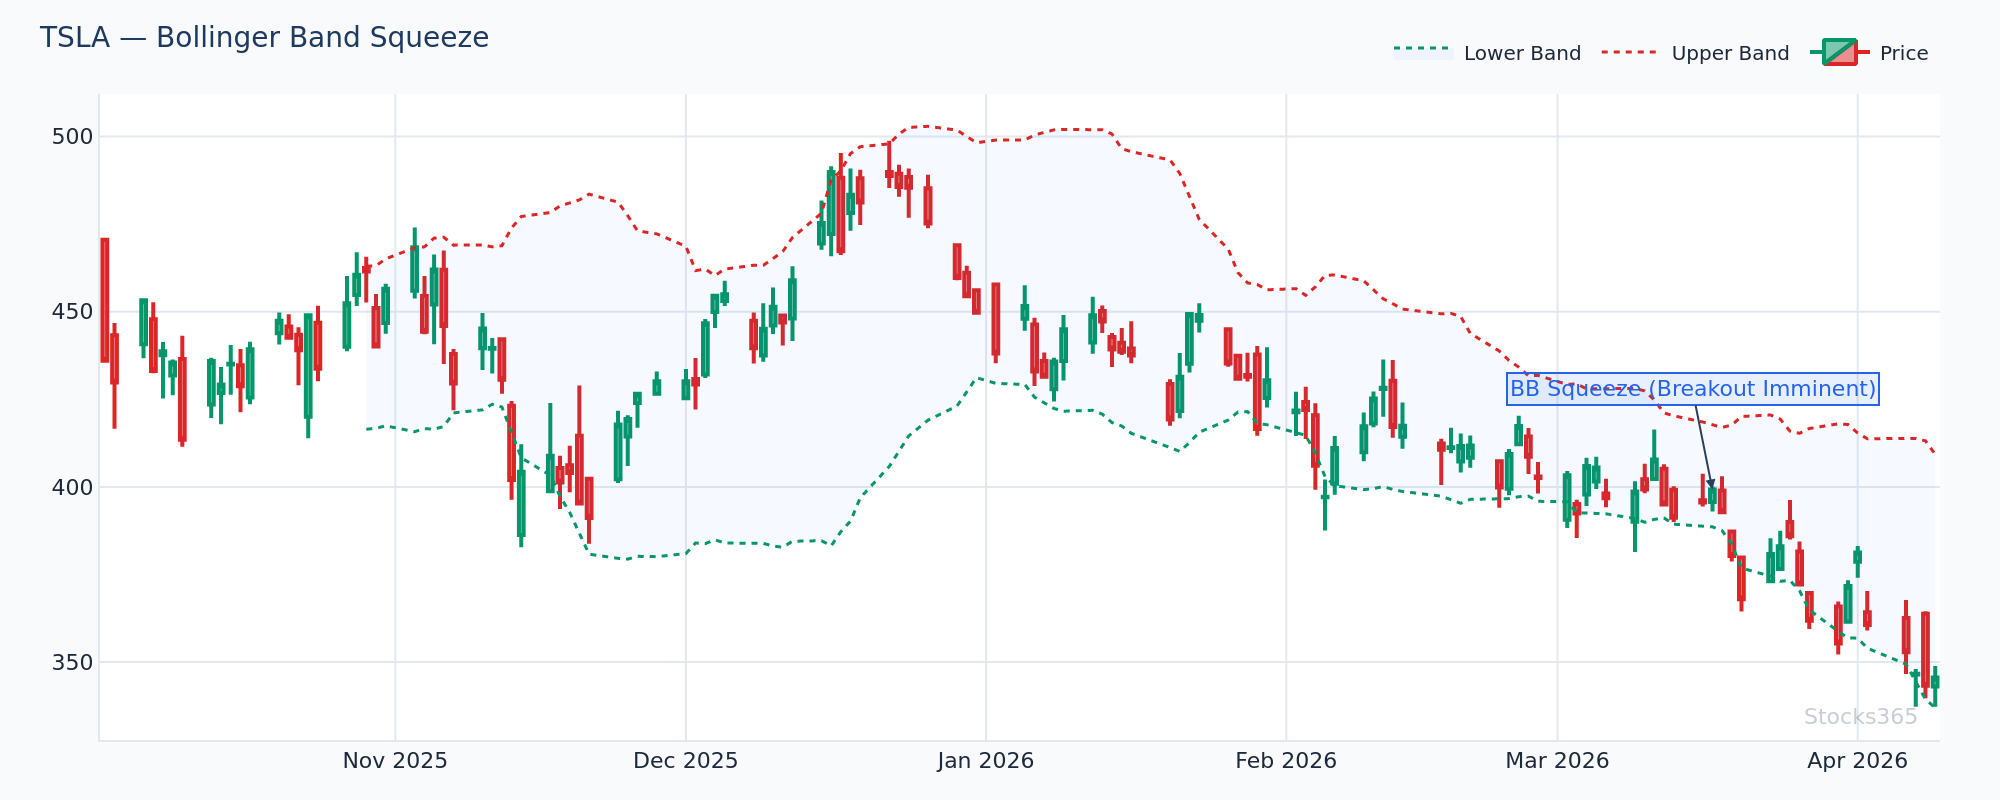
Consider a scenario where TSLA consolidates between $240 and $248 for two weeks. The Bollinger Band width drops to its lowest reading in three months. Suddenly, a catalyst — an earnings beat or a major product announcement — sends price to $268. The bands explode outward, and the squeeze has fired. This is classic Bollinger Band mechanics in action.
How Do Bollinger Bands Signal Overbought and Oversold Conditions?
Many traders use Bollinger Bands to identify when a security is statistically overextended. The logic is elegant: if ~95% of prices fall within the bands, a price outside the bands is, by definition, an outlier.
The Walk Along the Band
Here's an important nuance that trips up beginners: price touching the upper band is not automatically a sell signal. In strong uptrends, price can "walk" along the upper band for extended periods — each close near the upper band confirms bullish momentum rather than contradicting it.
The genuine reversal signals emerge when:
- Price makes a new high outside the upper band, then retreats back inside on the next candle
- A momentum indicator like RSI shows divergence at the same time (more on this below)
- A "double top" forms with the second top failing to reach the upper band while price has already touched it once
%B: Quantifying Price Position Within the Bands
John Bollinger himself created a companion indicator called %B that mathematically expresses exactly where price sits within the bands:
%B = (Price - Lower Band) ÷ (Upper Band - Lower Band)
- %B = 1.0 → price is at the upper band
- %B = 0.5 → price is at the middle band
- %B = 0.0 → price is at the lower band
- %B > 1.0 → price is above the upper band
- %B < 0.0 → price is below the lower band
This gives traders a precise, numerical read on overextension that's far more actionable than eyeballing the chart.
Combining Bollinger Bands With RSI: A Powerful Pairing
Bollinger Bands measure volatility and price position. RSI measures momentum. Used together, they address each other's blind spots in a way that makes both indicators more effective.
The classic confluence setup works like this: when price touches the lower Bollinger Band and RSI simultaneously reads below 30, both indicators are confirming an oversold condition. This dual confirmation dramatically reduces false signals compared to using either indicator alone. If you're not yet fluent in RSI mechanics, our guide on how to use RSI in trading is an excellent starting point.
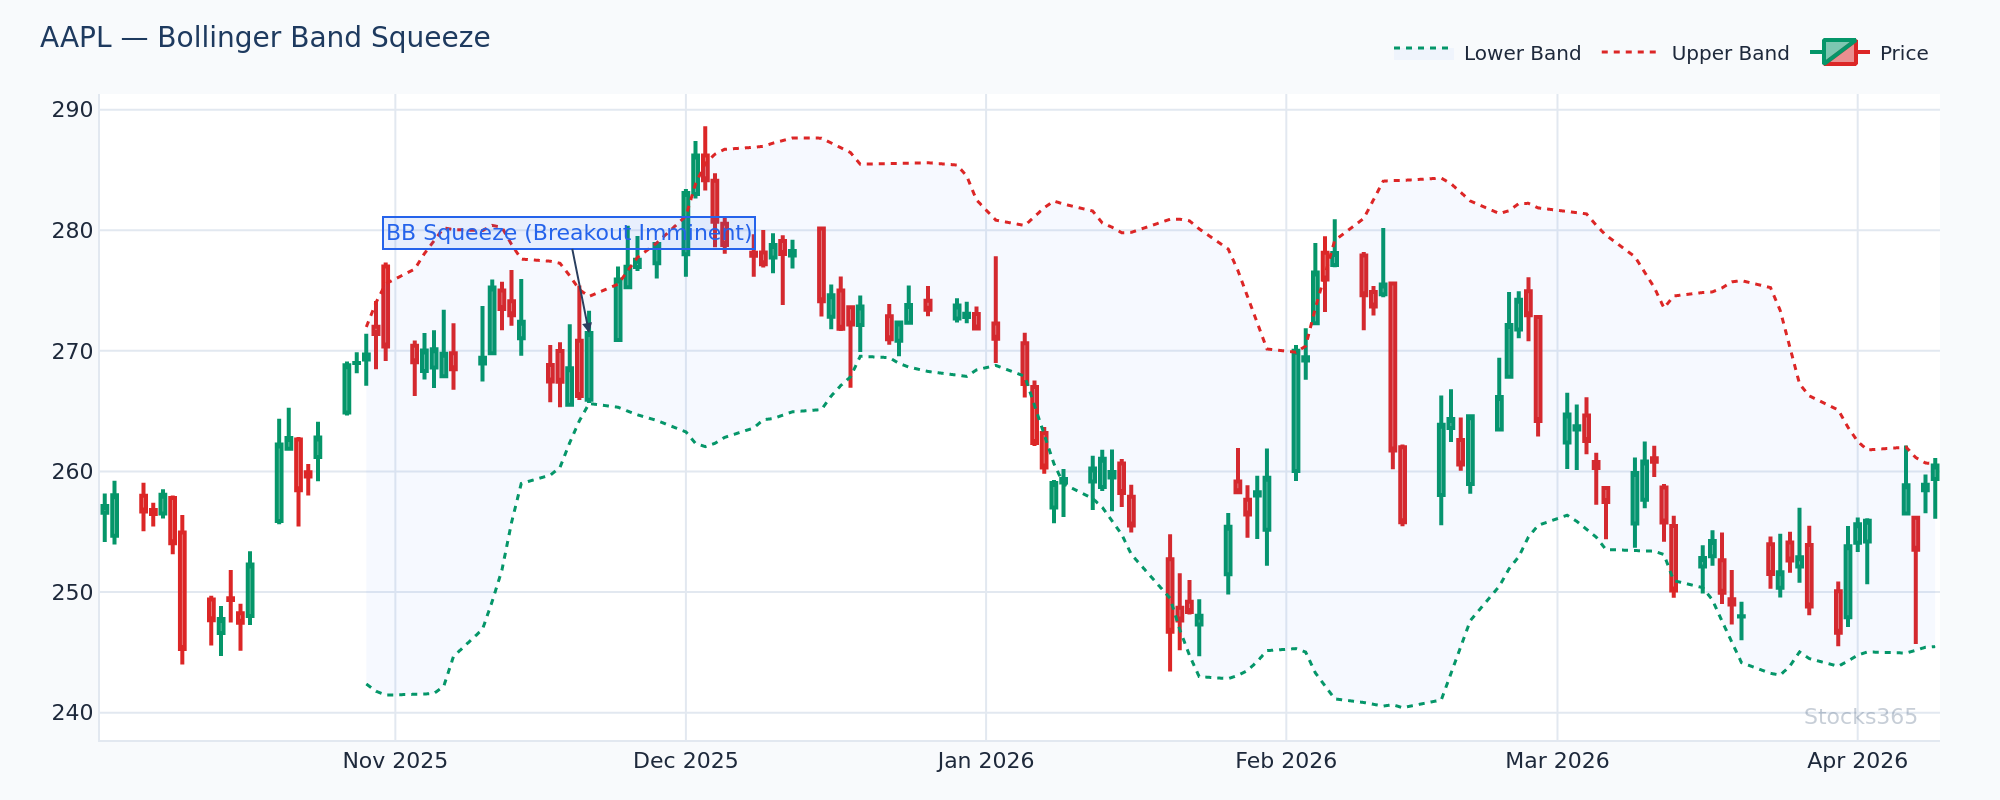
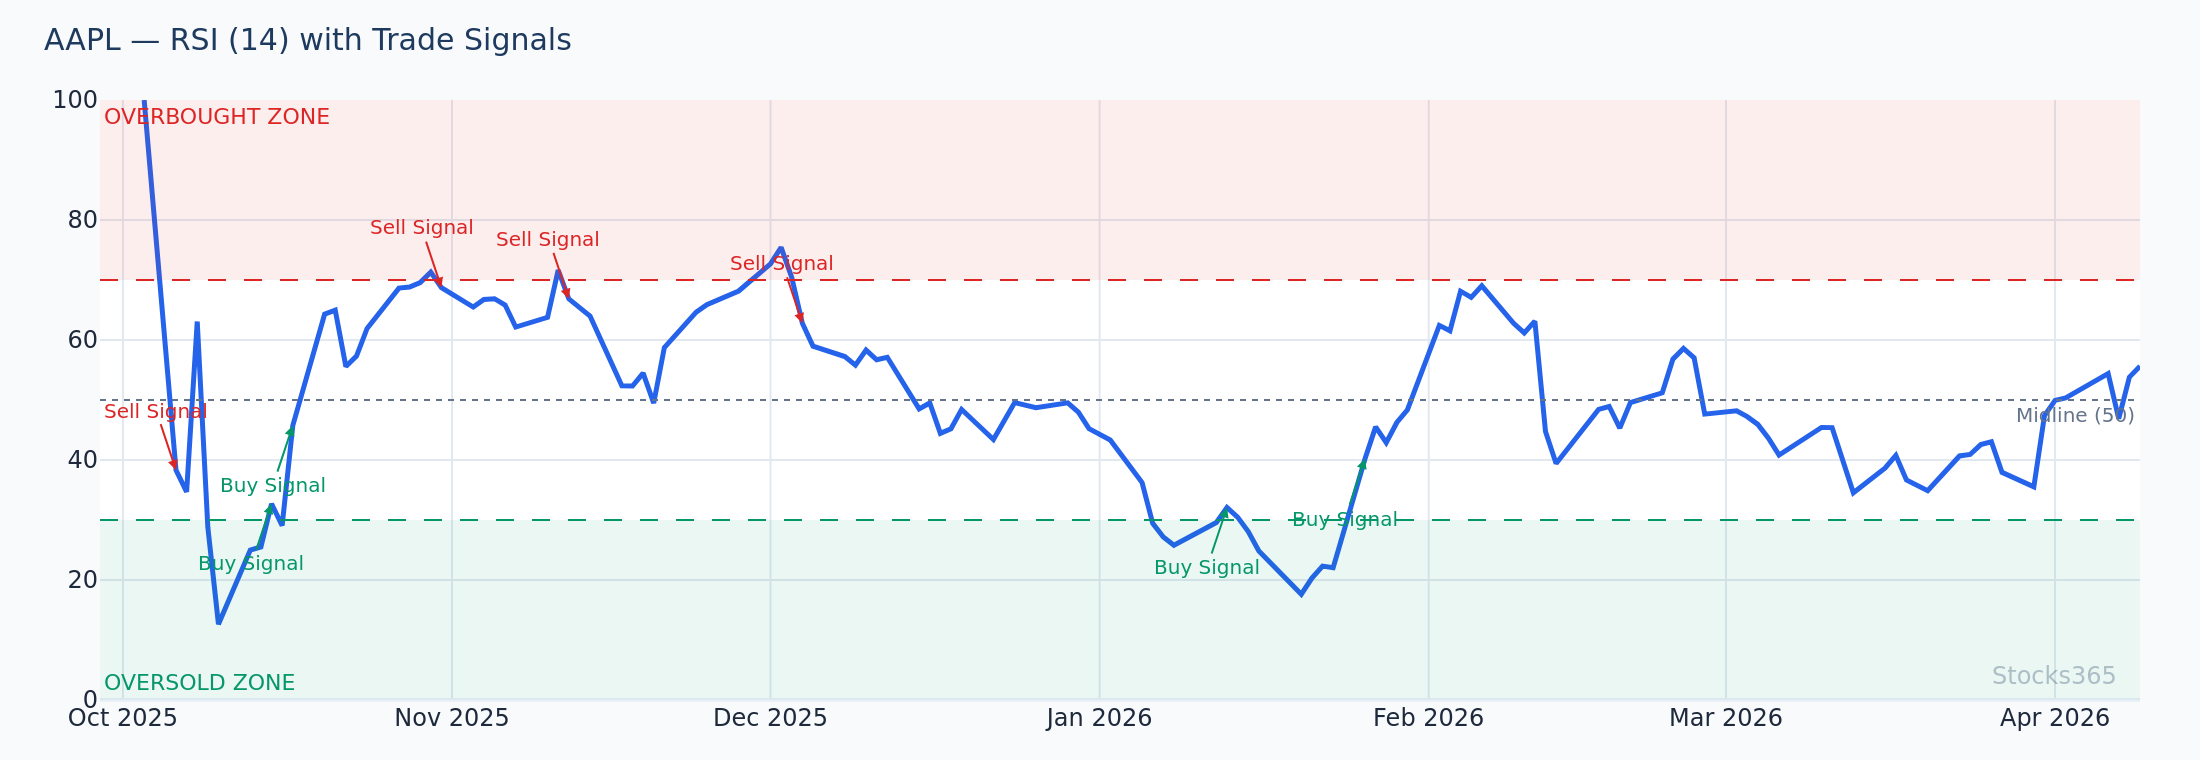
Similarly, when you combine Bollinger Band analysis with RSI divergence, the signals become even more refined. If AAPL's price prints a new high that pushes through the upper Bollinger Band, but RSI is making a lower high at the same time, that bearish RSI divergence occurring at a statistically extreme price level is a compelling reason to consider reducing long exposure. Our deep-dive on RSI divergence signals explains these setups in full detail.
For traders who want to go even deeper, hidden RSI divergence can be particularly powerful when it occurs near Bollinger Band extremes — these are the setups that most retail traders completely miss.
Adjusting Bollinger Band Settings for Different Markets
Standard Settings (20, 2)
The default 20-period, 2 standard deviation setting works well for most swing trading applications across daily charts. It strikes the right balance between responsiveness and noise reduction, keeping roughly 95% of price action within the bands.
Shorter Period Settings (10, 1.5)
Shorter lookback periods make the bands more sensitive to recent price action — useful for active day traders working on 15-minute or hourly charts. Reducing the multiplier to 1.5 compensates for the noisier signals inherent in short timeframes by keeping the bands proportionally tighter.
Longer Period Settings (50, 2.1)
Position traders and investors often extend the period to 50 sessions, slightly increasing the standard deviation multiplier. This smooths out short-term volatility and captures only the most significant band touches, which in a slower-moving portfolio context is precisely what you want.
The principle here echoes what we discuss in RSI settings optimization — there's no universal "best" setting. The optimal configuration is the one that matches your timeframe, asset class, and trading style.
Bollinger Band Trading Strategies That Work in 2026
Strategy 1: The Mean Reversion Play
In ranging, non-trending markets, price tends to revert to the middle band (the 20-period SMA) after touching the upper or lower bands. The setup:
- Price touches the lower band with a reversal candlestick pattern (hammer, engulfing candle)
- RSI is at or below 35, confirming oversold momentum
- Entry: on confirmation candle close
- Target: middle band (SMA)
- Stop: below the recent swing low
Example: GOOGL consolidates between $168 and $185. Price drops to $169.50, touching the lower band. RSI reads 32. A bullish engulfing candle forms. Entry at $172.00, target at the middle band ($177.50), stop at $167.50 gives a risk-reward ratio of approximately 1:2.1 — well within acceptable parameters.
Strategy 2: The Breakout Confirmation Trade
After a Bollinger Band squeeze, wait for directional confirmation before committing capital:
- Identify a squeeze (bandwidth at multi-month low)
- Wait for price to close decisively above or below the bands
- Confirm with volume — a volume spike adds conviction to the breakout
- Enter on the first pullback to the middle band after breakout
- Trail stop using the middle band as a dynamic support/resistance level
The Stocks365 signals dashboard monitors squeeze conditions across hundreds of securities simultaneously, alerting you to high-probability setups the moment they develop — without requiring you to manually scan charts all day.
Strategy 3: The Band Walk Trend Continuation
In strong trends, look for price walking along one band as a continuation signal rather than a reversal signal:
- Price consistently closes at or near the upper band in an uptrend
- Each pullback to the middle band holds as support
- Add to long positions on pullbacks to the middle band
- Exit when price fails to return to the upper band after a middle-band bounce
This is particularly effective with momentum-driven stocks. Check the NVDA signals page for live Bollinger Band analysis on one of the market's most consistently trending names.
Common Bollinger Band Mistakes to Avoid
- Treating band touches as automatic signals: A price touching the upper band in a strong trend is continuation, not reversal. Context is everything.
- Ignoring the middle band: The 20-period SMA is dynamic support/resistance in trending markets. Many traders focus only on the outer bands and miss the most reliable signals.
- Using Bollinger Bands alone: They measure volatility, not direction. Always pair them with a momentum indicator — RSI is the natural companion. Our guide on RSI overbought and oversold levels shows exactly how to structure this pairing.
- Ignoring the timeframe: A lower band touch on a 5-minute chart has very different implications than one on a weekly chart. Always know your timeframe and adjust interpretation accordingly.
- Chasing post-squeeze breakouts: By the time the bands have dramatically widened, much of the move is already complete. Identifying the squeeze before it fires is where the edge lives.
How Stocks365 Uses Bollinger Bands in Its Trust Score System
The Stocks365 trust score system integrates Bollinger Band analysis as one of several converging signals evaluated for each alert. When a signal fires — say, a bullish setup on AAPL — the trust score considers whether price is at a statistically significant band level, whether bandwidth conditions support the setup, and whether momentum indicators like RSI are confirming the move.
This multi-factor confirmation approach is precisely why Bollinger Bands are most powerful when used as part of a broader analytical framework rather than as a standalone indicator. For a primer on how momentum indicators complement this picture, the RSI vs Stochastic Oscillator guide explores two of the most popular momentum tools and how they differ in real trading conditions.
Key Takeaways
- Bollinger Bands consist of three lines: a 20-period SMA (middle band) plus and minus two standard deviations (upper and lower bands)
- The standard deviation calculation is what makes the bands dynamic — they automatically widen in volatile markets and narrow in quiet ones
- Approximately 95% of price data falls within the default two standard deviation bands, making band breaks statistically significant events
- The Bollinger Band squeeze — bandwidth compression to multi-period lows — is one of the most reliable precursors to major directional moves
- %B indicator quantifies exactly where price sits within the bands, providing more precision than visual inspection
- Bollinger Bands + RSI is one of the most effective indicator combinations in technical analysis — volatility context plus momentum direction
- Band touches are not automatic signals — trending markets produce band walks; mean reversion signals require additional confirmation
- Settings should match your timeframe — the 20-period, 2 standard deviation default works for most swing traders; adjust for shorter or longer time horizons