
Why Your MACD Alert Setup Could Be the Difference Between Profit and Loss
Every trader has a story about the one that got away — a clean MACD crossover on AAPL at the open, a textbook bullish signal on NVDA before a 12% move, or a histogram reversal on TSLA that triggered a perfect short entry. You saw it after the fact. The trade was already gone.
This is the core problem that a well-structured MACD alert setup solves. The Moving Average Convergence Divergence indicator is one of the most powerful momentum tools available to traders, but its value is almost entirely dependent on timing. A signal spotted hours late is not a signal — it's a regret.
In this guide, we'll walk through everything you need to build a professional-grade MACD alert setup from scratch: understanding which events trigger alerts, how to configure them across platforms, how to filter out noise, and how to combine MACD alerts with other indicators for high-probability confirmation. Whether you're trading stocks, ETFs, or options, this guide will ensure you never miss a critical MACD signal again.
Understanding MACD Signals: What You're Actually Alerting On
Before configuring any alert, you need to be crystal clear about what you're trying to capture. MACD generates several distinct signal types, and each requires a different alert condition. Treating them all the same is one of the most common mistakes traders make.
The Four Core MACD Signal Types
- MACD Line Crossover: The MACD line (12-period EMA minus 26-period EMA) crosses above or below the Signal line (9-period EMA of MACD). This is the classic buy/sell signal.
- Zero Line Cross: The MACD line crosses above or below the zero line, indicating a shift in the underlying trend momentum from bearish to bullish or vice versa.
- Histogram Reversal: The histogram bars begin shrinking after a period of expansion, signaling weakening momentum before a crossover occurs — the earliest warning available.
- MACD Divergence: Price makes a new high or low, but MACD fails to confirm, indicating a potential reversal. This is arguably the most powerful signal but also the hardest to automate.
Each of these has a different urgency level and a different false-signal rate. Signal line crossovers are frequent and can produce noise in choppy markets. Zero line crosses are rarer but carry more weight. Histogram reversals arrive earliest but require confirmation. Divergence signals are the highest quality but need careful filtering.
How to Configure a MACD Alert Setup on Major Platforms
The mechanics of setting up MACD alerts vary by platform, but the underlying logic is the same. Here's how to approach it on the most widely used tools in 2026.
TradingView MACD Alert Setup
TradingView remains the gold standard for charting alerts in 2026. Here's a step-by-step configuration:
- Open your chart and add the MACD indicator (standard settings: 12, 26, 9).
- Right-click on the MACD panel and select "Add Alert."
- In the Condition dropdown, select "MACD" as your indicator.
- Choose your trigger: "MACD crosses Signal line" for crossovers, or "MACD crosses 0" for zero-line events.
- Set the alert frequency — "Once per bar close" is recommended to avoid multiple triggers on the same candle.
- Configure delivery via email, SMS, webhook, or push notification. For active traders, webhook to a mobile app is optimal.
Pro tip: Always set MACD alerts to trigger on bar close, not in real time. A bar-close condition means the candle has fully formed before the alert fires, dramatically reducing false signals from intrabar price spikes.
ThinkOrSwim (TOS) MACD Alert Configuration
For options traders using TD Ameritrade's ThinkOrSwim platform, MACD alerts are configured through the Study Alerts system:
- Navigate to Charts > Studies > Add Study Alert.
- Select MACD from the study list and choose your trigger condition.
- TOS allows you to set alerts based on MACD histogram value thresholds — useful for catching momentum shifts before the crossover occurs.
- Link alerts to your scanner for multi-symbol MACD monitoring across a watchlist.
Using Stocks365 for Real-Time MACD Signal Monitoring
For traders who want MACD intelligence without manual configuration overhead, the Stocks365 signals dashboard provides pre-built technical signal monitoring with trust score weighting. Rather than setting up individual MACD alerts stock by stock, Stocks365 scans across hundreds of instruments simultaneously and surfaces only the signals that meet a composite quality threshold.
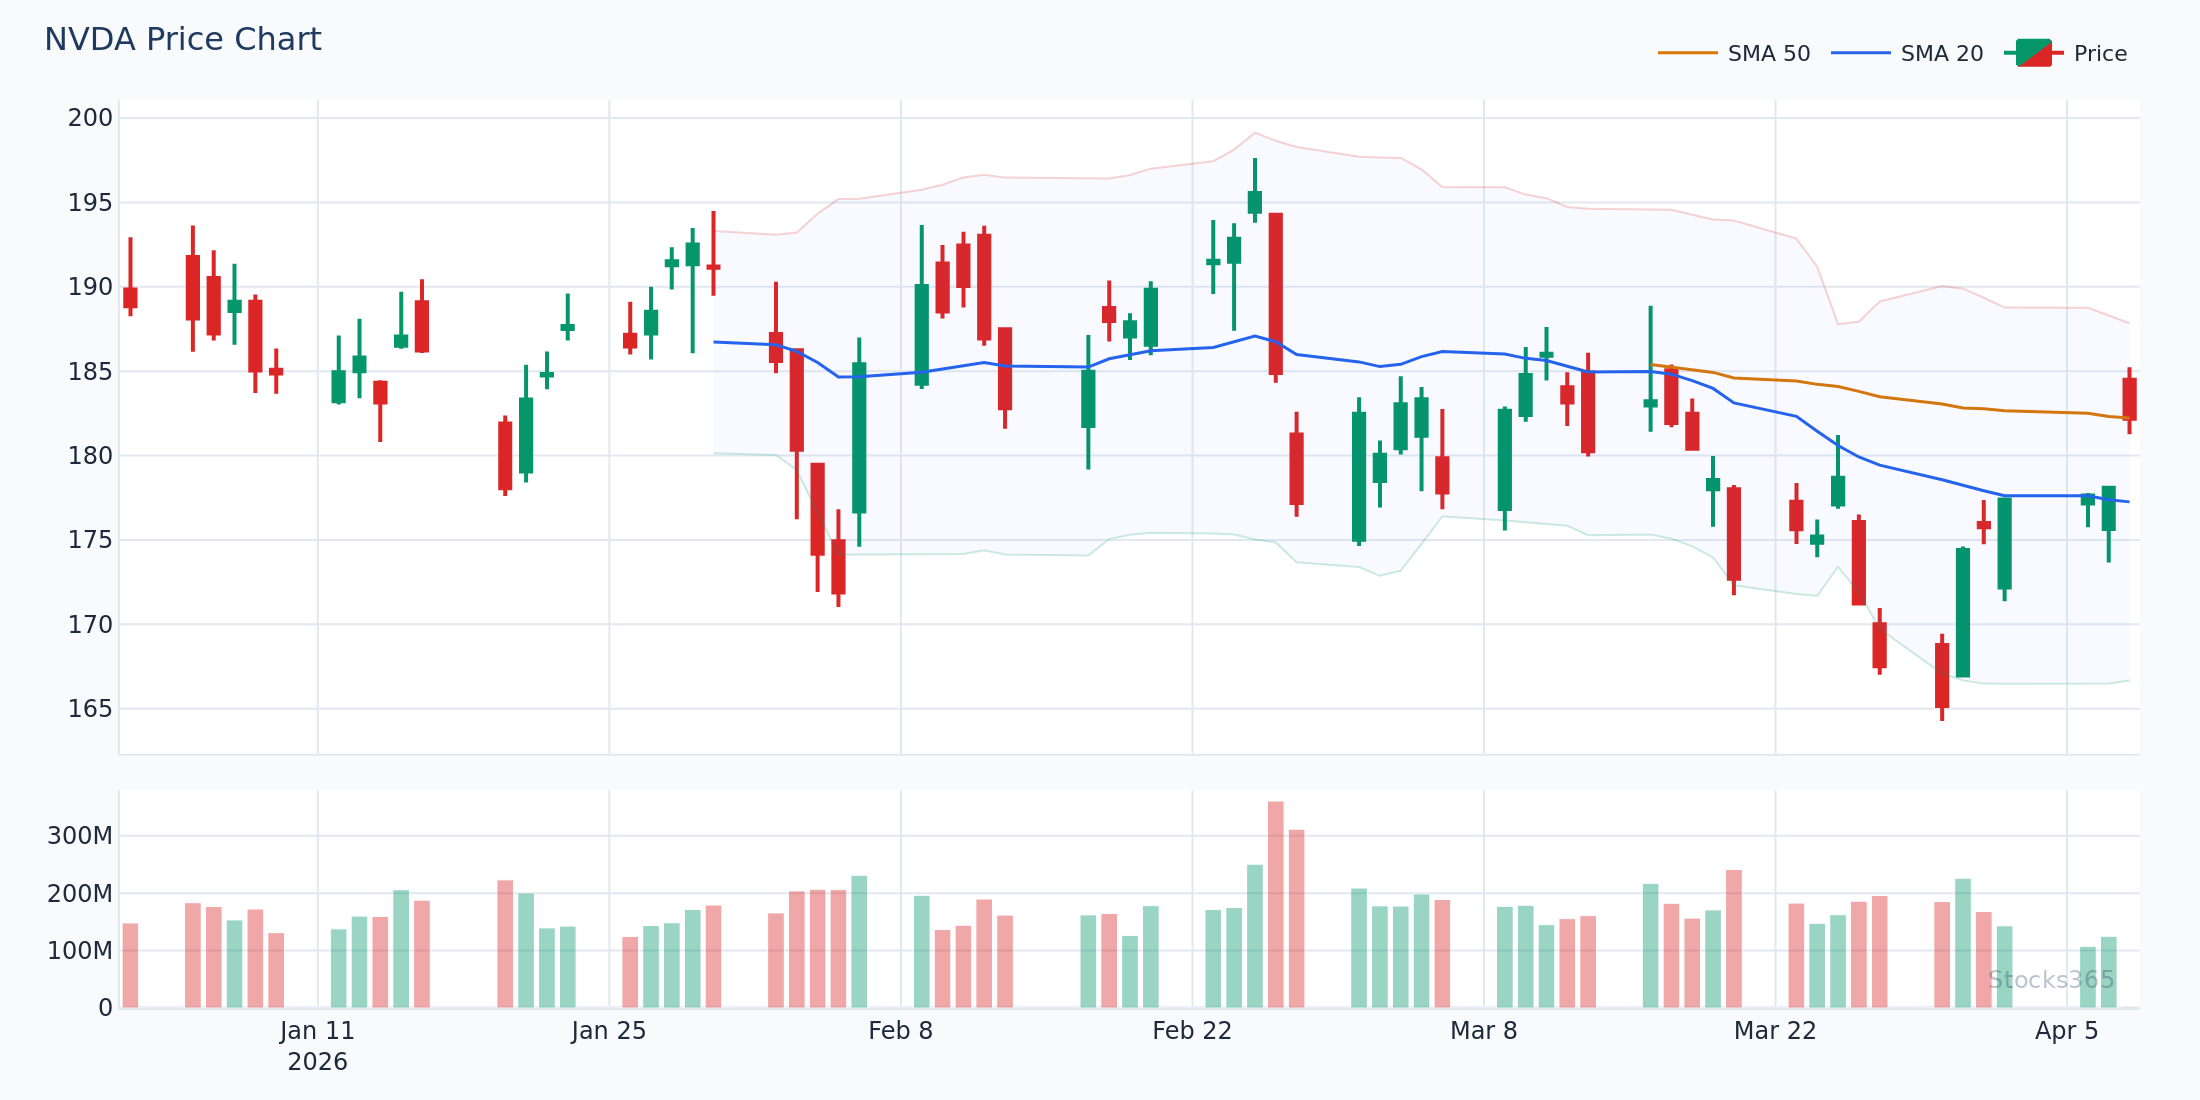
This is particularly valuable for MACD divergence detection, which is notoriously difficult to automate on standard charting platforms. The Stocks365 trust score system evaluates MACD signals alongside volume, trend context, and multi-timeframe confirmation — so when an alert fires, it's already been filtered for relevance. For example, a bullish MACD crossover on NVDA that also aligns with a rising trust score and above-average volume carries meaningfully more weight than a raw crossover in isolation.
Optimizing Your MACD Alert Settings for Different Market Conditions
One of the biggest mistakes traders make with their MACD alert setup is using identical settings across every market condition and timeframe. A MACD configuration optimized for trending markets will generate excessive noise during consolidation, and vice versa.
Timeframe Selection for MACD Alerts
The timeframe you choose dramatically affects both signal frequency and quality:
- 15-minute charts: High signal frequency, suited for day traders and scalpers. Expect more false signals. Use only when aligned with higher-timeframe trend.
- 1-hour charts: Good balance for swing traders capturing intraday to multi-day moves. MACD crossovers here often lead to 2-4% moves in trending environments.
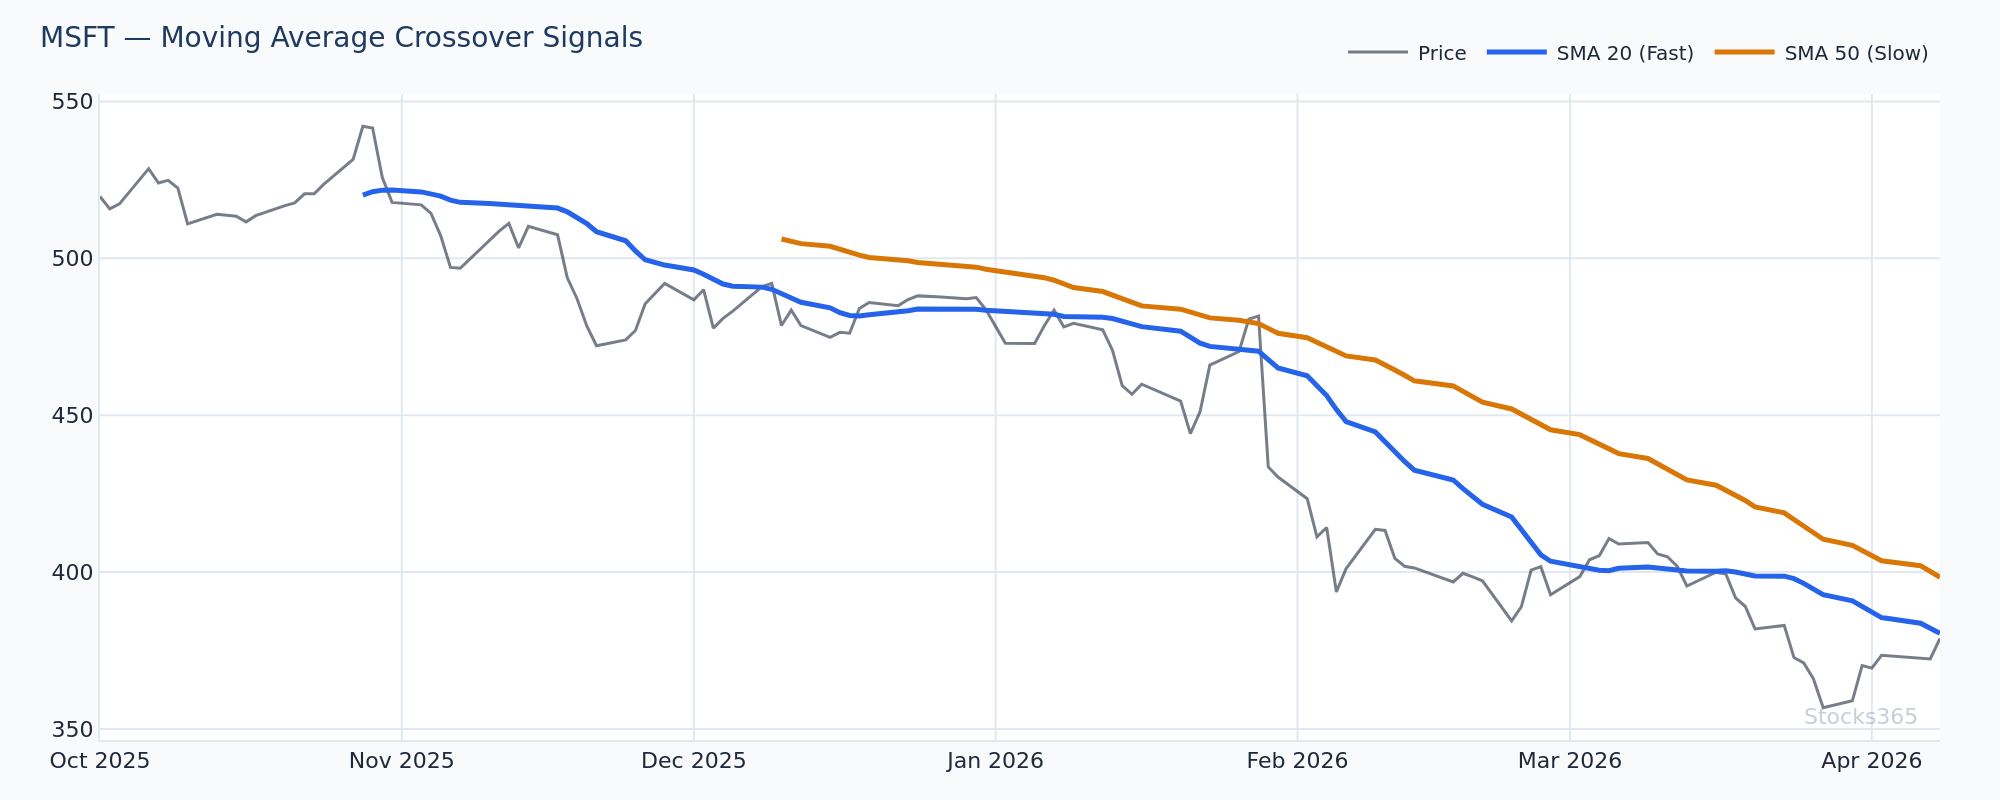
- Daily charts: The most reliable MACD signals for position traders. A daily MACD bullish crossover on MSFT, for example, has historically preceded multi-week uptrends.
- Weekly charts: Used for macro trend confirmation. Weekly MACD zero-line crosses mark major regime shifts and are excellent for portfolio-level decisions.
Adjusting MACD Parameters for Different Assets
Standard MACD settings (12, 26, 9) work well for stocks with moderate volatility, but consider these adjustments:
- High-volatility assets (e.g., TSLA, NVDA): Lengthen parameters to (19, 39, 9) to reduce whipsaws and filter out noise from daily price swings of 3-5%.
- Low-volatility ETFs and index funds: Tighten to (8, 17, 9) to capture signals earlier in slower-moving instruments.
- Crypto-correlated assets: Standard settings often work, but consider adding a volume filter to reduce false signals during low-liquidity hours.
"The best MACD alert setup isn't the one that fires most often — it's the one that fires at the right time. Fewer, higher-quality alerts outperform a noisy feed every time."
Combining MACD Alerts with Confirmation Indicators
Standalone MACD alerts have a meaningful false-signal rate, particularly in sideways or choppy markets. The professional approach is to build a confirmation layer into your alert logic — either through platform-level conditions or through a personal review checklist that fires when an alert triggers.
MACD + RSI Combination Alerts
The most powerful confirmation pairing for MACD is the Relative Strength Index. When a bullish MACD crossover occurs simultaneously with RSI recovering from oversold territory (below 40), the combined signal has historically shown a significantly higher win rate than either indicator alone.
On TradingView, you can write a Pine Script alert condition that requires both MACD and RSI conditions to be true simultaneously — effectively creating a composite signal. If you're newer to RSI mechanics, the complete beginner's guide to RSI on Stocks365 covers the foundational concepts, while our guide on how to use RSI in trading walks through practical combination strategies step by step.
For advanced traders, hidden RSI divergence can provide an additional confirmation layer when combined with MACD histogram reversals — particularly powerful for identifying continuation setups in strong trends.
MACD + Volume Confirmation
Volume is MACD's most overlooked confirmation tool. A bullish MACD crossover accompanied by above-average volume (typically 1.5x the 20-day average or higher) is significantly more reliable than a crossover on thin volume. Configure a secondary alert or add a visual marker to flag when both conditions are present simultaneously.
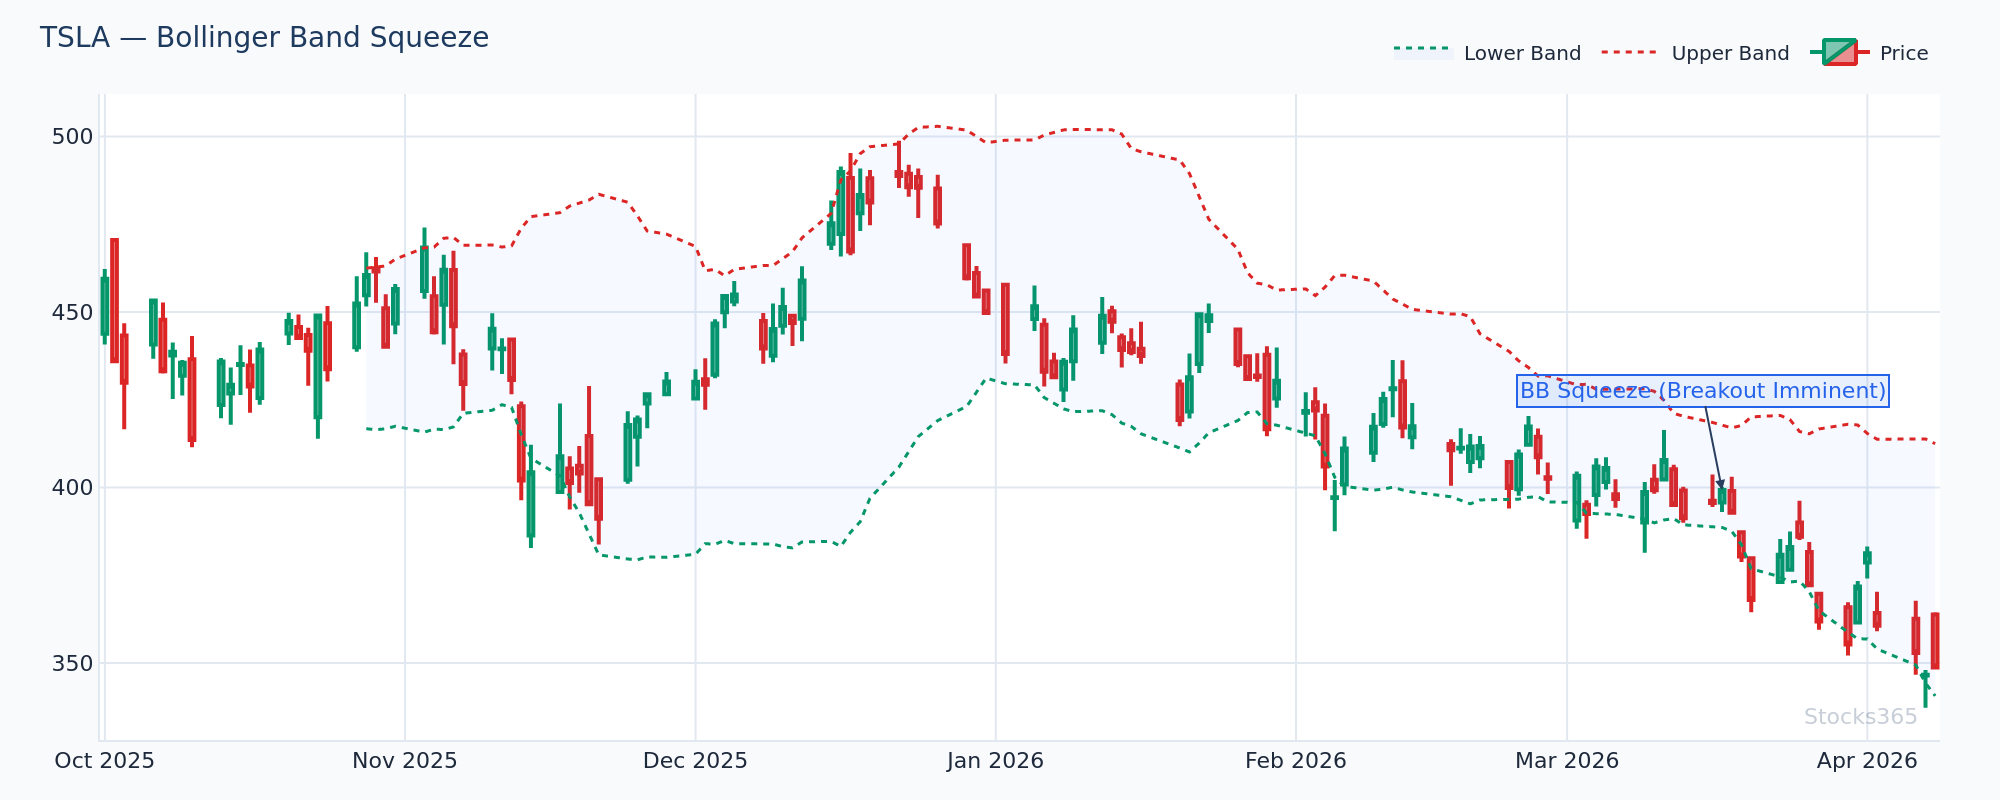
MACD + Bollinger Band Squeeze
A Bollinger Band squeeze followed by a MACD crossover in the direction of the breakout is one of the highest-probability setups in technical analysis. The squeeze identifies a period of compressed volatility — a coiled spring. When MACD crosses bullish as price breaks out of the squeeze, you have both a momentum and volatility breakout signal firing simultaneously. Set alerts for both conditions and look for overlap.
MACD Divergence Alerts: The Advanced Configuration
MACD divergence is the signal that separates amateur setups from professional ones. When price makes a new high but the MACD histogram or MACD line fails to confirm that high — making a lower high instead — you have bearish divergence. The reverse is bullish divergence.
The challenge is that pure divergence is geometrically complex and difficult to automate natively on most platforms. However, there are practical approaches:
Manual Divergence Alert Workflow
- Set a MACD histogram crossing-zero alert as a trigger to review the chart.
- When the alert fires, manually check whether price action shows a divergent pattern.
- This hybrid approach catches the majority of divergence setups without requiring complex scripting.
Pine Script Divergence Detection
For TradingView users comfortable with Pine Script, basic divergence detection scripts are available in the community library. These look for MACD peaks and troughs that don't correspond to equivalent price peaks and troughs. While not perfect, they catch the majority of textbook divergence setups and can fire alerts automatically.
Understanding divergence mechanics deeply is essential here. Our articles on RSI divergence explained and hidden RSI divergence provide excellent frameworks for thinking about momentum divergence that apply directly to MACD divergence as well — the conceptual mechanics are nearly identical.
Building a Multi-Asset MACD Alert System
Most professional traders aren't monitoring a single stock — they're tracking a watchlist of 20, 50, or even 100+ instruments. Setting up individual MACD alerts for each symbol is both tedious and difficult to manage. Here's how to scale your MACD alert setup efficiently.
Watchlist-Based Alert Scanning
- TradingView screener alerts: Use the Stock Screener with MACD crossover as a filter. New results automatically appear and can be linked to notifications.
- ThinkorSwim scan alerts: Build a custom scan with MACD crossover conditions and set it to run on a schedule, pushing alerts when new matches appear.
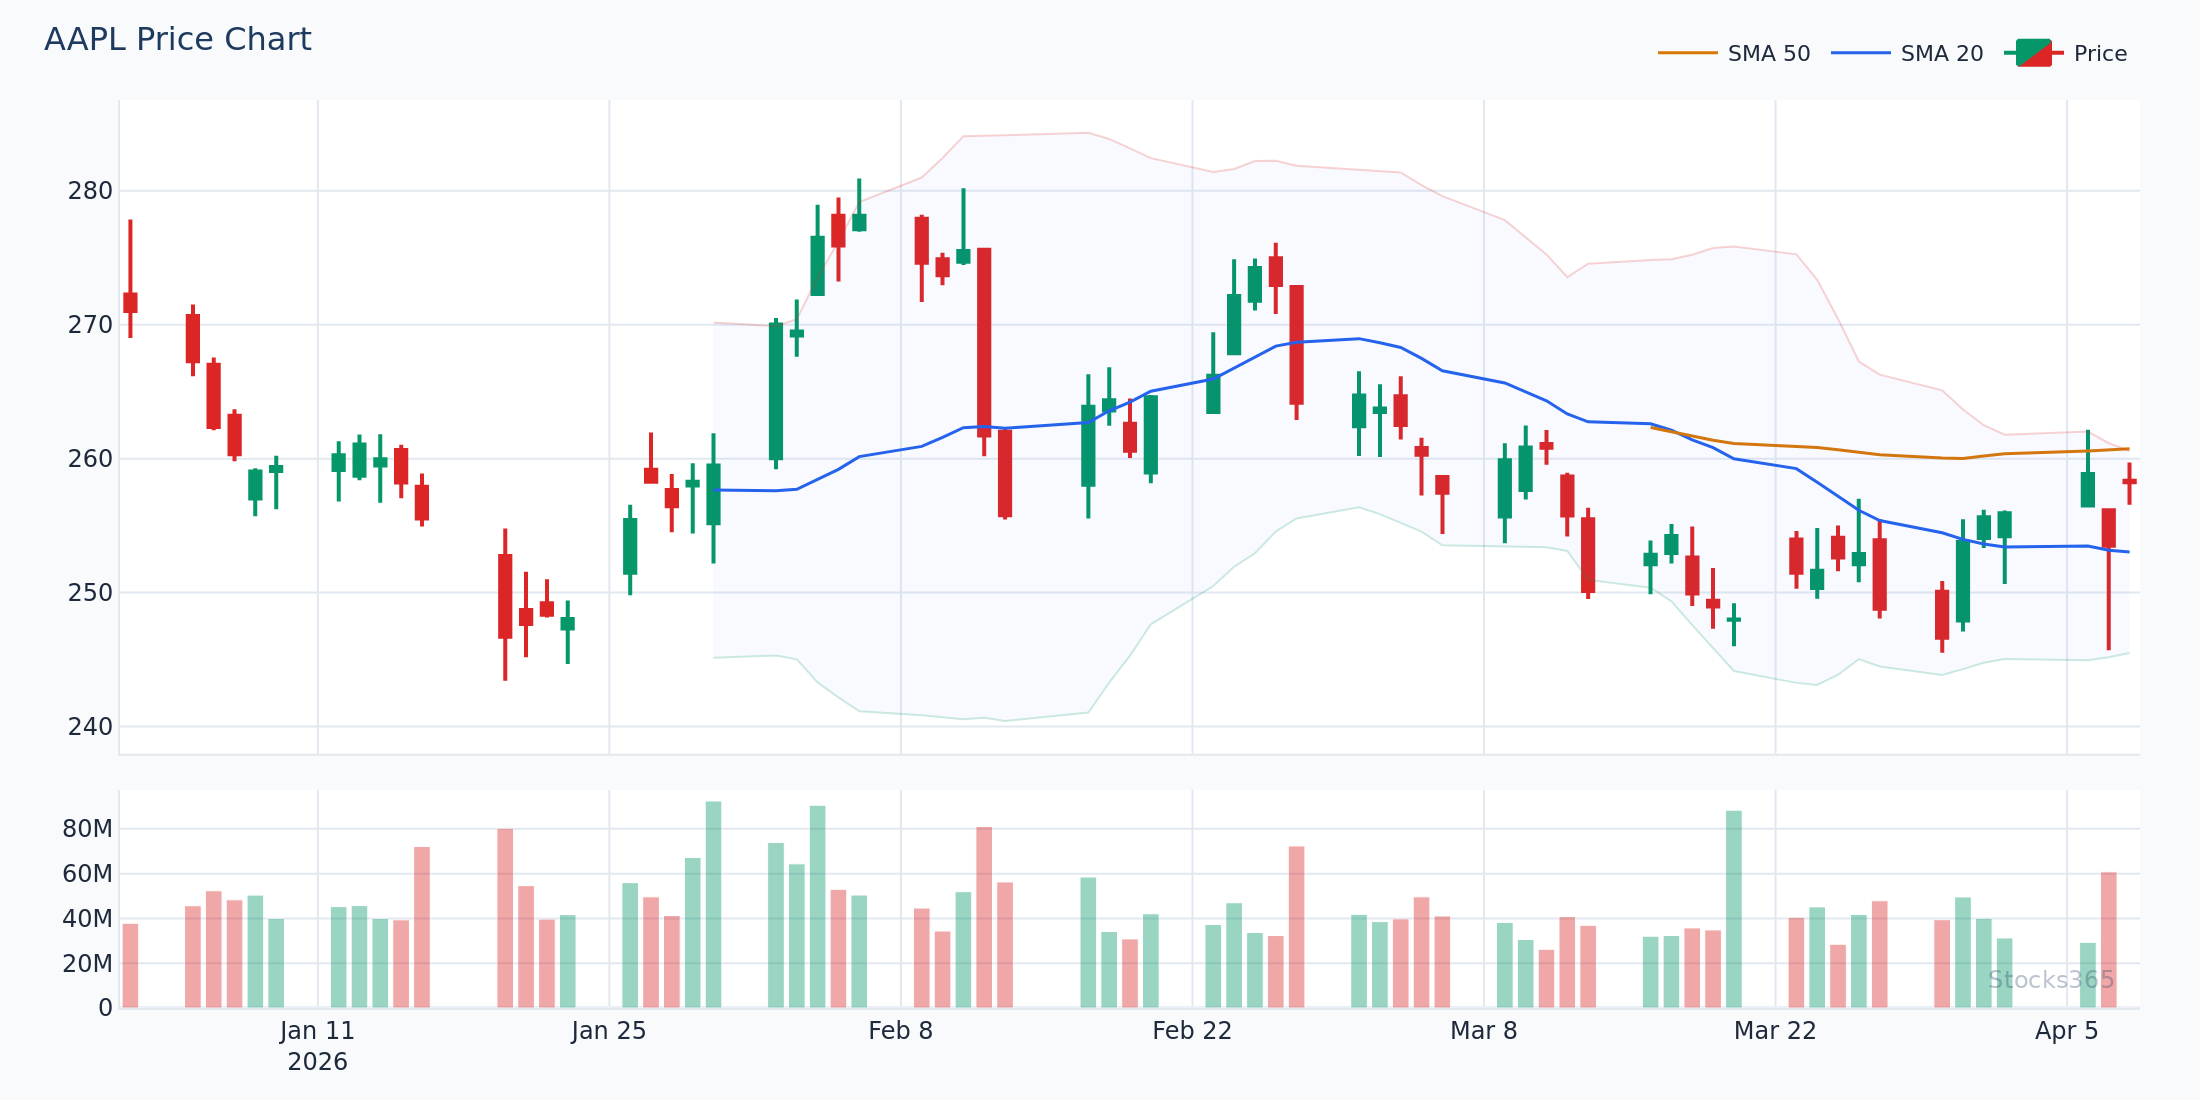
- Stocks365 dashboard: The Stocks365 signals dashboard handles multi-asset MACD scanning natively, with trust score filtering to surface only the highest-quality setups from your monitored universe. Signals for individual stocks like AAPL or TSLA are available with full context.
Organizing Alerts by Priority
Not all MACD alerts deserve equal urgency. Consider tiering your alert system:
- Tier 1 (Immediate action): Daily chart MACD crossover + RSI confirmation + above-average volume on a high-conviction watchlist stock.
- Tier 2 (Review within the hour): Daily chart MACD crossover without full confirmation, or 4-hour chart signal on a key stock.
- Tier 3 (End-of-day review): 1-hour chart crossovers, MACD approaching zero line, histogram trend changes on secondary watchlist.
Deliver Tier 1 alerts via SMS or push notification. Tier 2 via email. Tier 3 into a daily digest. This prevents alert fatigue — a real problem that causes traders to start ignoring notifications and missing the signals that matter.
Common MACD Alert Setup Mistakes and How to Avoid Them
Even experienced traders make predictable errors when configuring MACD alerts. Here are the most common — and how to avoid them.
Mistake 1: Alerting on Intrabar Conditions
Setting alerts to trigger mid-candle means the MACD values are incomplete. A candle that looks like it's crossing bullish at 2pm may close back below the signal line by 4pm. Always trigger on bar close for confirmed signals.
Mistake 2: Ignoring Higher Timeframe Context
A bullish MACD crossover on a 15-minute chart while the daily chart shows MACD in deeply bearish territory is a counter-trend setup with much lower probability. Always check your MACD alert against the higher-timeframe trend before acting.
Mistake 3: Using Identical Settings Across All Stocks
A volatile growth stock like NVDA and a slow-moving dividend stock like JNJ behave completely differently. Applying standard 12/26/9 settings to both will generate excellent signals on one and excessive noise on the other. Segment your watchlist by volatility profile and apply appropriate settings.
Mistake 4: No Confirmation Requirement
Raw MACD crossovers have a win rate that barely exceeds 50% on daily timeframes in isolation. Without requiring at least one confirmation — volume, RSI level, trend alignment, or support/resistance proximity — you're essentially flipping a coin. Understanding how other oscillators compare can help here; our RSI vs Stochastic Oscillator guide explains how different momentum tools complement each other, principles that apply equally to MACD combination strategies.
Key Takeaways
MACD Alert Setup: Essential Summary
- Configure alerts for all four MACD signal types: crossovers, zero-line crosses, histogram reversals, and divergence — each has a different urgency and quality profile.
- Always set alerts to trigger on bar close, never intrabar, to eliminate false signals from incomplete candles.
- Adjust MACD parameters (standard: 12, 26, 9) based on asset volatility — lengthen for high-volatility names like TSLA and NVDA, tighten for slow-moving instruments.
- Combine MACD alerts with RSI levels, volume confirmation, and higher-timeframe trend context to significantly improve signal quality.
- Tier your alerts by quality level (daily with confirmation vs. intraday standalone) to prevent alert fatigue and ensure you prioritize the best setups.
- Use the Stocks365 signals dashboard for pre-filtered, trust-score-weighted MACD signal monitoring across a broad instrument universe.
- MACD divergence is the highest-quality signal type — use a hybrid manual review workflow triggered by histogram zero-cross alerts to capture these reliably.
Frequently Asked Questions
What is the best MACD setting for daily stock alerts?
The standard 12, 26, 9 setting is the most widely used and works well for most daily stock charts. For high-volatility growth stocks, consider lengthening to 19, 39, 9 to reduce noise. For slower instruments, tightening to 8, 17, 9 can generate earlier signals. Always backtest your chosen parameters on the specific instrument before relying on live alerts.
How do I avoid false MACD alerts in choppy markets?
The most effective filters are: (1) requiring bar-close confirmation rather than intrabar triggers, (2) adding a volume threshold so alerts only fire when volume exceeds the 20-day average, (3) checking higher-timeframe MACD alignment before acting on lower-timeframe signals, and (4) using RSI as a secondary confirmation — a bullish MACD crossover is more reliable when RSI is recovering from below 45 rather than already overbought. See our guide on RSI overbought and oversold levels for calibrating these thresholds.
Can I set up MACD divergence alerts automatically?
Pure automatic divergence alerts are challenging to implement on most retail platforms because divergence is a geometric pattern comparison between price and indicator. TradingView's Pine Script community has divergence detection scripts that work reasonably well. Alternatively, using MACD histogram zero-cross alerts as a trigger for manual divergence review is a practical hybrid approach that catches most high-quality divergence setups without complex scripting.
What timeframe should I use for MACD alerts?
This depends on your trading style. Day traders typically monitor 15-minute to 1-hour charts. Swing traders find the most reliable signals on 4-hour and daily charts. Position traders focus on daily and weekly MACD crosses. For any timeframe, the signal quality improves significantly when aligned with the next-higher timeframe's MACD direction. A bullish daily MACD crossover in a stock where the weekly MACD is also trending upward is materially stronger than a counter-trend daily signal.
How many MACD alerts should I have running simultaneously?
Quality over quantity is the core principle. Experienced traders typically maintain 10-30 high-conviction alerts on daily timeframes, supplemented by a broader scanner for discovery. Running 200+ simultaneous alerts leads to notification fatigue where you start tuning out alerts entirely — defeating the purpose. Use a tiered delivery system (SMS for top-tier, email for secondary) and leverage tools like the Stocks365 signals dashboard to handle broad-market scanning so your personal alerts can focus on your highest-conviction watchlist names.