
What Is MACD? A Plain-English Answer
MACD stands for Moving Average Convergence Divergence. It is one of the most widely used technical indicators in trading — and one of the most misused. At its core, MACD measures the relationship between two exponential moving averages (EMAs) to reveal momentum shifts before they become obvious on a price chart.
Gerald Appel developed MACD in the late 1970s. Decades later, it remains a standard feature on every serious trading platform — and for good reason. It works.
Here is the essential idea: when short-term price momentum accelerates faster than long-term momentum, something is changing. MACD captures that change. It does not predict the future — no indicator does — but it gives you a structured, repeatable way to read the market's current energy.
Stocks365 backtested 10,807 MACD Histogram Reversal signals across multiple asset classes and found a 50.9% win rate over a 10-day holding period — with crypto performing significantly better at 62.3%. The edge is not in blind execution. It is in knowing when and where each signal performs. More on that below.
How MACD Is Calculated
You do not need to calculate MACD by hand. Every charting platform does it automatically. But understanding the math makes you a smarter trader.
The Three Components of MACD
- MACD Line: The 12-period EMA minus the 26-period EMA. This is the primary signal line.
- Signal Line: A 9-period EMA of the MACD Line itself. Think of it as a smoothed version of the MACD.
- Histogram: The difference between the MACD Line and the Signal Line, plotted as bars above or below zero. Growing bars mean momentum is accelerating. Shrinking bars mean it is fading.
The default settings — 12, 26, 9 — are universally standard. Some active traders adjust these for faster or slower signals, but beginners should start with the defaults and master them before experimenting.
Understanding EMA weighting is critical here. Unlike a simple moving average that treats all periods equally, an EMA gives more weight to recent prices. That is why MACD reacts faster to new price action than older momentum tools. For a deeper look at how EMAs behave, read our guide on Exponential Moving Averages explained with examples.
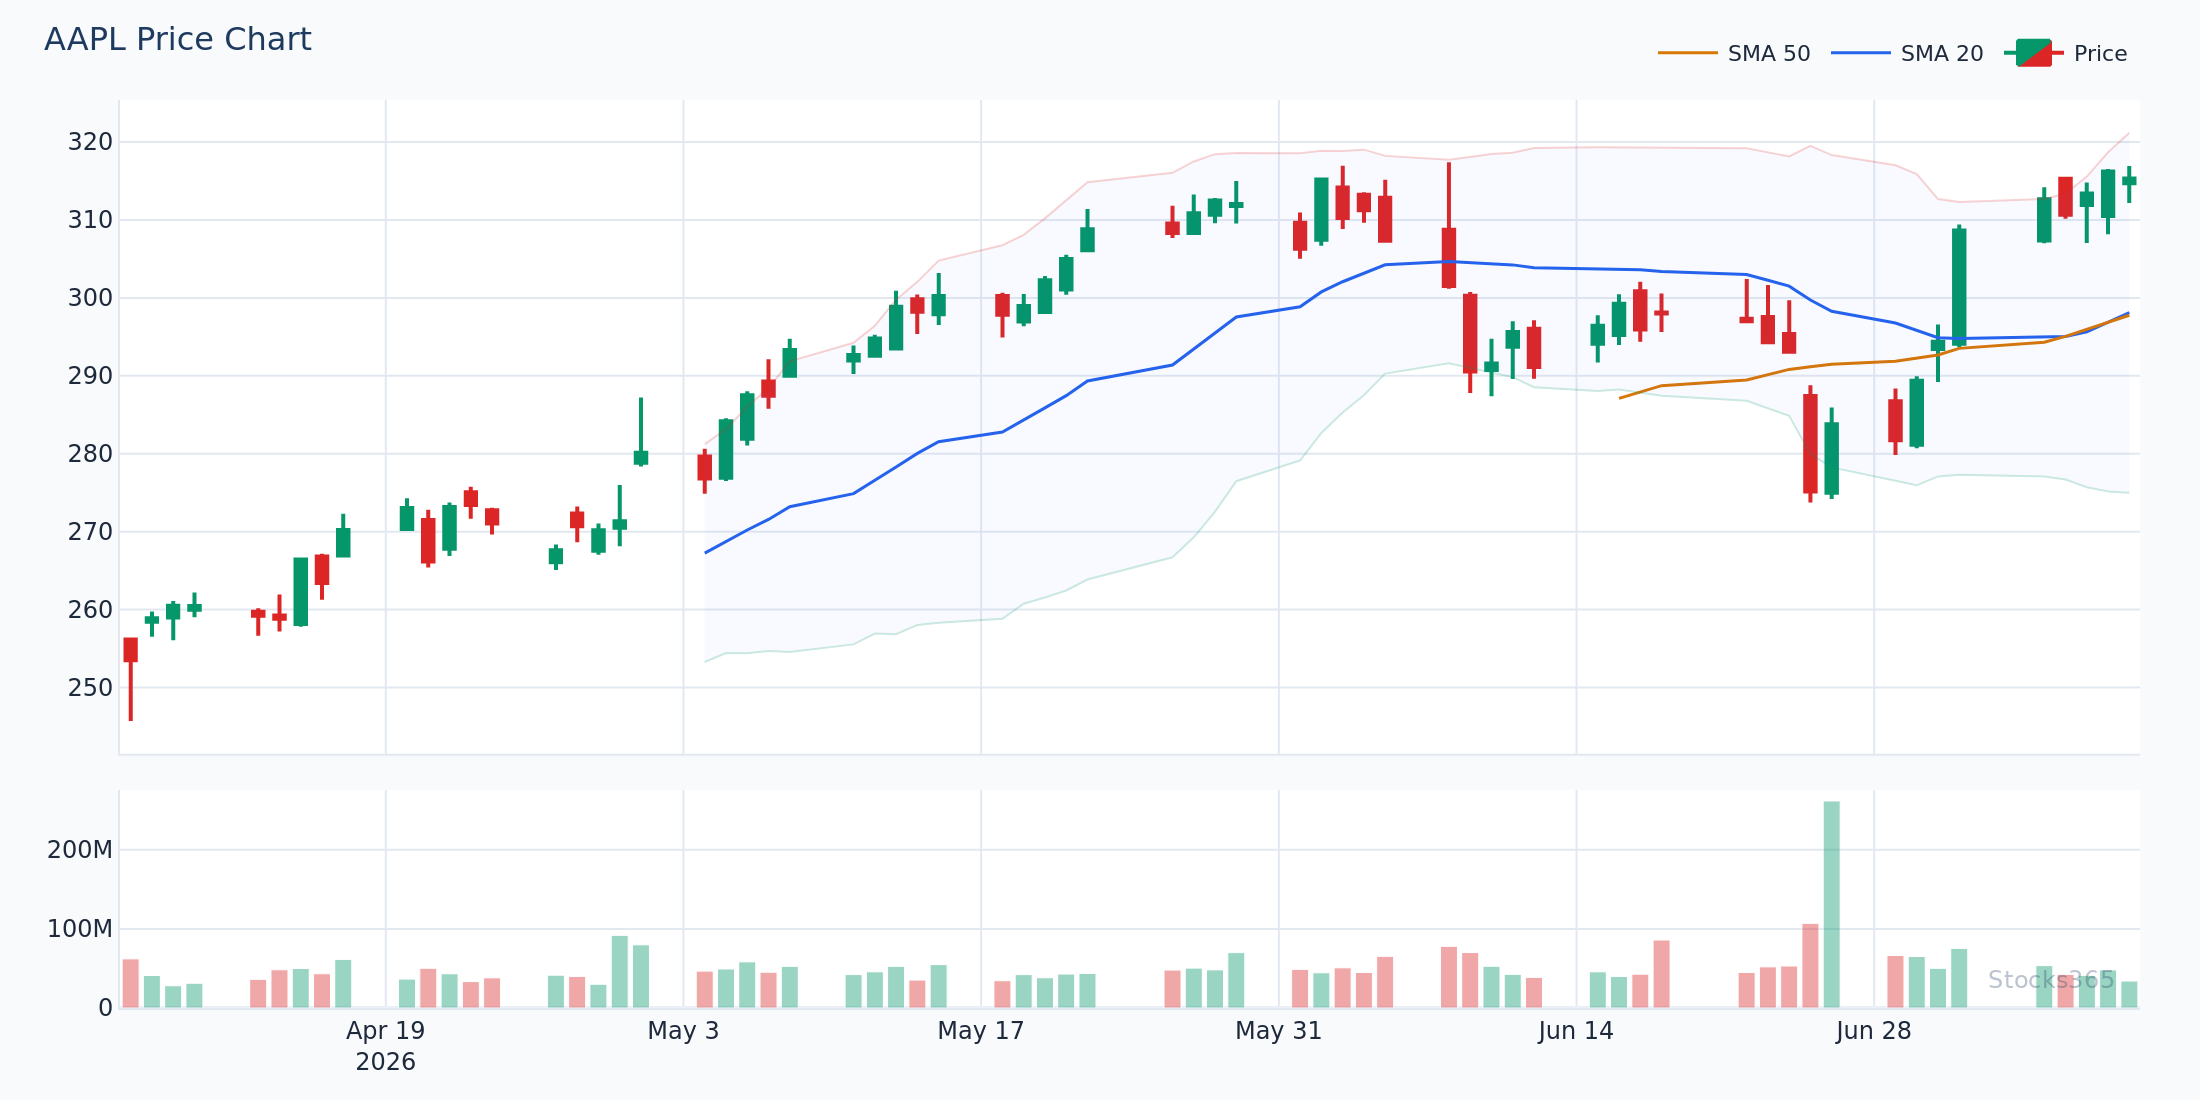
This chart shows all three MACD components in action. Notice how the histogram bars grow taller as the MACD Line diverges from the Signal Line — momentum is building. When those bars start shrinking while price is still rising, that is your first warning that the move may be losing steam. A crossover of the MACD Line back through the Signal Line confirms the shift.
The Four Core MACD Signals Every Trader Must Know
1. The Bullish MACD Crossover
A bullish crossover happens when the MACD Line crosses above the Signal Line. This is the most popular MACD signal. It suggests that short-term momentum is outpacing long-term momentum — a potential entry point for long positions.
The strongest bullish crossovers occur below the zero line, in negative territory. That combination — a cross below zero — tells you momentum has genuinely reversed, not just paused.
2. The Bearish MACD Crossover
The mirror image. The MACD Line crosses below the Signal Line, signaling weakening momentum and a potential short entry or exit from long positions. Bearish crossovers above the zero line carry the most weight.
3. The Zero Line Cross
When the MACD Line crosses above zero, the 12-period EMA has moved above the 26-period EMA. Bullish territory. When it crosses below zero, the reverse is true. Zero line crosses confirm trend direction — they are slower signals, but more reliable for trend-following setups. Pair them with a moving average crossover strategy for additional confirmation.
4. MACD Divergence
Divergence is where MACD gets powerful. Bullish divergence occurs when price makes a lower low but MACD makes a higher low. Momentum is strengthening even as price falls — a reversal signal. Bearish divergence is the opposite: price makes a higher high while MACD makes a lower high.
Divergence does not trigger reversals instantly. It flags exhaustion. Use it as a warning, not an automatic trigger.
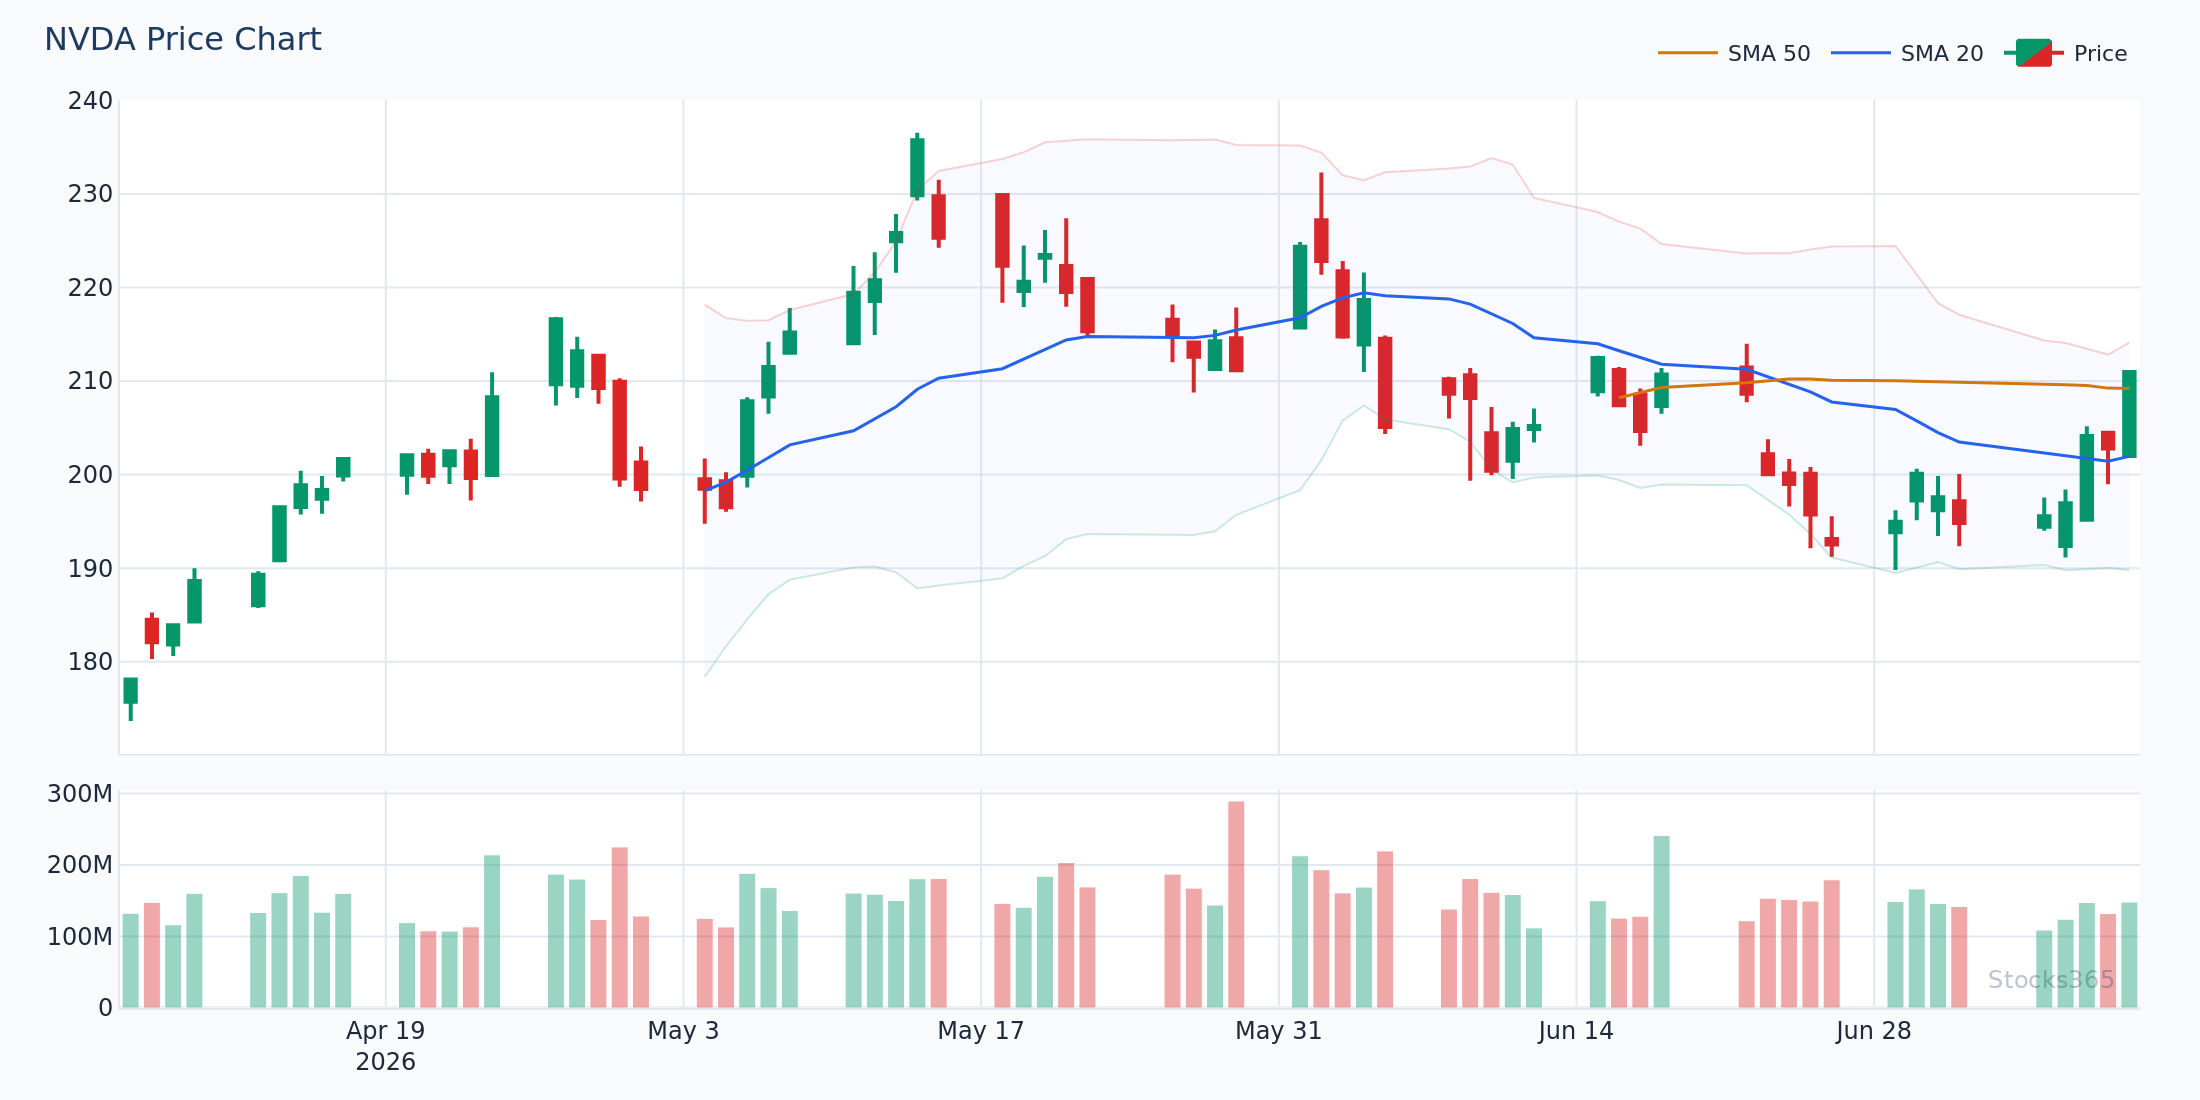
This chart illustrates a classic bullish divergence setup. Price prints a fresh swing low while the MACD histogram's negative bars are visibly shallower than the previous trough — momentum is drying up on the sell side. The pattern is invalidated if price breaks decisively below the prior swing low with expanding MACD histogram bars, which would signal continuation rather than reversal.
Reading the MACD Histogram
Most beginners focus on the crossover lines and ignore the histogram. That is a mistake.
The histogram gives you real-time momentum intelligence. Each bar represents the gap between the MACD Line and Signal Line. Watch these patterns:
- Expanding positive bars: Bullish momentum accelerating. Trend is healthy.
- Shrinking positive bars: Bullish momentum fading. Not a sell signal yet — but a warning.
- Expanding negative bars: Bearish momentum accelerating. Avoid longs.
- Shrinking negative bars: Bearish momentum fading. Potential reversal setup building.
The histogram reversal — when bars change direction before a full crossover — is often the earliest signal MACD generates. Our MACD glossary covers every histogram term in detail if you want to go deeper.
Here's What Most Traders Get Wrong About MACD
Most beginners treat every MACD bullish crossover as a buy signal. They see the lines cross, they enter, and then they wonder why the trade fails. The crossover alone is not the edge. Context is the edge.
A bullish crossover in a strong downtrend is a counter-trend signal against significant momentum. MACD does not know whether the market is trending or ranging. You have to know that first — then apply MACD accordingly. In a confirmed uptrend, bullish crossovers near the zero line are high-probability continuation entries. In a downtrend, those same crossovers are likely to fail within days.
Ignore crossovers without context. Seriously.
MACD Performance by Asset Class: What the Data Shows
Not all MACD signals are created equal. Asset class matters enormously — and our backtesting proves it.
Our analysis of 2,310 MACD Bullish Cross signals found an overall win rate of 49.7% on a 10-day holding period. That average masks a critical split: commodities showed a 55.2% win rate while crypto came in at just 39.2%. Applying a bullish MACD crossover strategy indiscriminately across all assets quietly erodes your edge. You can explore the full methodology on our research dashboard.
Why does crypto underperform on bullish crossovers? Crypto markets are structurally noisier. Volatility generates frequent false crossovers. A signal that works cleanly in commodity futures — where trends tend to be more sustained — gets chopped apart in a 24/7 crypto market with thin liquidity windows.
The implication is direct: match the signal to the asset.
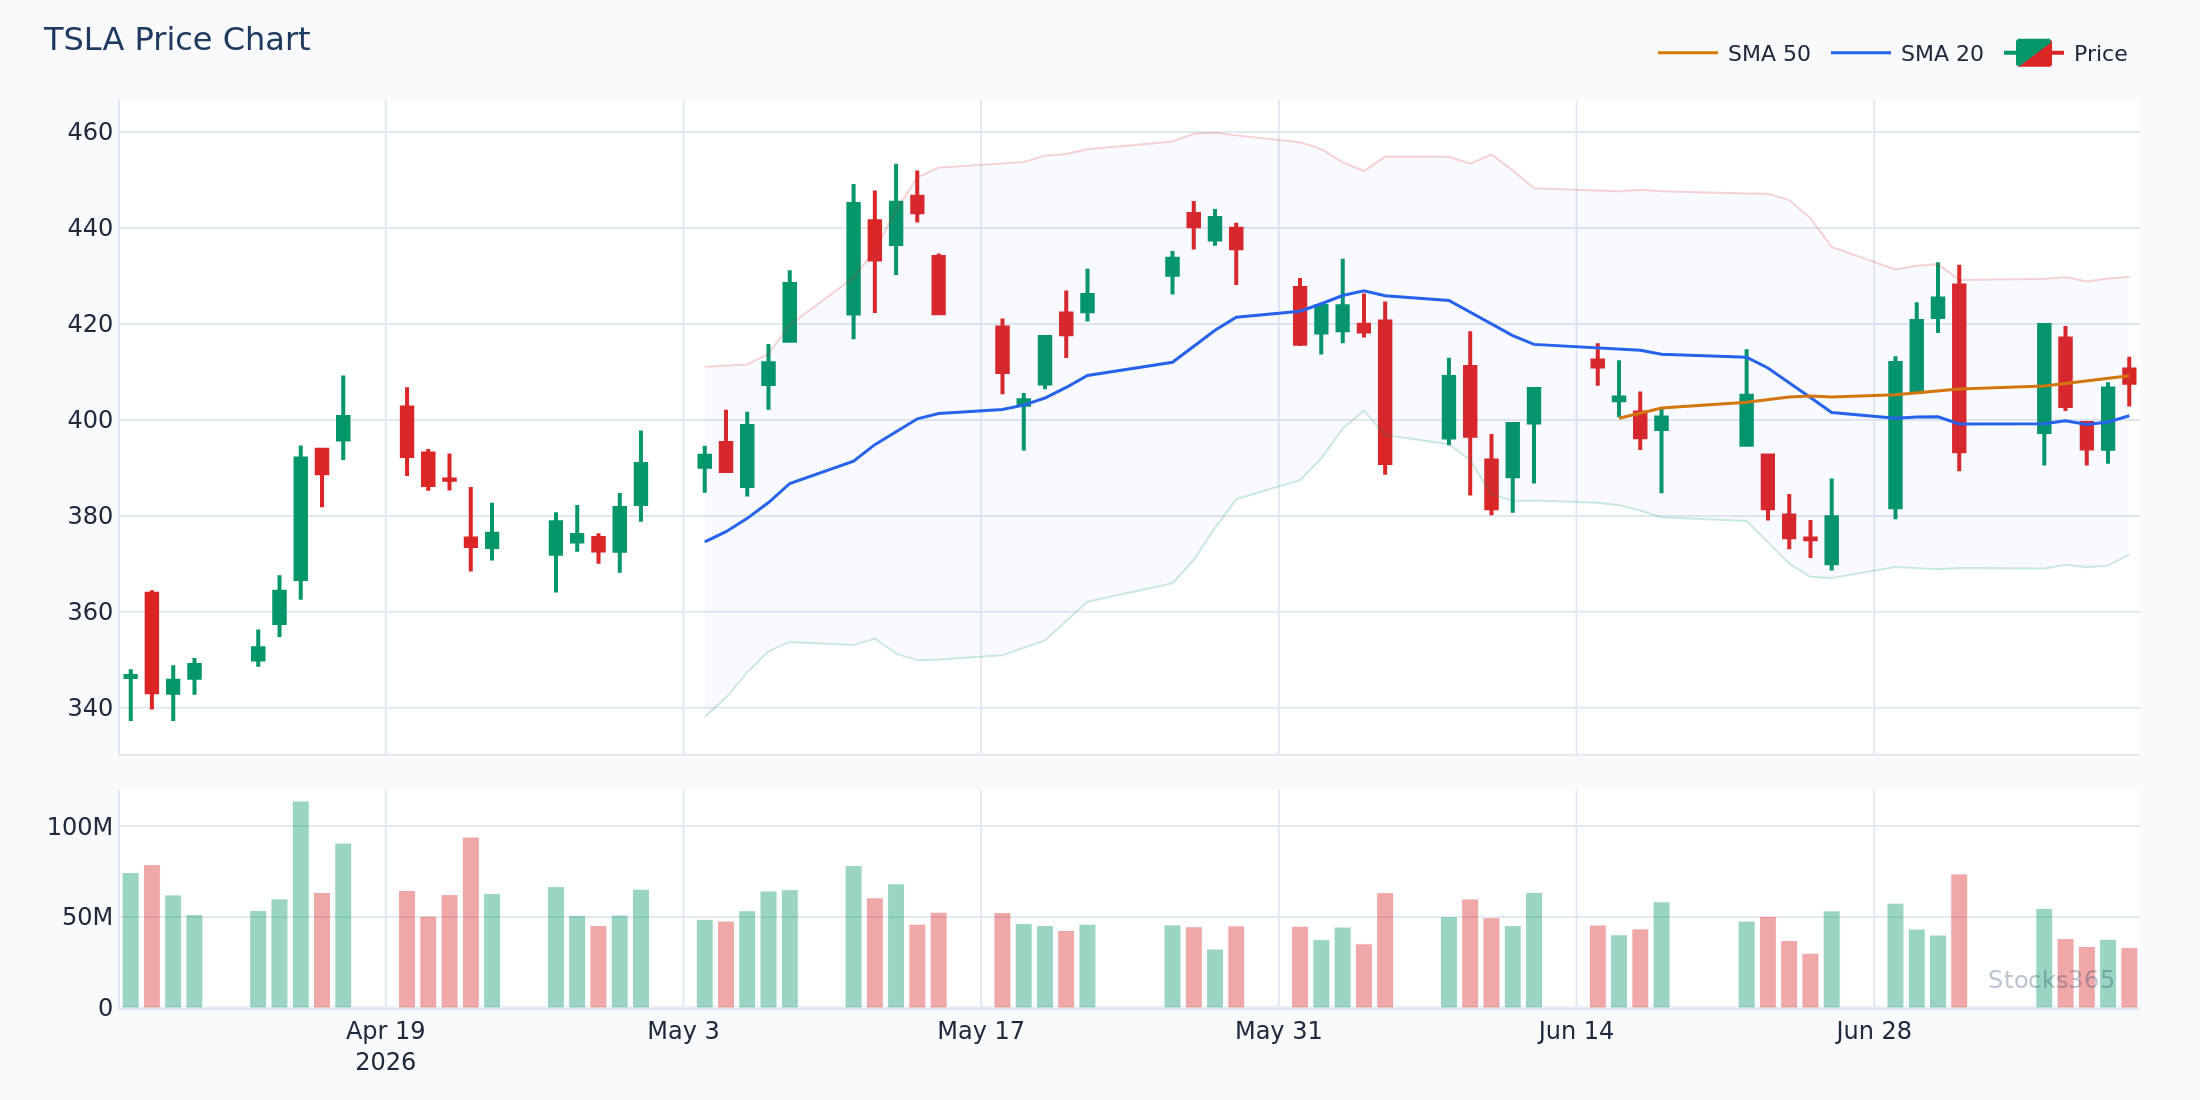
This example shows a bullish MACD crossover occurring as price holds above its 50-period EMA, with volume surging above the 20-day average — a confirmation stack that raises signal quality significantly. When the MACD cross aligns with trend direction and volume expansion, the setup becomes materially stronger. If volume is flat or declining on the crossover, treat the signal with caution.
How to Use MACD With Other Indicators
MACD is a momentum and trend tool. It has blind spots. Pairing it with complementary indicators fills those gaps.
MACD + RSI
RSI measures overbought and oversold conditions. MACD measures momentum direction. Together, they cover different dimensions of market behavior. When MACD gives a bullish crossover and RSI climbs back above 40 from oversold territory, the combined signal is significantly more reliable than either alone. For advanced RSI techniques, see our guide on multi-timeframe RSI analysis.
MACD + Bollinger Bands
Bollinger Bands define volatility context. A MACD bullish crossover occurring as price bounces off the lower Bollinger Band combines momentum reversal with a statistical extreme — a high-quality setup. Read how Bollinger Bands work to understand the math behind this pairing.
MACD vs. Stochastic Oscillator
Both MACD and the Stochastic Oscillator are momentum-based, but they behave differently. Stochastic is faster and better suited for ranging markets. MACD shines in trending environments. Knowing when to use which — and how they diverge — is a crucial skill. Our detailed breakdown in MACD vs. Stochastic Oscillator covers every key difference. And if you are learning the Stochastic from scratch, start with how to read the Stochastic Oscillator step-by-step.
Practical MACD Trading Setups
Setup 1: The Trend-Continuation Pullback
Price is in a clear uptrend — higher highs, higher lows, price above the 50-period EMA. MACD pulls back toward the zero line during a price consolidation, then crosses bullish again. This is a trend-continuation entry with defined risk below the recent swing low.
This is one of the cleanest MACD setups available. The trend does most of the work.
Setup 2: The Divergence Reversal
Price makes a new swing low. MACD histogram makes a shallower low. Wait for price to break above the most recent swing high to confirm the reversal before entering. Do not front-run divergence — let the market confirm it first.
Setup 3: The Zero Line Rejection
MACD Line approaches zero from below, fails to cross into positive territory, and rolls back down. This signals that bulls attempted a recovery but lacked the momentum to sustain it. A strong bearish entry setup in downtrending conditions.
Here the MACD Line approaches the zero baseline after a period of bearish momentum, stalls, and reverses downward without a confirmed crossover into positive territory. This zero-line rejection pattern often precedes a resumption of the prior downtrend, particularly when price simultaneously fails to reclaim a key moving average. The setup is invalidated if the MACD Line pushes decisively above zero on expanding histogram bars.
Common MACD Mistakes to Avoid
- Trading every crossover: Crossovers in choppy, low-momentum markets generate false signals constantly. Filter with trend context first.
- Ignoring the histogram: The histogram often telegraphs crossovers early. Watching it shrink before a crossover gives you a head start.
- Using MACD alone: MACD is a powerful component, not a complete system. Always combine it with at least one confirming tool.
- Changing settings constantly: Optimizing MACD settings to fit historical data is curve-fitting. Master the default 12-26-9 first.
- Ignoring asset class context: As the data shows, a 55.2% win rate in commodities versus 39.2% in crypto is not a small difference. Know your market.
What to Watch For
- Bullish MACD crossovers in commodities during confirmed uptrends — our backtested data shows commodities generate the strongest win rate on this signal. When the crossover occurs above the zero line during a trending phase, the setup quality increases further.
- MACD histogram reversals in crypto after sharp sell-offs — histogram reversal signals in crypto showed a 62.3% win rate in our analysis of 10,807 signals. When histogram bars turn from expanding negative to shrinking negative after a 20%+ drawdown, a bounce setup is forming. Confirmation comes when price reclaims a short-term moving average.
- Bearish divergence on large-cap tech stocks when price makes new highs on shrinking volume — MACD printing a lower high while price extends is a warning. Wait for a bearish crossover to confirm before acting on the divergence.
- Zero line crossovers aligning with Bollinger Band midline reclaims — when the MACD Line crosses above zero at the same time price reclaims the 20-period Bollinger Band midline, the two signals reinforce each other. A high-quality long setup in trending markets. Learn more about Bollinger Bands in crypto trading for additional context.
- MACD crossovers occurring with RSI emerging from below 35 — this combination of momentum reversal and oversold recovery is one of the cleaner multi-indicator setups available. Historically, it reduces the false-signal rate compared to MACD crossovers in neutral RSI conditions.
⚙️ How Stocks365 Uses MACD
MACD is one of 12+ technical indicators embedded in the Stocks365 Trust Score system. It contributes specifically to the momentum agreement layer — where the platform checks whether short-term and medium-term momentum signals are aligned or conflicting across multiple timeframes.
When a MACD bullish crossover aligns with confirming signals from RSI, volume profile, and trend regime classification, the Trust Score rises — reflecting higher-confidence setups. A MACD signal in isolation gets weighted less heavily than one that arrives alongside 4-5 corroborating signals. This is exactly the kind of signal stacking the research data supports.
You can see live MACD-influenced Trust Scores on our signals dashboard or drill into individual names like AAPL's signal page to see how each indicator contributes to the overall score in real time.