
MACD Glossary: Every Term You Need to Know for Smarter Trading
The Moving Average Convergence Divergence (MACD) is one of the most widely used technical indicators in trading — yet many traders struggle with its terminology. Whether you're new to technical analysis or refining an advanced strategy, understanding every MACD glossary term is essential for reading signals correctly and executing trades with confidence.
This comprehensive glossary covers every MACD term you'll encounter on platforms, charts, and trading forums — with plain-English definitions, practical examples using real price levels, and guidance on how each concept applies in live market conditions as of 2026.
Pro Tip: If you're also using momentum oscillators like the RSI alongside MACD, check out our Complete Beginner's Guide to RSI for a solid foundation in complementary indicator analysis.
What Is MACD? A Quick Orientation
Before diving into individual MACD glossary terms, it helps to understand the indicator at a high level. MACD is a trend-following momentum indicator that shows the relationship between two exponential moving averages (EMAs) of an asset's price. It was developed by Gerald Appel in the late 1970s and remains a cornerstone of modern technical analysis.
MACD is plotted as three components: the MACD line, the signal line, and the histogram. Understanding each of these — and the vocabulary surrounding them — is what separates traders who use MACD intuitively from those who misread signals and take poorly-timed entries.
Core MACD Glossary Terms Explained
1. MACD Line
The MACD line is the primary line of the indicator, calculated by subtracting the 26-period EMA from the 12-period EMA of the closing price.
- Formula: MACD Line = 12-period EMA − 26-period EMA
- When the MACD line is above zero, the short-term average is above the long-term average — a bullish condition.
- When the MACD line is below zero, it indicates bearish momentum.
Example: If NVDA is trading at $1,150 and the 12-period EMA is $1,162 while the 26-period EMA is $1,140, the MACD line equals +22. This positive reading suggests upward momentum.
2. Signal Line
The signal line is a 9-period EMA of the MACD line itself. It acts as a smoother, slower-moving trigger line used to generate buy and sell signals.
- When the MACD line crosses above the signal line → potential bullish signal
- When the MACD line crosses below the signal line → potential bearish signal
The signal line crossover is one of the most commonly used MACD trading signals and forms the basis of many systematic strategies.
3. MACD Histogram
The MACD histogram visually represents the difference between the MACD line and the signal line.
- Formula: Histogram = MACD Line − Signal Line
- Positive bars (above the zero line) indicate the MACD line is above the signal line — bullish momentum.
- Negative bars (below the zero line) indicate bearish momentum.
- The size of the bars reflects the strength of momentum — taller bars mean stronger momentum.
Many traders watch the histogram for shrinking bars, which can signal a momentum reversal before the crossover even occurs.
4. Zero Line (Centerline)
The zero line, also called the centerline, is the horizontal baseline at 0 on the MACD chart. It is the level where the 12-period EMA equals the 26-period EMA.
- Zero line crossover (bullish): MACD line moves from below 0 to above 0 — signals a shift from bearish to bullish trend.
- Zero line crossover (bearish): MACD line moves from above 0 to below 0 — signals a shift from bullish to bearish trend.
Zero line crossovers are considered more significant than signal line crossovers because they represent a true change in market direction rather than just momentum.
5. EMA (Exponential Moving Average)
The Exponential Moving Average is the type of moving average used in all MACD calculations. Unlike a simple moving average (SMA), the EMA assigns greater weight to recent price data, making it more responsive to current market conditions.
The standard MACD settings use three EMAs: the 12-period EMA (fast), the 26-period EMA (slow), and the 9-period EMA of the MACD line (signal). These default settings — 12, 26, 9 — were established by Gerald Appel and remain the most widely used configuration in 2026.
6. Fast EMA (12-Period)
The fast EMA refers to the shorter-period EMA in the MACD calculation — by default, the 12-period EMA. It reacts quickly to recent price changes and drives most of the MACD line's volatility. Traders who prefer more sensitive signals sometimes shorten this to a 8 or 10-period EMA.
7. Slow EMA (26-Period)
The slow EMA is the longer-period EMA — by default, the 26-period EMA. It provides the baseline against which the fast EMA is compared. The gap between the fast and slow EMAs determines whether momentum is increasing or decreasing.
MACD Signal Types: Essential Glossary Terms
8. Bullish Signal Line Crossover
A bullish signal line crossover occurs when the MACD line crosses above the signal line. This is widely interpreted as a buy signal, particularly when the crossover happens below the zero line (indicating potential recovery from oversold conditions).
Example: MSFT trades at $480. The MACD line rises from −3.2 to +0.8, crossing above the signal line at −1.1. A trader using MACD crossovers might initiate a long position here, targeting a move back toward recent highs near $510.
9. Bearish Signal Line Crossover
A bearish signal line crossover occurs when the MACD line crosses below the signal line — a potential sell or short signal, especially when occurring above the zero line after a prolonged uptrend.
10. MACD Divergence
MACD divergence is one of the most powerful concepts in this MACD glossary. It occurs when the price of an asset moves in the opposite direction of the MACD indicator, signaling a potential trend reversal.
- Bullish MACD divergence: Price makes a lower low, but the MACD line (or histogram) makes a higher low. Suggests selling pressure is weakening.
- Bearish MACD divergence: Price makes a higher high, but the MACD line makes a lower high. Suggests buying pressure is fading.
MACD divergence is conceptually similar to RSI divergence. If you want to deepen your divergence analysis skills across multiple indicators, read our guide on RSI Divergence: Mastering Bullish and Bearish Signals.
11. Hidden Divergence
Hidden MACD divergence is a continuation signal rather than a reversal signal. It occurs when price makes a higher low (in an uptrend) but the MACD makes a lower low — or price makes a lower high (in a downtrend) but the MACD makes a higher high.
Hidden divergence confirms that the prevailing trend is likely to continue. This is analogous to hidden RSI divergence — a concept covered in depth in our article on Hidden RSI Divergence: The Advanced Signal Most Traders Miss.
12. Convergence
Convergence (in MACD terminology) refers to the two EMAs moving toward each other. When the fast and slow EMAs converge, the MACD line moves toward zero, and the histogram shrinks. This typically signals that a trend is losing strength.
13. Divergence (EMA Separation)
In the context of the EMAs themselves (rather than price vs. indicator), divergence means the fast and slow EMAs are moving apart. The MACD line moves away from zero, and the histogram grows taller. This indicates accelerating momentum in the current trend direction.
Advanced MACD Glossary Terms
14. MACD Crossover
A MACD crossover is a general term referring to any instance where the MACD line and signal line cross each other. Signal line crossovers are the most watched MACD events because they provide specific entry and exit timing cues.
15. Histogram Reversal
A histogram reversal occurs when MACD histogram bars begin shrinking after a period of growth — or vice versa. This is considered an early warning signal that momentum is shifting, often before an actual signal line crossover. Experienced traders watch for histogram reversals to get earlier entries.
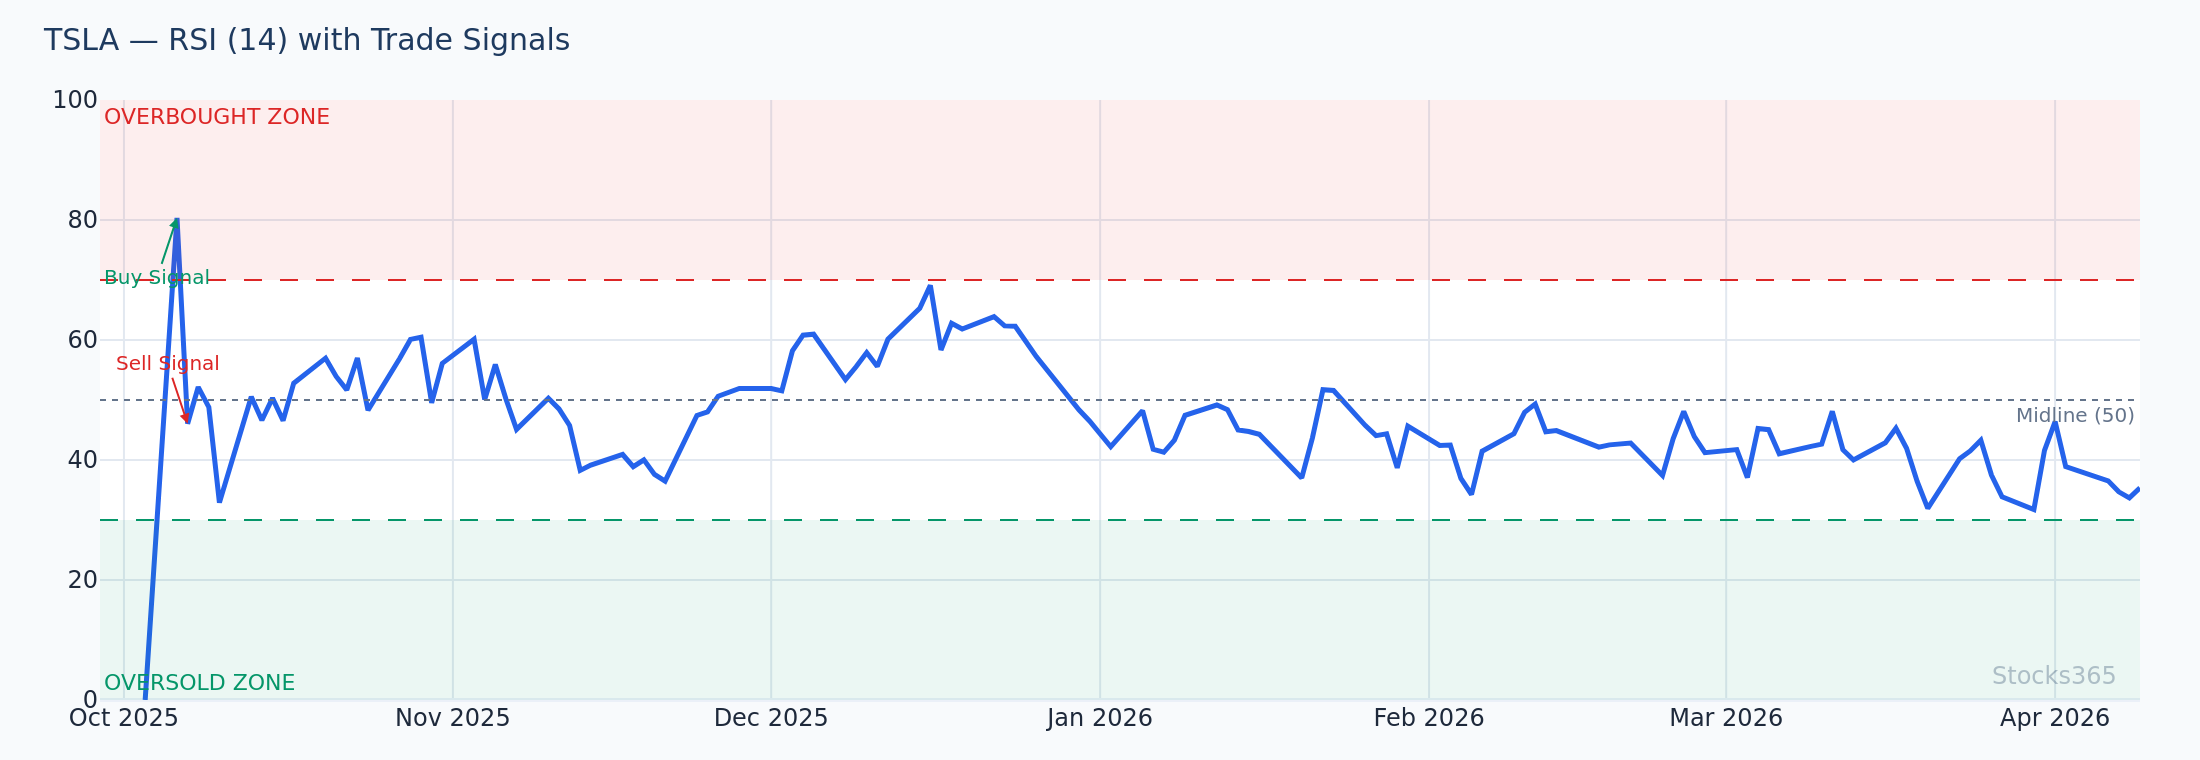
16. Overbought / Oversold (MACD Context)
Unlike RSI, the MACD does not have fixed overbought/oversold levels. However, when the MACD line reaches extreme positive or negative values relative to the asset's historical range, traders treat it as a warning that the move may be overextended.
For fixed-level overbought/oversold analysis, RSI is more precise — see our guide on RSI Overbought and Oversold Levels: Mastering the Signals for comparison.
17. MACD Settings / Parameters
MACD settings refer to the three configurable values: the fast EMA period, slow EMA period, and signal line period. The default is 12, 26, 9, but traders frequently adjust these:
- Day traders may use faster settings like 5, 13, 6 for more responsive signals on intraday charts.
- Swing traders often stick with default 12, 26, 9 on daily charts.
- Position traders may use slower settings like 19, 39, 9 on weekly charts for longer-term trend confirmation.
18. Lagging Indicator
MACD is classified as a lagging indicator because it is based on historical price data (moving averages). It confirms trends that have already begun rather than predicting future price moves. This is why MACD is most effective when used alongside leading indicators or price action analysis.
19. Momentum Indicator
MACD is also a momentum indicator — it measures the speed and strength of price movement, not just direction. The histogram, in particular, shows whether momentum is accelerating or decelerating, which is critical for timing entries and exits.
20. False Signal / Whipsaw
A false signal (or whipsaw) occurs when MACD generates a crossover that quickly reverses, triggering a losing trade. False signals are more common in choppy, sideways markets where the indicator oscillates around the zero line without a clear trend.
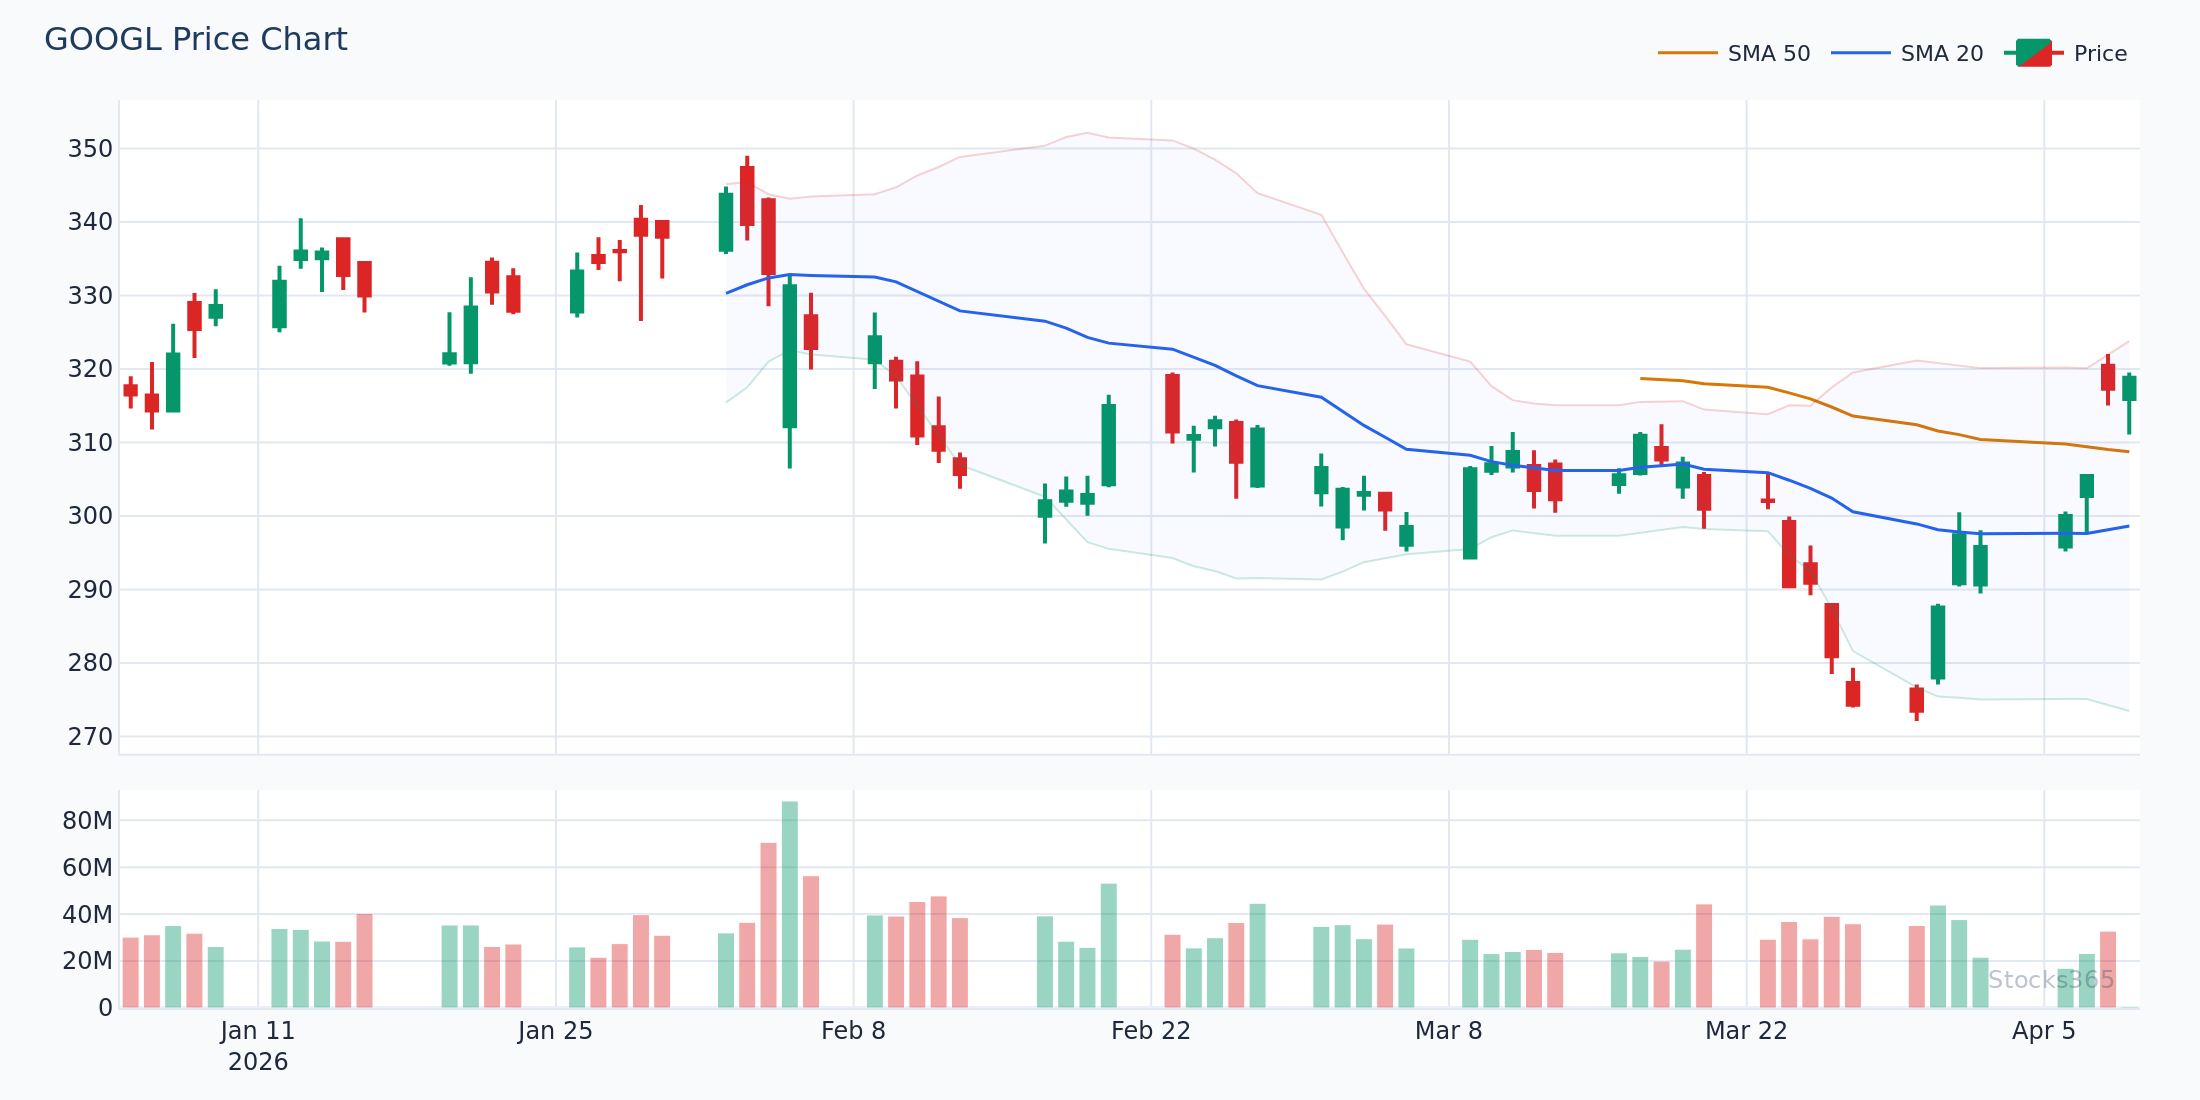
To reduce false signals, many traders require the crossover to occur in a specific price context — for example, a bullish crossover only taken when the price is also above its 50-day SMA.
21. Trend Confirmation
Trend confirmation using MACD involves waiting for the indicator to align with the direction of the prevailing trend before entering a trade. For example:
- In an uptrend: wait for the MACD line to be above the signal line AND above the zero line.
- In a downtrend: wait for the MACD line to be below the signal line AND below the zero line.
This filter eliminates many premature entries and improves overall trade quality.
22. Multi-Timeframe MACD Analysis
Multi-timeframe MACD analysis involves examining MACD signals across multiple chart timeframes simultaneously. A common approach is to use the weekly chart for trend direction, the daily chart for entry timing, and the 4-hour chart for precise entry execution. Alignment across all three timeframes produces the highest-conviction signals.
23. MACD Histogram Divergence
Distinct from MACD line divergence, MACD histogram divergence specifically compares the peaks and troughs of the histogram bars to the peaks and troughs of price. Histogram divergence is considered a more sensitive (and earlier) divergence signal because the histogram responds faster than the MACD line itself.
24. PPO (Percentage Price Oscillator)
The Percentage Price Oscillator (PPO) is closely related to MACD but expresses the difference between the two EMAs as a percentage rather than an absolute value. This makes it easier to compare signals across different assets with very different price levels — for example, comparing MACD signals on a $50 stock vs. a $2,000 stock.
MACD vs. Other Indicators: Key Comparative Terms
Understanding MACD glossary terms is more powerful when you understand how MACD compares with other indicators in your toolkit.
MACD vs. RSI
MACD and RSI are often used together, but they measure different things. MACD measures the relationship between two moving averages (trend and momentum), while RSI measures the magnitude of recent price changes against a fixed scale of 0–100 (momentum and overbought/oversold conditions). Understanding both is essential for well-rounded analysis — explore the detailed breakdown in How to Use RSI in Trading: The Ultimate Step-by-Step Guide.
MACD vs. Stochastic Oscillator
The Stochastic Oscillator, like RSI, is a bounded oscillator (0–100), while MACD is unbounded. The Stochastic is best for identifying overbought/oversold levels in ranging markets, while MACD excels in trending environments. For a direct comparison of RSI and Stochastic, see our RSI vs. Stochastic Oscillator: The Essential Guide.
How Stocks365 Uses MACD Signals in Practice
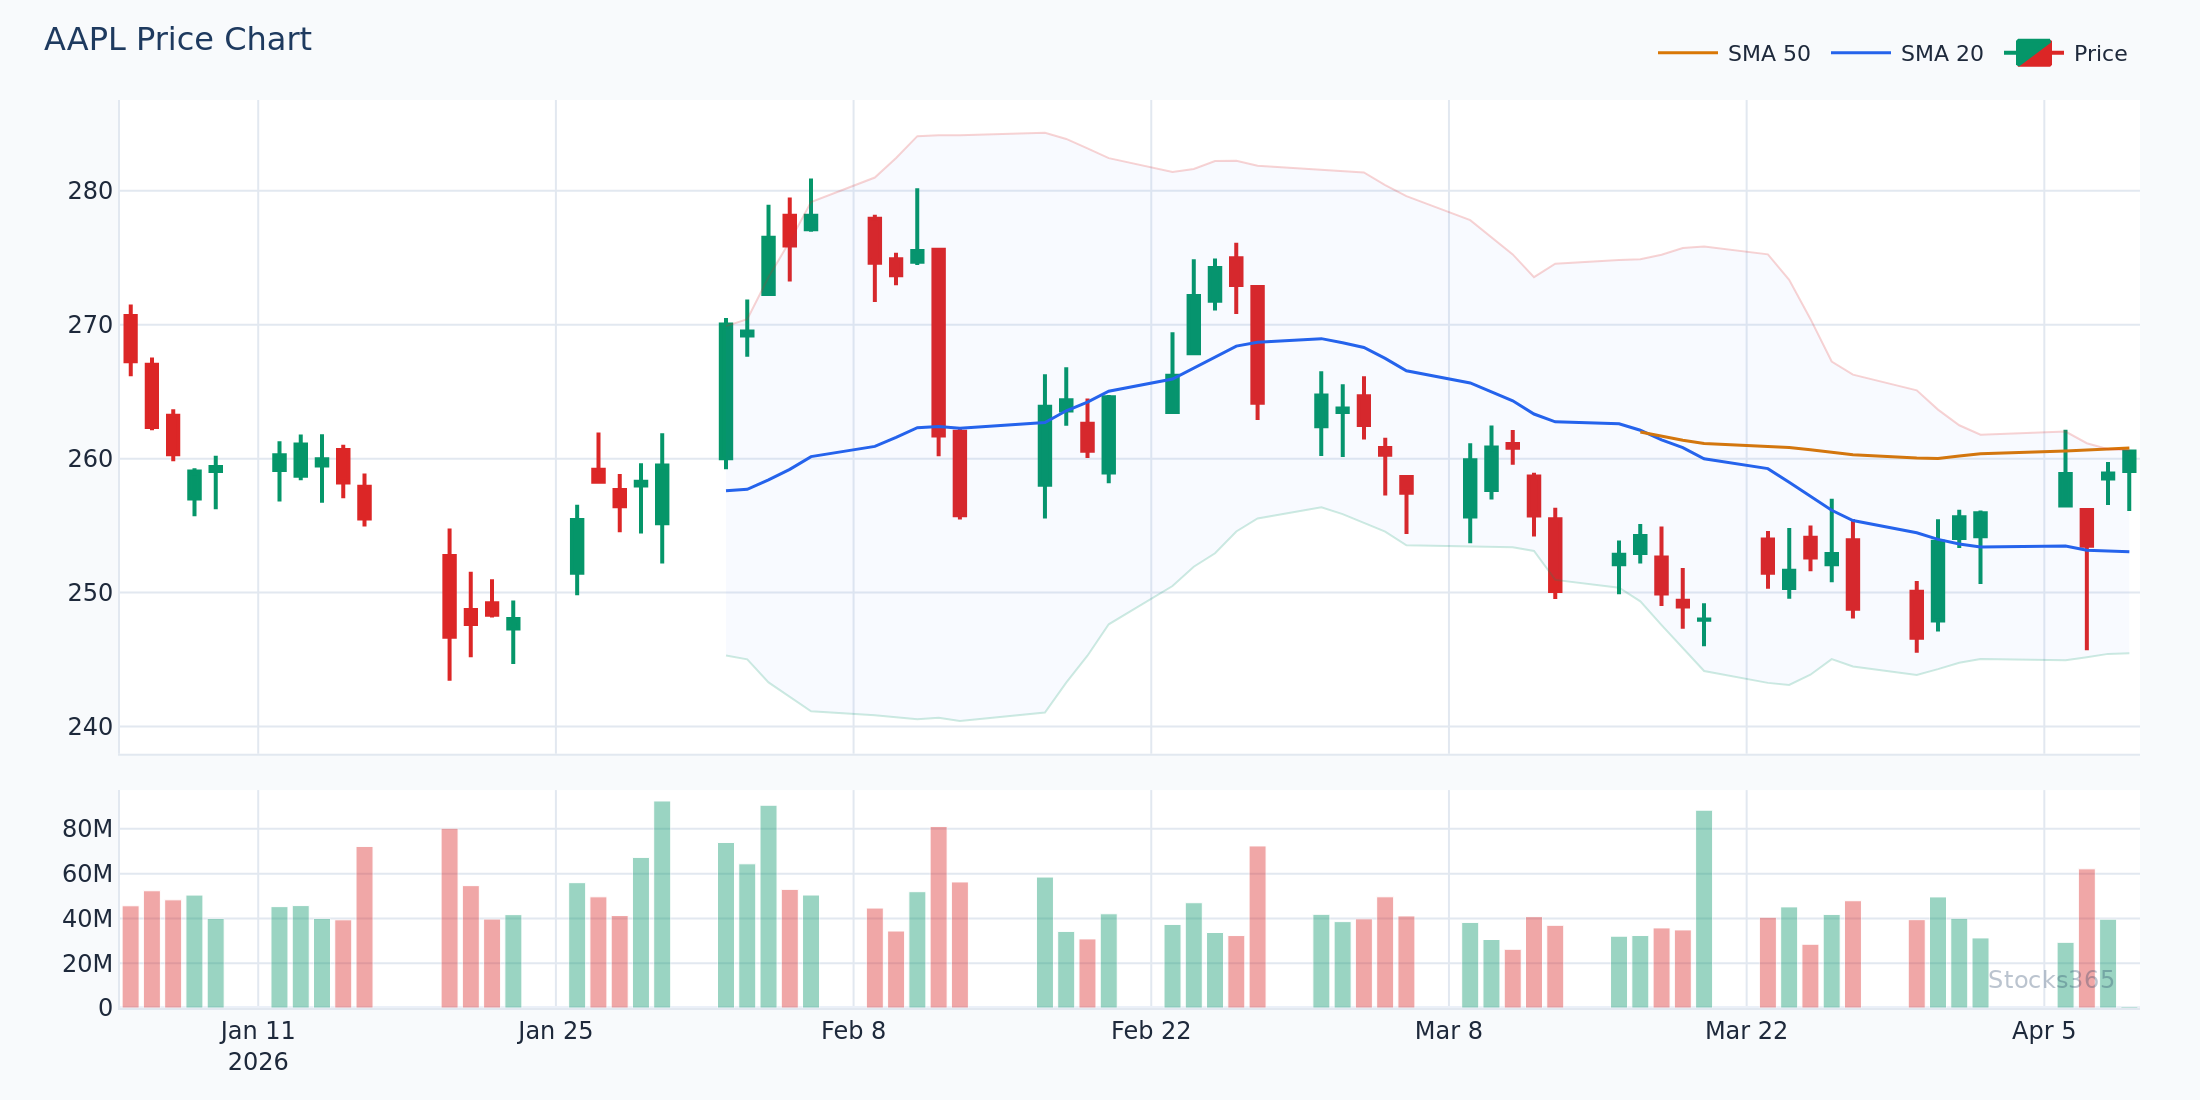
On the Stocks365 signals dashboard, MACD-based signals are integrated into the platform's multi-factor analysis engine. When you view a signal for a stock like AAPL, the platform's Trust Score incorporates MACD crossover strength, histogram momentum, and divergence detection alongside price action, volume data, and other technical factors.
This means you're not just seeing a raw MACD crossover — you're seeing a vetted signal that has been cross-referenced with multiple confirmation layers. The Trust Score helps you quickly assess whether a MACD signal has enough supporting evidence to warrant a position, or whether it's appearing in isolation and may be a higher-risk setup.
Key Takeaways
📊 MACD Glossary: Summary of Essential Terms
- MACD Line: 12-period EMA minus 26-period EMA — the core momentum reading.
- Signal Line: 9-period EMA of the MACD line — used for crossover signals.
- Histogram: Visual difference between MACD line and signal line — shows momentum strength.
- Zero Line: The 0 level — MACD above/below zero indicates bullish/bearish trend bias.
- Bullish/Bearish Crossover: MACD line crossing the signal line — primary entry/exit signal.
- Divergence: Price and MACD moving in opposite directions — powerful reversal warning.
- Hidden Divergence: Trend continuation signal — opposite structure to regular divergence.
- Histogram Reversal: Early momentum shift warning before crossover occurs.
- False Signal / Whipsaw: Common in sideways markets — use filters to reduce impact.
- PPO: Percentage-based variant of MACD — useful for cross-asset comparison.
- Default Settings: 12, 26, 9 — adjustable based on trading style and timeframe.
Frequently Asked Questions
What are the most important MACD glossary terms for beginners?
For beginners, the most critical MACD terms to master first are the MACD line, the signal line, the histogram, and the zero line. Understanding these four components gives you the foundation to read every MACD signal. Once comfortable, move on to divergence and histogram reversals for more advanced analysis.
What does MACD divergence mean in simple terms?
MACD divergence means that the price chart and the MACD indicator are telling different stories. For example, if a stock's price keeps making new highs but the MACD histogram peaks are getting shorter each time, that's bearish divergence — the uptrend may be running out of fuel even though price is still rising. It's a warning sign to tighten stop-losses or prepare for a potential reversal.
What is the difference between the MACD line and the signal line?
The MACD line is calculated directly from two EMAs of price (12-period EMA minus 26-period EMA). The signal line is a 9-period EMA applied to the MACD line itself — it smooths out the MACD line's movements. When the MACD line crosses the signal line, it generates a buy or sell signal. Think of the MACD line as the faster, more reactive component and the signal line as the slower confirmation trigger.
Can MACD be used on any timeframe?
Yes — MACD can be applied to any timeframe, from 1-minute intraday charts to monthly long-term charts. However, the default settings (12, 26, 9) were originally designed for daily charts. For shorter timeframes, consider adjusting to faster settings (e.g., 5, 13, 6) to reduce lag. For longer timeframes, slower settings (e.g., 19, 39, 9) can filter out short-term noise and keep you focused on major trend shifts.
How does MACD compare to RSI for trading signals?
MACD and RSI complement each other well because they measure different aspects of price behavior. MACD excels at identifying trend direction and momentum shifts via crossovers and divergence. RSI is better at identifying overbought and oversold conditions with its 0–100 scale. Using both together — for example, taking MACD bullish crossovers only when RSI is not overbought — can significantly improve signal quality. For deeper RSI knowledge, explore our guide on RSI Settings: Mastering the Best Period for Your Strategy.