
Why Multi-Timeframe RSI Analysis Separates Professionals from Amateurs
Most retail traders make a critical mistake: they analyze a single chart timeframe and act on whatever the RSI shows in that isolated window. Professional traders do something fundamentally different. They read the same instrument across multiple timeframes simultaneously, using the Relative Strength Index as a layered confirmation tool that dramatically improves signal quality and trade timing.
This technique — known as multi timeframe RSI analysis — is one of the highest-leverage skills you can develop as an active trader. It doesn't require exotic indicators or complex algorithms. It requires a disciplined process of zooming out, reading momentum at scale, and only entering trades when multiple timeframes agree.
If you're new to the RSI itself, we recommend starting with What Is RSI? The Complete Beginner's Guide before diving into this advanced framework. For those already familiar with the basics, let's go deep.
The Core Concept: Timeframe Hierarchy in RSI Trading
Every market moves in nested cycles. A daily uptrend contains dozens of 1-hour pullbacks. A weekly bull market contains multiple daily corrections. Multi timeframe RSI analysis exploits this natural structure by establishing a top-down hierarchy:
- Higher timeframe (HTF): Defines the dominant trend and primary momentum direction
- Intermediate timeframe (ITF): Identifies the trading opportunity or setup
- Lower timeframe (LTF): Pinpoints the precise entry trigger
The golden rule is simple: only take trades in the direction of the higher timeframe RSI momentum. When all three timeframes align, you have a high-probability confluence zone that professionals call a timeframe stack.
Professional Insight: A trade with RSI alignment across three timeframes has statistically higher win rates than a single-timeframe RSI signal alone. The additional timeframes act as filters, eliminating noise and false breakouts.
Understanding RSI Across Different Timeframes
What RSI Reveals at Each Timeframe Level
The RSI calculation doesn't change — it always measures the ratio of average gains to average losses over a specified period. What changes is the significance of the reading. To understand the mechanics behind the number, see our detailed breakdown of How RSI Is Calculated: Formula Explained Step by Step.
- Weekly RSI: Reflects institutional-grade momentum. A weekly RSI above 50 means the asset is in a macro bullish phase. These signals move slowly but carry enormous weight.
- Daily RSI: The workhorse timeframe for swing traders. Daily RSI overbought/oversold levels directly influence multi-day price swings.
- 4-Hour RSI: Excellent for identifying intermediate setups within a daily trend. Popular among both swing and intraday traders.
- 1-Hour RSI: Used for entry refinement. A pullback to RSI 40 on the 1-hour during a daily uptrend is a textbook buying opportunity.
- 15-Minute RSI: Precision entry timing for day traders. Only meaningful when higher timeframes provide directional context.
The Three-Timeframe RSI Framework: Step-by-Step
Step 1 — Establish Higher Timeframe Bias
Open the weekly or daily chart for your instrument. Read the RSI (standard 14-period setting — see RSI Settings: Master the Best Period for Your Strategy for optimization guidance).
- If weekly RSI is above 50 and rising → macro bullish bias, look for long setups only
- If weekly RSI is below 50 and falling → macro bearish bias, look for short setups only
- If weekly RSI is between 45–55 → neutral zone, reduce position sizing or wait for clarity
Step 2 — Identify the Setup on the Intermediate Timeframe
Drop to the daily or 4-hour chart. Here you're looking for an RSI-based setup that aligns with your HTF bias. The most powerful patterns include:
- Oversold pullback in an uptrend: Daily RSI dips toward 30–40 while weekly RSI remains above 55. This is a textbook buy-the-dip signal.
- RSI momentum break: Daily RSI crosses above 50 after a consolidation phase, confirming trend resumption.
- RSI divergence: Bearish divergence on the daily while weekly RSI is overbought signals a high-probability reversal. For a deep dive on this, read our guide on RSI Divergence Explained: Master Bullish & Bearish Signals.
Step 3 — Time the Entry on the Lower Timeframe
Once the HTF bias and ITF setup are confirmed, drop to the 1-hour or 15-minute chart to find your trigger. At this level, you're looking for:
- RSI crossing back above 30 (confirming oversold reversal)
- RSI crossing above 50 (confirming intraday momentum shift)
- Hidden bullish RSI divergence on the LTF (see Hidden RSI Divergence: The Advanced Signal Most Traders Miss)
This three-step cascade ensures you're never fighting the dominant trend. You're joining it at the most favorable moment.
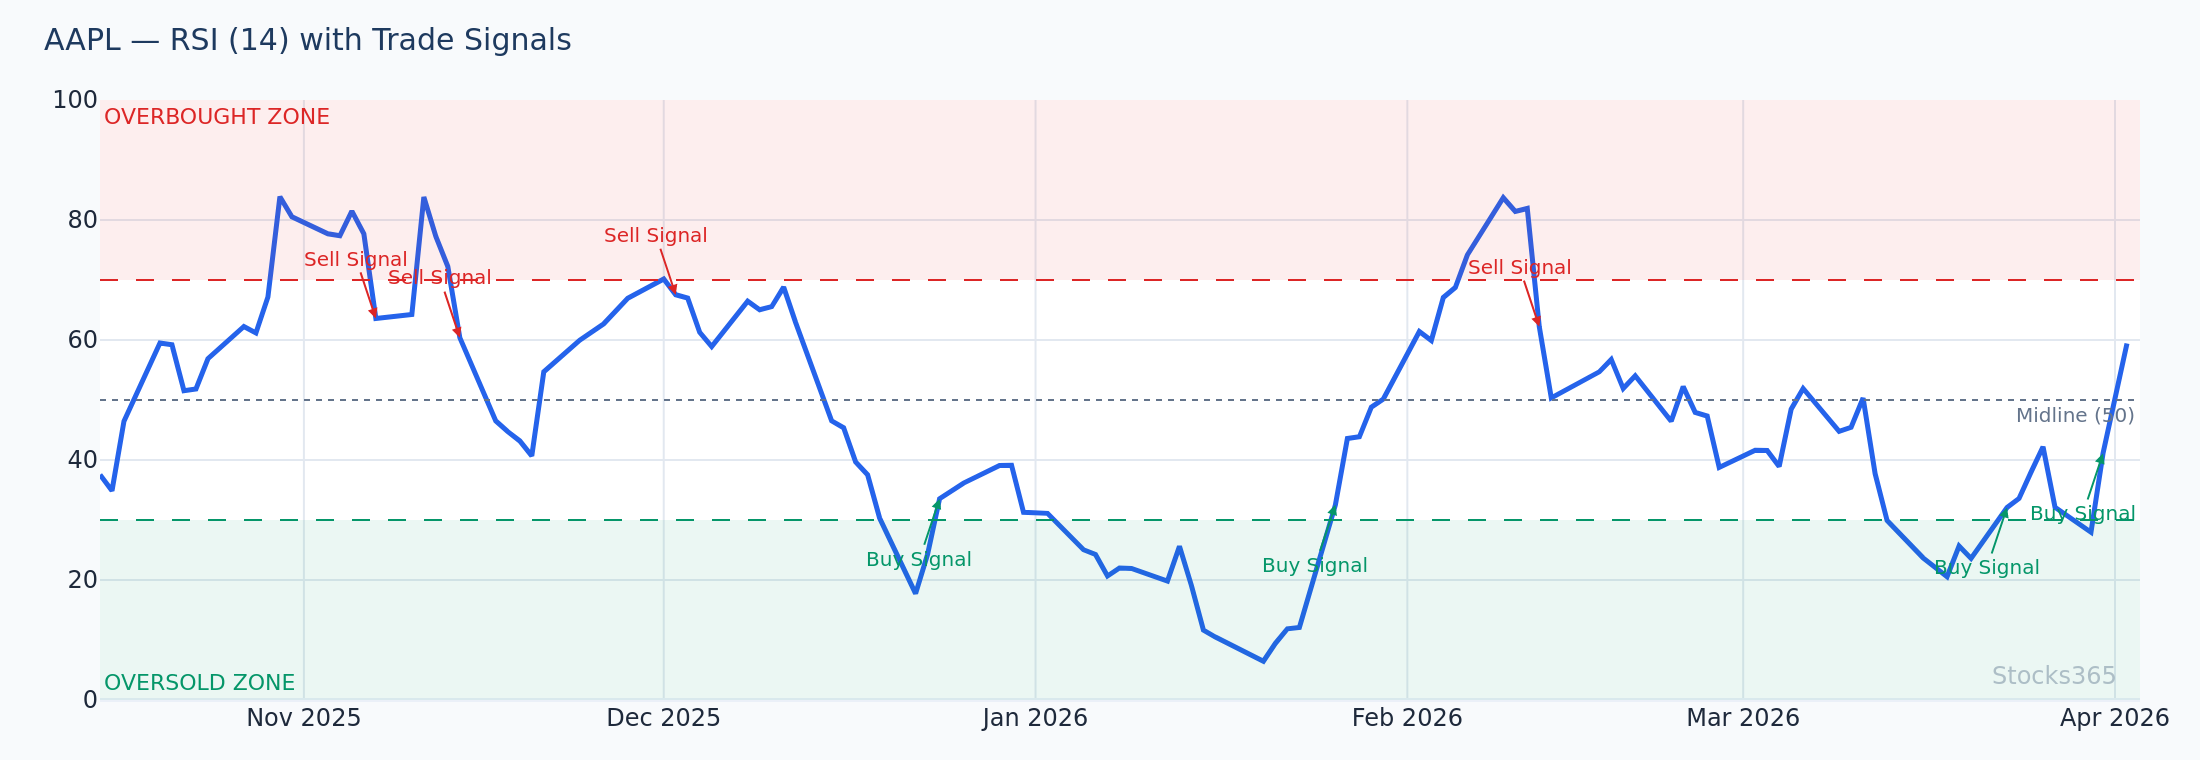
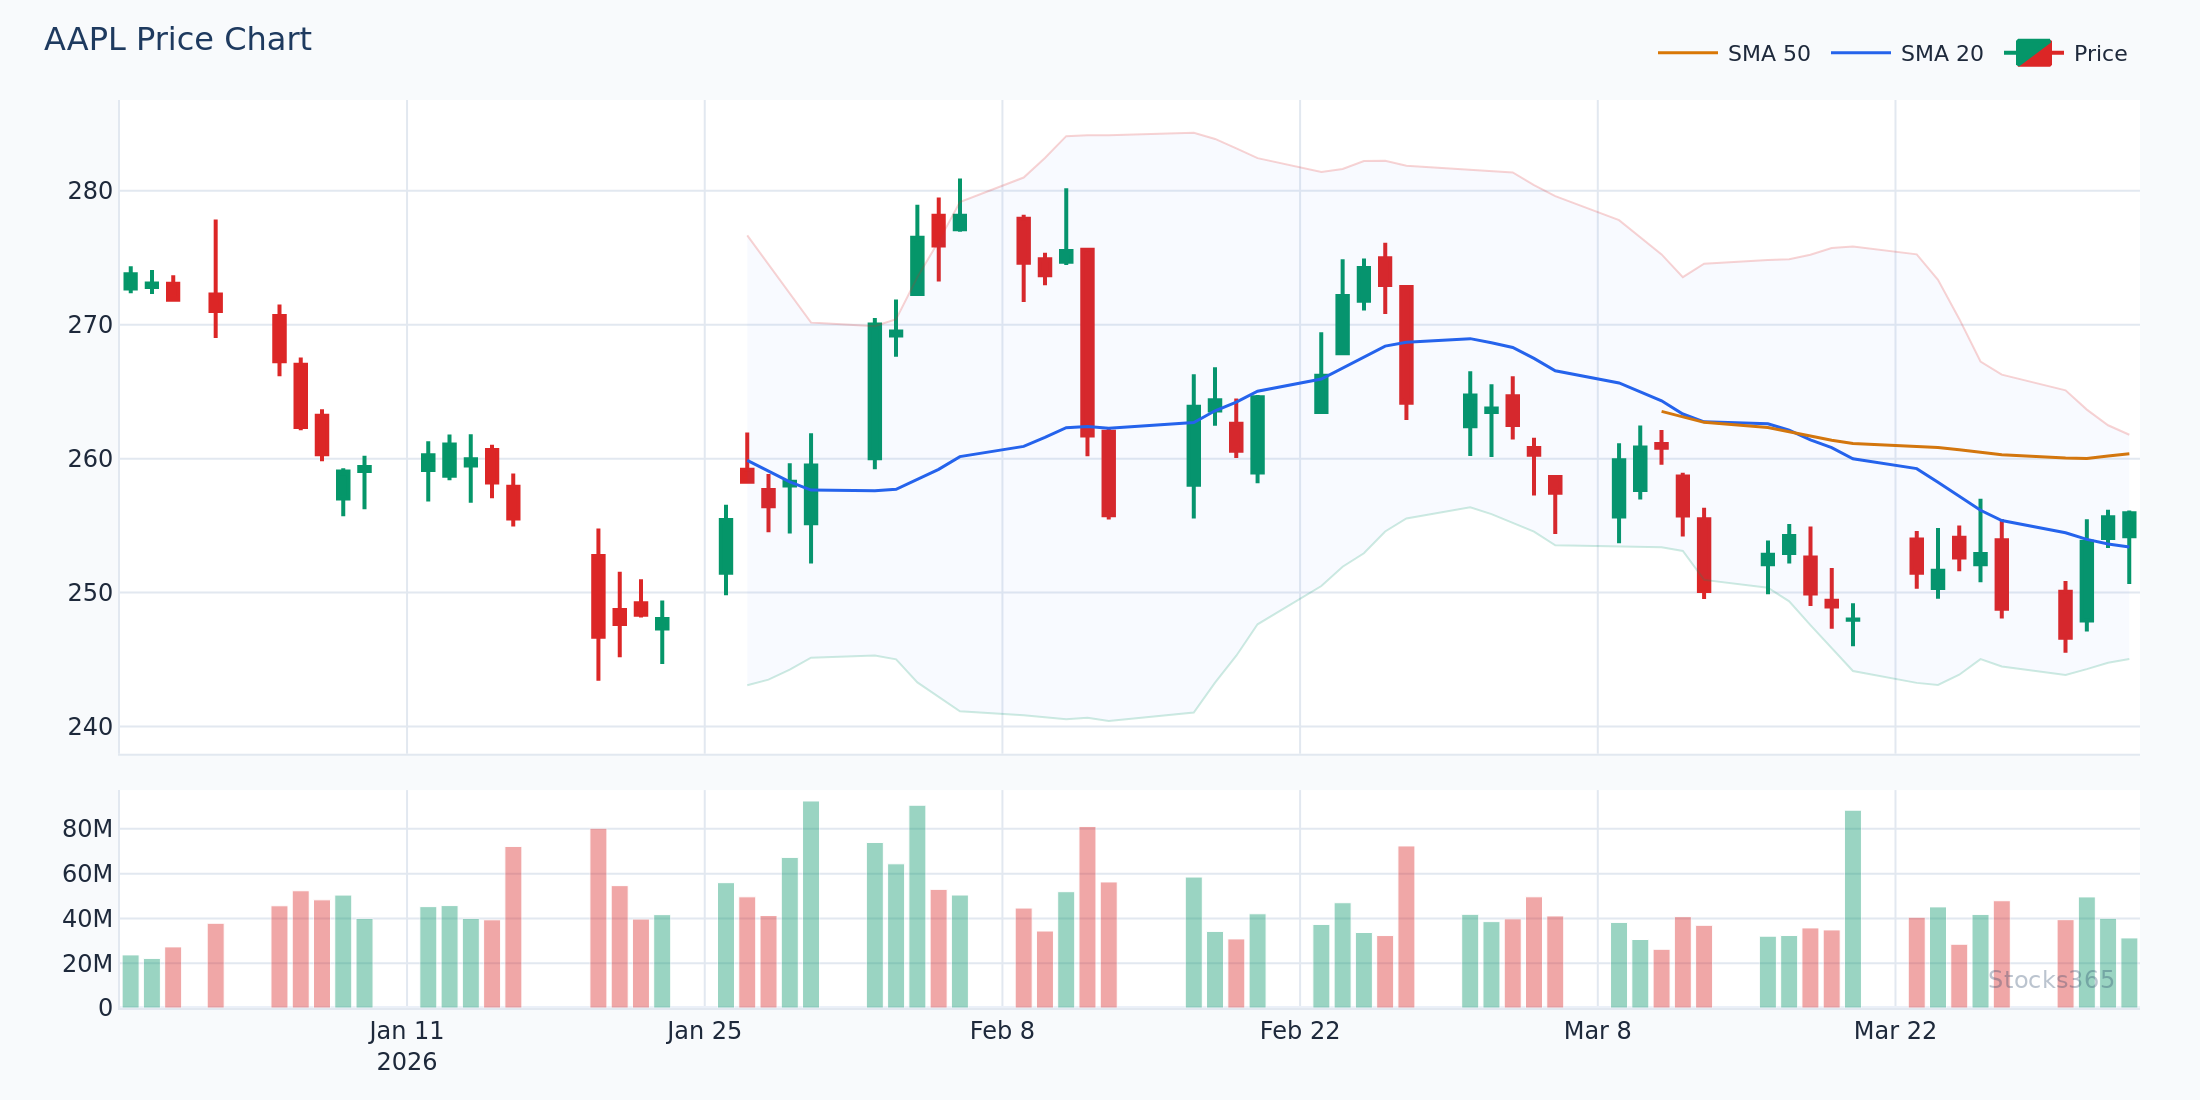
Practical Trading Example: Multi-Timeframe RSI on AAPL
Let's walk through a real-world scenario to make this concrete. Imagine it's early 2026 and AAPL is trading around $218.
- Weekly RSI: Reading 62 — solidly above 50, trending upward. Macro bullish bias confirmed. Only long trades qualify.
- Daily RSI: Has pulled back to 42 after a short-term correction from $228 to $218. This is a classic mid-trend pullback in a healthy uptrend. The daily RSI is approaching the 40-level support zone that has held three times in the past six months.
- 1-Hour RSI: Just crossed back above 35 and is recovering toward 50. Intraday momentum is shifting from bearish to neutral-bullish.
The trade setup: Enter long at $218.50 with a stop loss at $214.20 (below recent swing low). Target $227–$229 based on the prior highs. Risk-reward ratio of approximately 1:2.2.
The Stocks365 AAPL signal dashboard would show the trust score for this setup incorporating all three timeframe readings. When all timeframes align like this, the platform's trust score typically registers in the high-confidence range, giving traders additional algorithmic confirmation before executing.
Multi-Timeframe RSI Overbought and Oversold Levels
Understanding how overbought and oversold levels behave differently across timeframes is critical. The same RSI reading carries different implications depending on the timeframe. For foundational knowledge on these levels, visit our comprehensive guide on RSI Overbought and Oversold Levels: Master the Signals.
Key Behavioral Differences by Timeframe
- Weekly RSI above 70: Does NOT automatically signal a sell. In strong bull markets, weekly RSI can remain above 70 for extended periods (sometimes months). Treat it as a caution zone, not an immediate reversal signal.
- Daily RSI above 70: More actionable for swing traders. Begin watching for bearish divergence or momentum failure. Combine with HTF context — if weekly RSI is also stretched, reversal risk is elevated.
- 1-Hour RSI above 70: In a strong uptrend, this is often a continuation signal rather than a reversal. Counter-trend shorts based solely on 1-hour overbought readings frequently get stopped out in trending markets.
- Daily RSI below 30: Powerful mean-reversion signal when weekly RSI is above 50. This combination represents institutions selling temporarily into an ongoing bull trend — the exact condition smart money exploits.
Multi-Timeframe RSI Divergence: The Advanced Application
Divergence becomes exponentially more powerful when confirmed across timeframes. A bearish divergence appearing on both the daily and 4-hour chart simultaneously — while the weekly RSI is overbought — creates what professionals call a multi-timeframe divergence confluence. These are among the highest-probability reversal signals available to technical traders.
Example: TSLA Multi-Timeframe Bearish Divergence
Consider a scenario where TSLA is making a new price high at $340 but the daily RSI is printing a lower high at 68 (compared to a prior 78 reading at the previous price peak). The 4-hour chart shows an identical pattern — price making higher highs while RSI makes lower highs. Meanwhile, the weekly RSI is at 71 and showing early signs of rolling over.
This triple-timeframe bearish divergence signal suggests significant institutional distribution. A short position entered near $340 with a stop above $348 could target $315–$320, offering a strong risk-adjusted trade.
Combining Multi-Timeframe RSI with Other Indicators
RSI + Moving Averages
When higher timeframe RSI momentum aligns with a moving average crossover on the intermediate timeframe, confluence increases significantly. A daily 50/200 EMA golden cross occurring while weekly RSI is above 55 and daily RSI is recovering from 40 is a textbook institutional accumulation signal.
RSI vs. Other Momentum Oscillators
Many traders ask whether RSI or the Stochastic Oscillator is more effective for multi-timeframe analysis. Both have merits — our in-depth RSI vs Stochastic Oscillator guide compares them directly. For multi-timeframe work, RSI typically provides cleaner signals on higher timeframes due to its smoother calculation methodology.
Integrating with Stocks365 Trust Scores
The Stocks365 signals dashboard aggregates RSI readings, trend context, and momentum data across timeframes automatically. Rather than manually switching between charts, the platform's trust score system synthesizes multi-timeframe confluence into a single actionable score — allowing traders to identify high-probability setups in seconds rather than minutes.
Common Mistakes in Multi-Timeframe RSI Analysis
- Ignoring HTF conflict: Taking a daily RSI buy signal when the weekly RSI is below 40 and falling. This trades against the dominant current — the single most common error.
- Paralysis by analysis: Requiring perfect alignment on five timeframes before acting. Three timeframes are sufficient; adding more creates hesitation, not precision.
- Using identical RSI periods on all timeframes: A 14-period RSI on the weekly captures nearly three months of data. On the 15-minute chart, it covers only 3.5 hours. Consider adjusting periods slightly by timeframe — our RSI settings guide covers optimal configurations.
- Abandoning the process after a loss: No method wins 100% of the time. Multi-timeframe RSI analysis improves your statistical edge — it does not eliminate risk. Maintain discipline across a sample size of at least 20–30 trades before evaluating performance.
- Confusing timeframe zoom with timeframe switch: Scrolling back in time on a single chart is not the same as analyzing a genuinely higher timeframe. Always use the actual weekly, daily, and 4-hour chart views.
Building Your Multi-Timeframe RSI Trading Plan
For traders new to this technique, here's a structured 5-day implementation plan:
- Day 1–2: Review How to Use RSI in Trading: The Ultimate Step-by-Step Guide to solidify single-timeframe foundations before layering complexity.
- Day 3: Apply the three-timeframe framework in paper trading mode. Use MSFT, GOOGL, or AMZN as practice instruments — liquid, well-followed stocks with clear technical behavior.
- Day 4: Review 10 historical multi-timeframe setups on your chosen instruments. Identify where all three timeframes aligned and what price did afterward.
- Day 5: Establish your personal rules: which three timeframes you'll use (daily/4H/1H or weekly/daily/4H), what RSI levels constitute a valid setup, and what your stop-loss and target methodology will be.
📊 Key Takeaways: Multi-Timeframe RSI Analysis
- Always establish HTF bias first — weekly or daily RSI sets the directional filter. Never trade against it.
- Use the intermediate timeframe (daily or 4-hour) to identify your setup and the lower timeframe to time precise entries.
- RSI readings carry different weight at different timeframes — weekly overbought ≠ immediate sell signal; daily oversold in a weekly uptrend = powerful buy opportunity.
- Multi-timeframe RSI divergence is among the highest-probability setups available — treat it with extra conviction when it appears.
- Three timeframes is the sweet spot — more creates analysis paralysis, fewer reduces filtering effectiveness.
- Combine with the Stocks365 trust score system to validate confluence algorithmically before committing capital.
Frequently Asked Questions
What is the best combination of timeframes for multi-timeframe RSI analysis?
The most commonly used professional combination is Weekly / Daily / 4-Hour for swing traders, and Daily / 4-Hour / 1-Hour for active intraday-swing hybrid traders. Pure day traders often use 4-Hour / 1-Hour / 15-Minute. The key is maintaining a consistent ratio — each timeframe should be approximately 4–6x shorter than the one above it.
Does multi-timeframe RSI analysis work in crypto and forex markets?
Yes — in fact, multi timeframe RSI analysis is arguably more powerful in 24/7 markets like crypto and forex because these markets are more prone to false breakouts on lower timeframes. Higher timeframe RSI confirmation filters out much of the noise inherent in these volatile asset classes. The same three-step framework applies directly to BTC, ETH, EUR/USD, and other liquid pairs.
Should I use the same RSI period (14) on all timeframes?
The standard 14-period RSI works well across all timeframes and is recommended for consistency, especially when starting out. However, some professionals use a slightly shorter period (9–11) on lower timeframes for more sensitivity to intraday moves, and a slightly longer period (21) on weekly charts for smoother trend reading. For detailed guidance, see our RSI Settings guide.
How do I handle conflicting RSI signals across timeframes?
Conflicting signals are a feature, not a bug — they tell you the market is in a contested zone with no clear dominant momentum. The professional response is to reduce position size or stand aside entirely until alignment improves. Forcing trades during timeframe conflict is one of the leading causes of avoidable losses. Patience during conflict is itself an edge.
Can I use multi-timeframe RSI analysis with automated trading tools?
Absolutely. The Stocks365 signals dashboard is designed to surface exactly these kinds of multi-timeframe confluence setups algorithmically. Rather than manually scanning charts across timeframes, the platform processes RSI data across multiple timeframes and presents the trust score for each signal — enabling faster, more confident decision-making. Individual stock pages like AAPL show real-time signal strength incorporating timeframe context.