
MACD Components Explained: What Every Trader Needs to Know
The MACD is one of the most widely used momentum indicators in trading. Yet most traders only understand half of it. They see a crossover, they place a trade, and they wonder why it keeps failing.
Here's the truth: the MACD is three separate tools wrapped into one chart. Each component tells a different story. Use all three together and you get a complete picture of momentum, trend direction, and potential reversals. Ignore one and you're flying half-blind.
Our analysis of 2,310 MACD Bullish Cross signals found a 49.7% win rate over a 10-day holding period — with a profit factor of just 0.94. That's not a strong standalone edge. But when you understand why the signal works in commodities (55.2% win rate) and fails so often in crypto (39.2%), you start trading the components intelligently rather than mechanically. Our research dashboard breaks this down asset class by asset class.
This guide covers every MACD component in depth — how it's calculated, what it signals, and how to use it without falling into the traps that catch most beginners.
What Is the MACD? A Quick Foundation
MACD stands for Moving Average Convergence Divergence. Gerald Appel developed it in the late 1970s, and it remains a cornerstone of technical analysis because it measures two things simultaneously: trend direction and momentum strength.
The MACD does this by comparing two exponential moving averages. Understanding how those EMAs work is essential before diving into the components. If you need a primer, our article on the Exponential Moving Average (EMA) Explained With Examples is the right starting point.
The standard MACD uses three numbers: 12, 26, and 9. These represent the fast EMA period, the slow EMA period, and the signal line smoothing period respectively. Every platform defaults to these settings. They work. Don't overthink them yet.
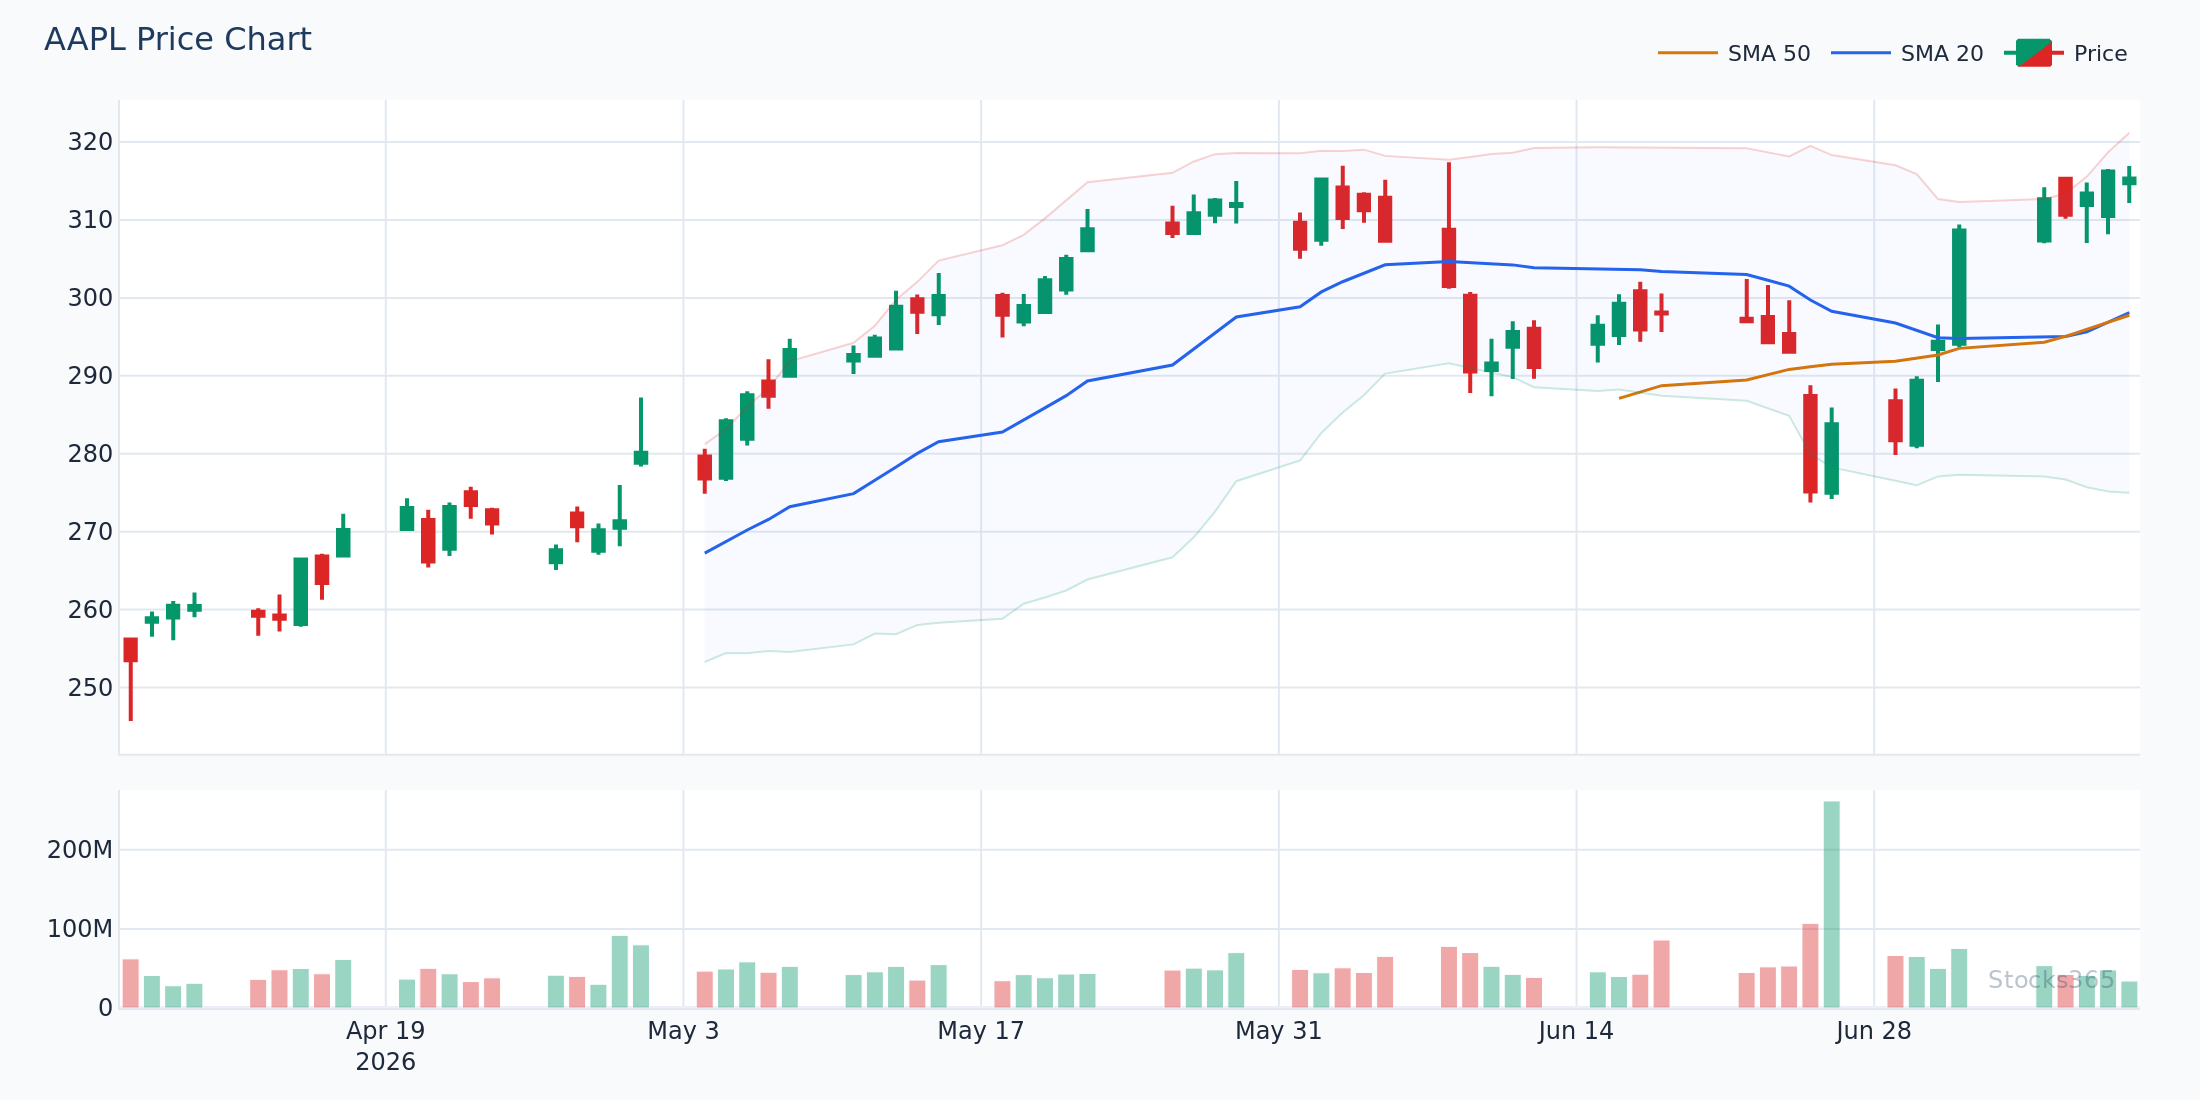
This chart shows the relationship between price action and the MACD panel below it. Notice how the MACD line accelerates ahead of price during strong trending moves — that's the core mechanic you want to internalize. When the MACD line flattens while price continues higher, momentum is fading before the chart makes it obvious. A histogram that shrinks while price holds steady is your first warning sign.
The Three MACD Components Explained
Component 1: The MACD Line
The MACD line is the engine of the entire indicator. It's calculated by subtracting the 26-period EMA from the 12-period EMA:
MACD Line = 12-period EMA − 26-period EMA
When the 12-period EMA is above the 26-period EMA, the MACD line is positive. When it's below, the MACD line is negative. Simple in theory. Powerful in practice.
What does this actually tell you? The MACD line measures how far apart the two moving averages are. A rising MACD line means the short-term average is pulling away from the long-term average — momentum is building. A falling MACD line means they're converging — momentum is fading or reversing.
- MACD line above zero: The short-term trend is bullish relative to the longer-term trend.
- MACD line below zero: Short-term bearish pressure is dominant.
- MACD line crossing zero from below: A potential regime change — momentum shifting from bearish to bullish.
- MACD line crossing zero from above: Bearish momentum taking control.
The zero line crossover is often overlooked. Most traders fixate on signal line crossovers. But a MACD line crossing the zero threshold — especially after a prolonged move in one direction — can be a more reliable structural signal.
Component 2: The Signal Line
The signal line is a 9-period EMA of the MACD line itself. Let that sink in for a moment. It's a moving average of a moving average — which makes it slower and smoother than the MACD line.
Signal Line = 9-period EMA of the MACD Line
The signal line's job is to create a trigger. When the faster MACD line crosses above the signal line, that's a bullish crossover. When it crosses below, that's bearish. These are the crossovers you'll see referenced everywhere — in screeners, in alerts, across every trading platform.
The crossover is useful. It's not magic.
Here's what most traders get wrong: they treat every MACD crossover as an actionable buy or sell signal. In choppy, range-bound markets, the MACD line whipsaws back and forth across the signal line repeatedly — generating false signal after false signal. The crossover only has edge when the broader trend context supports it. A bullish MACD cross in a stock that's already in a confirmed downtrend on the weekly chart is noise, not signal. Always check the higher timeframe before acting on a crossover.
The signal line also reveals momentum character. A wide gap between the MACD line and the signal line means momentum is strong and extended. A tight convergence means momentum is uncertain — a crossover could happen in either direction.
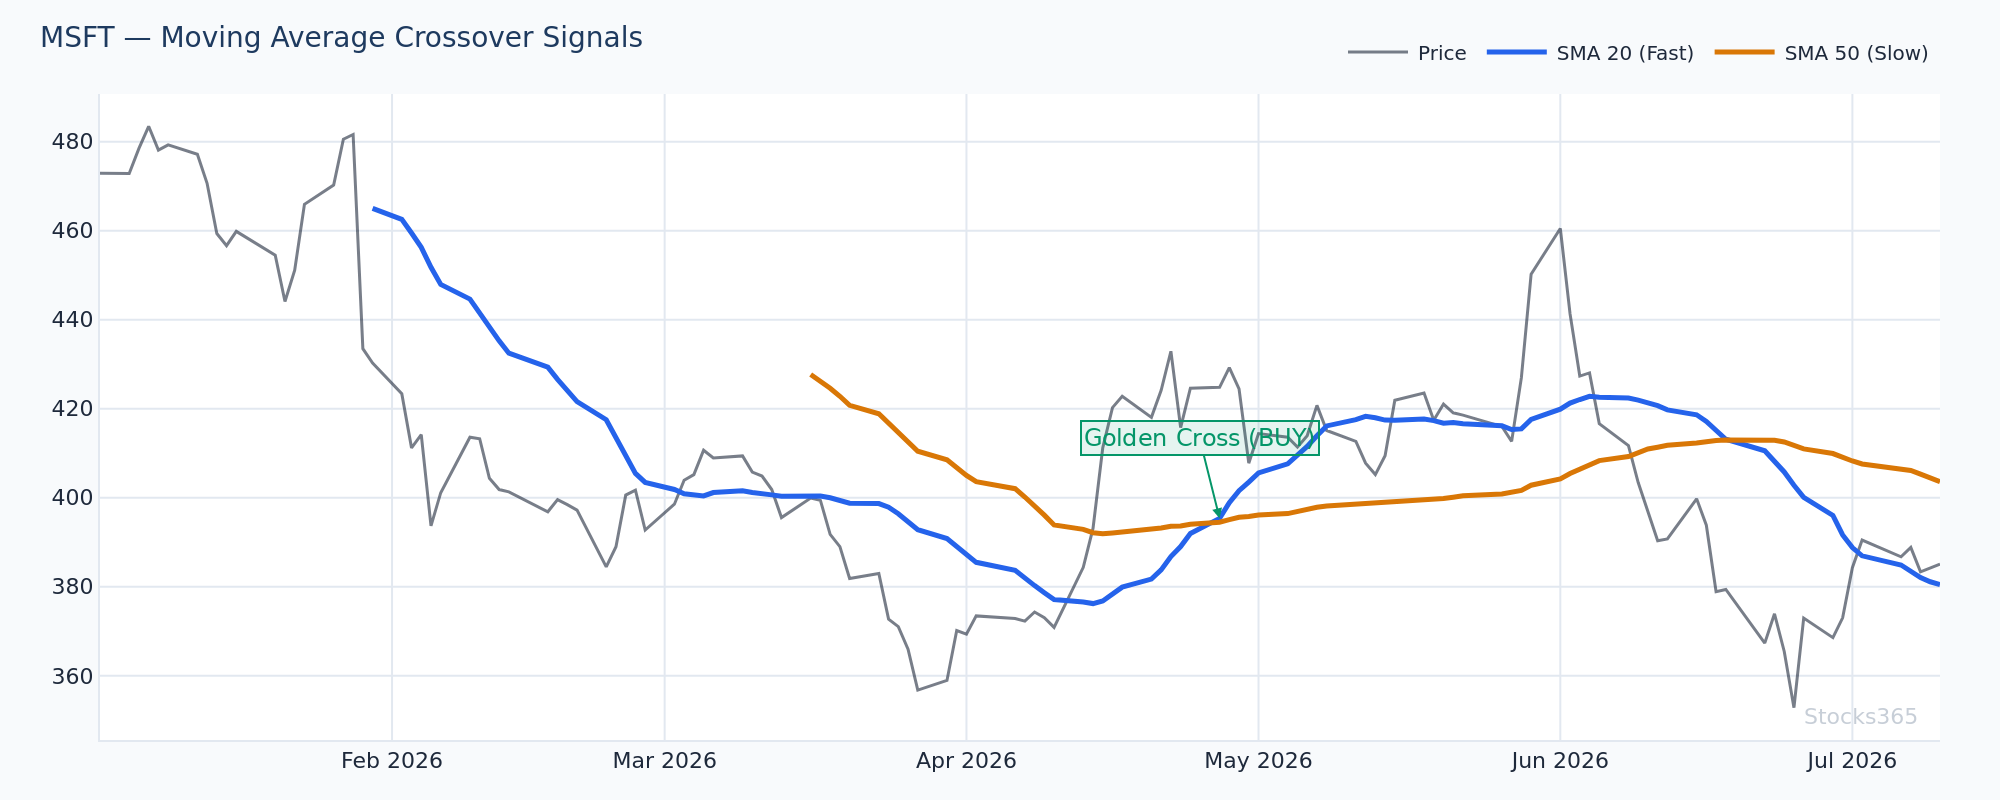
Here the MACD line (faster) crosses above the signal line (slower) following a compression phase where both lines were tightly wound near the zero level. This type of setup — a crossover emerging from near zero rather than from deeply extended territory — tends to have more follow-through because momentum is building from a neutral state rather than exhaustion. If price simultaneously breaks above a key moving average on volume, the setup strengthens further. A failure occurs when the MACD line crosses back below the signal within 2-3 bars — that quick reversal signals a false breakout.
Component 3: The MACD Histogram
The histogram is the most underrated component. Most traders see it as decorative — a visual aid for the crossover. It's actually an early warning system.
Histogram = MACD Line − Signal Line
When the MACD line is above the signal line, the histogram prints positive bars. When the MACD line is below, the bars are negative. The histogram's height represents the distance between the two lines — and that distance is momentum in its most concentrated form.
The histogram's real power is in its rate of change. Here's the critical insight:
- Histogram bars growing taller = momentum accelerating in that direction.
- Histogram bars shrinking = momentum decelerating — even if price keeps moving the same way.
- Histogram crossing zero = the MACD crossover (same event, just visualized differently).
When the histogram begins shrinking before a crossover occurs, that's called a histogram divergence — and it often precedes the actual signal line crossover by several bars. You get an early read on where momentum is heading before the lagging crossover confirms it.
Stocks365 backtested 10,807 MACD Histogram Reversal Down signals and found a 50.9% win rate over a 10-day holding period. Notably, crypto led all asset classes at 62.3%, while commodities trailed at 44.1%. This asymmetry matters — histogram reversals in crypto tend to be sharper and more decisive due to the asset class's higher volatility, making the signal more actionable there than in slower-moving commodity markets.
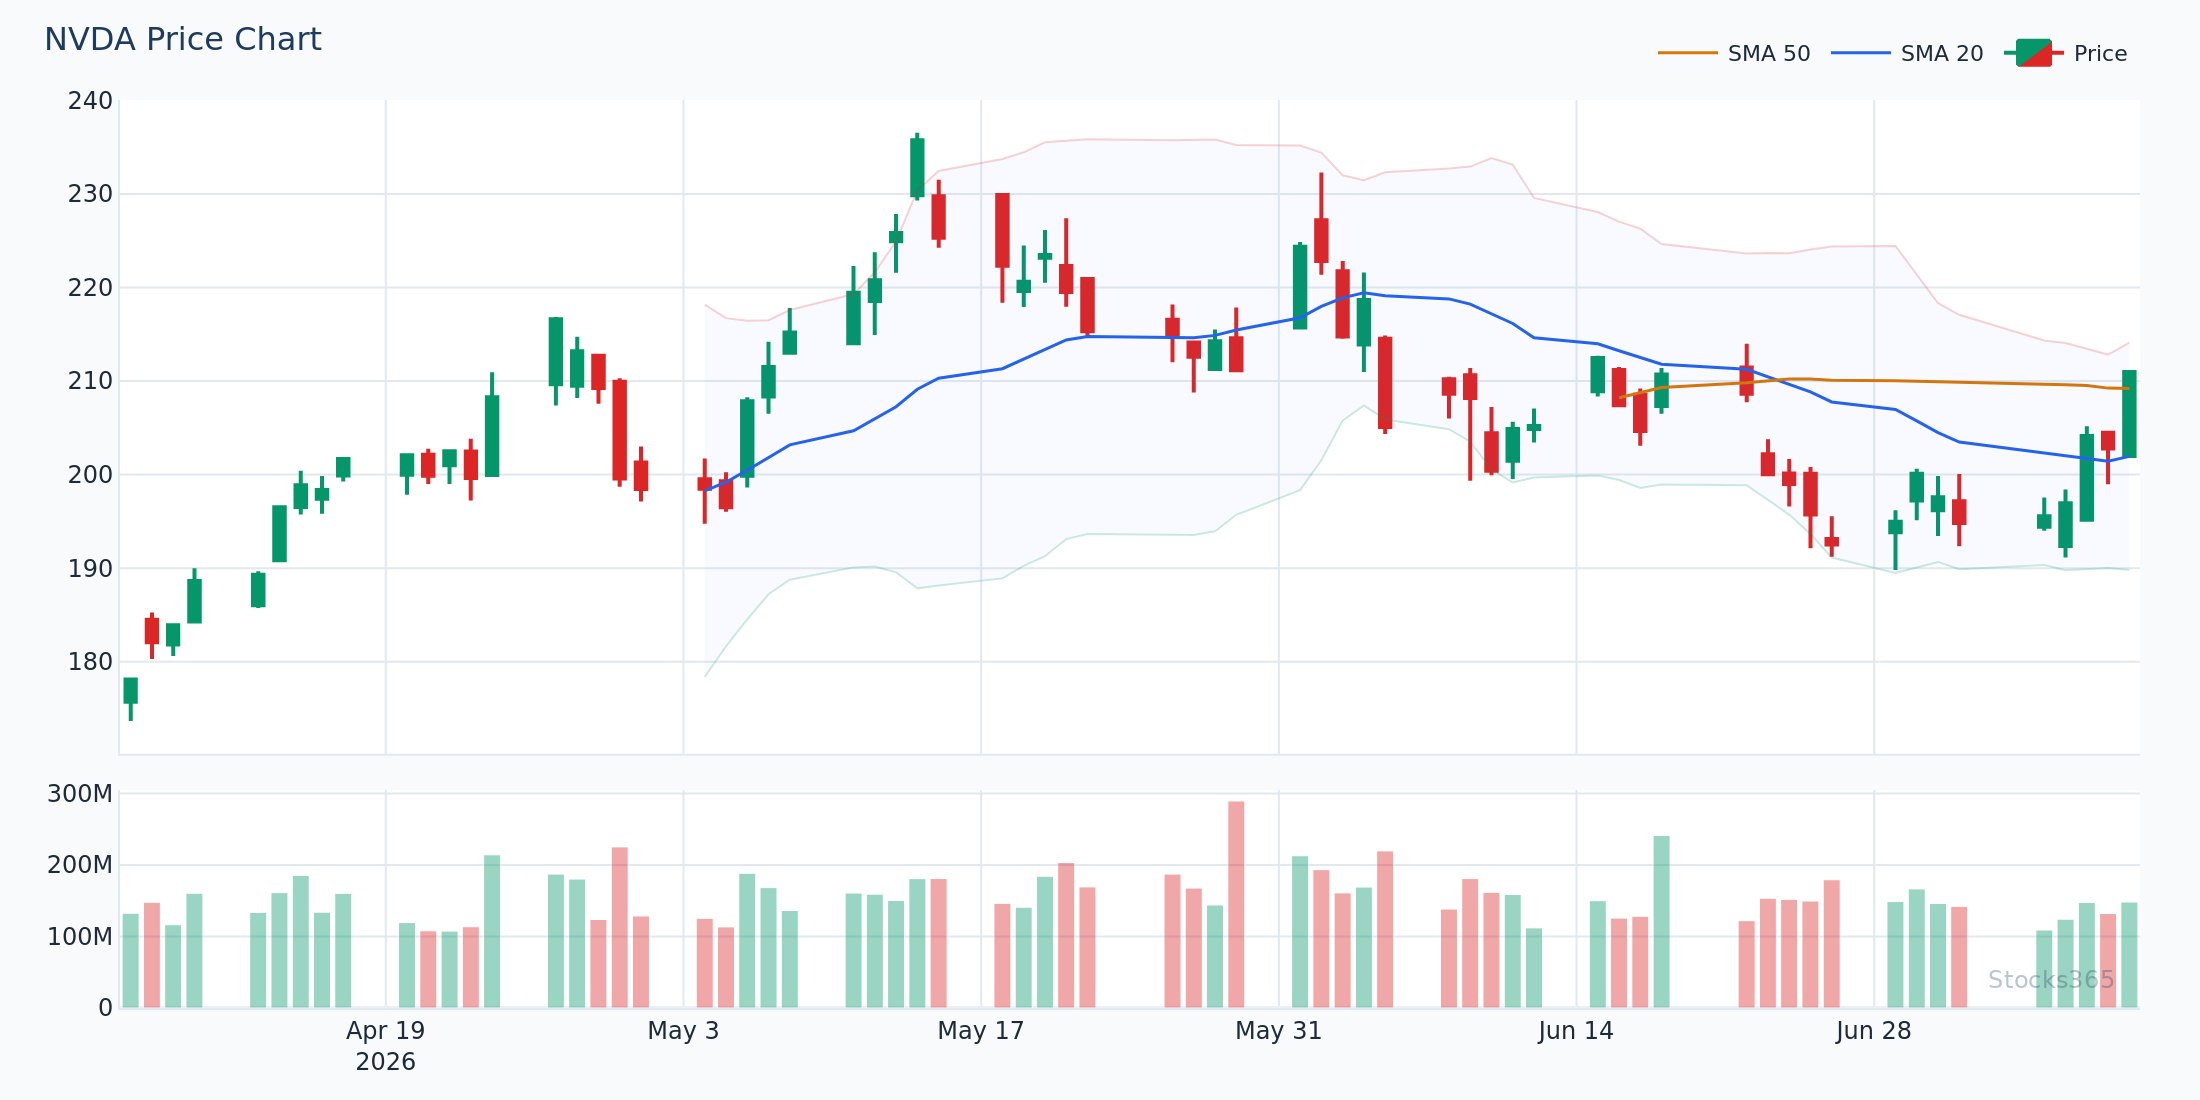
This setup shows a histogram that peaks and begins declining across three consecutive bars while price continues pushing higher — a classic momentum divergence. The price makes a new short-term high but the histogram bar is shorter than the previous one, signaling diminishing buying pressure. What typically follows is either a consolidation phase or a pullback toward a key moving average. The setup is invalidated if the histogram reverses and prints a new high bar, confirming that buyers are back in control.
How the Three Components Work Together
Now you know what each component measures in isolation. The real skill is reading all three simultaneously.
The Bullish Setup: All Three Aligning
A high-confidence bullish MACD setup looks like this:
- The MACD line is below zero but rising sharply (momentum building from oversold territory).
- The MACD line crosses above the signal line (crossover trigger fires).
- The histogram shifts from negative to positive and the bars start growing taller.
- Ideally, this occurs while price breaks above a key short-term moving average on above-average volume.
When all three align in the same direction, the probability of follow-through improves meaningfully over any single component read in isolation. This is the structure the Moving Average Crossover Strategy is built around — and why MACD context amplifies those crossover signals.
The Bearish Setup: Distribution Before the Drop
On the short side, watch for:
- The histogram reaching peak positive values, then printing consecutively shorter bars.
- The MACD line approaching the signal line from above — preparing to cross.
- The MACD line still positive but declining — often the market is near a short-term high.
- Price stalling or showing topping wicks on the candlestick chart while MACD weakens.
The histogram shrinkage is the tell. It almost always precedes the crossover. If you wait for the crossover, you're entering after the early signal has already fired.
Divergence: When MACD and Price Disagree
Divergence is one of the most valuable applications of MACD components. It occurs when price action and the MACD line are moving in opposite directions.
Bullish divergence: Price makes a lower low, but the MACD line makes a higher low. Bearish momentum is fading even as price continues declining — a potential bottom signal.
Bearish divergence: Price makes a higher high, but the MACD line makes a lower high. Bullish momentum is exhausting even as price continues rising — a potential top signal.
Divergence doesn't trigger immediately. It's a warning, not a trigger. Wait for the histogram to begin reversing or the crossover to confirm before sizing into a position based on divergence alone.
For a side-by-side comparison of how MACD compares to another momentum oscillator, the MACD vs Stochastic Oscillator breakdown is worth reading — the two tools diverge significantly in choppy conditions.
This chart shows MACD bearish divergence forming as price advances to a new swing high while the MACD line prints a visibly lower peak than the previous rally. The histogram confirms it — shorter bars on this push compared to the prior one. What typically follows is a retracement back toward the 20 or 50-period moving average. The divergence is invalidated if the MACD line breaks to a new high alongside price, confirming that momentum has genuinely accelerated rather than stalled.
MACD Settings: Should You Change the Defaults?
The 12-26-9 default is tested and widely used — which itself has value, because when millions of traders watch the same signal, it becomes somewhat self-fulfilling. Changing settings is a double-edged sword.
Faster settings (like 5-13-6) make the MACD more responsive and better suited for shorter holding periods or higher-volatility assets like crypto. They also generate more false signals in range-bound markets. Slower settings (like 19-39-9) smooth out noise but lag significantly — you'll often be late to the move.
The research is clear: don't hunt for magic parameters. Focus on understanding the default components deeply before experimenting. Pair the MACD with complementary tools — volatility measures like Bollinger Bands provide context the MACD can't offer on its own, particularly for identifying whether a market is trending or ranging.
For crypto-specific applications, combining MACD with Bollinger Bands for crypto can filter out many of the false crossover signals that plague momentum indicators in high-volatility environments.
MACD Across Asset Classes: What the Data Shows
Not all MACD signals are created equal across asset classes. The histogram reversal data is instructive: commodities show the weakest histogram reversal signals (44.1% win rate), while crypto shows the strongest (62.3% win rate across 10,807 signals). This makes intuitive sense — commodity markets are heavily influenced by fundamental supply-demand dynamics and macroeconomic forces that technical momentum can't capture cleanly. Crypto, despite its volatility, tends to exhibit cleaner momentum patterns that the histogram captures well.
Equities sit in the middle. MACD signals on individual stocks are most reliable when aligned with a broader sector or market trend. An MACD bullish cross on a single stock in a sector that's broadly declining has much lower follow-through than the same signal in a sector showing strength across multiple names.
The counterintuitive patterns in our data article explores some of these asset class anomalies in more depth — including cases where the expected MACD signal performed inversely to what most traders assume.
What to Watch For
- Histogram compression near the zero line: When positive histogram bars shrink to near-zero over 3-5 consecutive sessions while price remains stable, a directional breakout often follows. The direction the histogram first expands after compression tells you which side is winning.
- MACD line zero-line crossovers on weekly charts: A weekly MACD line crossing from negative to positive territory — especially after a multi-month decline — has historically preceded sustained uptrends in large-cap equities. Filter for names where price simultaneously reclaims the 50-week moving average.
- Bullish divergence during RSI sub-30 readings: When the MACD histogram forms a higher low while RSI is below 30, the double-confirmation from two independent momentum indicators significantly strengthens the reversal case. Watch for the histogram to print its first positive bar as the entry trigger.
- Bearish divergence in extended uptrends: After a stock advances 30%+ without a meaningful correction, MACD bearish divergence on the daily chart combined with a volume decline on new price highs is a high-priority warning setup — not a trigger, but a reason to tighten stops or reduce position size.
- Signal line crossover emerging from deeply negative MACD territory: A bullish crossover that occurs when the MACD line is well below zero (deeply oversold momentum) tends to produce stronger initial bounces than crossovers happening near zero, because there's more mean-reversion energy to unwind.
Pairing MACD With Other Indicators
MACD works best when it's not working alone. The indicator measures momentum and trend — it says little about volatility or overbought/oversold extremes on their own.
Effective combinations include:
- MACD + Bollinger Bands: Use Bollinger Bands to identify whether the market is in a trend or a range. Only take MACD crossover signals during trending conditions (when Bollinger Bands are expanding). See the Bollinger Bands vs Envelopes guide for context on channel-based filtering.
- MACD + Volume: A MACD bullish cross accompanied by a volume surge (2x or more above the 20-day average) has meaningfully higher follow-through than the same crossover on below-average volume.
- MACD + Higher Timeframe Trend: Always check the weekly MACD before acting on a daily crossover. Trading daily signals in the same direction as the weekly trend filters out the majority of whipsaw losses.
For a complete glossary of MACD-related terminology — including advanced concepts like histogram divergence, zero-line rejection, and MACD slope — the MACD Glossary covers every term you'll encounter.
How Stocks365 Uses MACD Components
The Stocks365 Trust Score system integrates MACD as one of 12+ technical indicators evaluated simultaneously for every signal on the platform. Specifically, the MACD line position relative to zero, the signal line crossover status, and the histogram slope each contribute independently to the momentum agreement score — one of the core Trust Score dimensions.
When MACD momentum agreement aligns with volume confirmation and volatility regime scoring (derived from Bollinger Band width percentiles), the Trust Score weights those signals more heavily in the overall ranking. A MACD bullish cross in a low-volatility regime with expanding Bollinger Bands scores materially higher than an identical crossover in a choppy, high-noise environment.
You can see this in action on the Signals Dashboard — every signal, including individual ones like AAPL signals, displays the Trust Score breakdown so you understand exactly which components are driving the rating.
Key Takeaways
- The MACD has three distinct components: the MACD line (momentum measurement), the signal line (trigger), and the histogram (early warning system). Understanding each separately is essential.
- The MACD line crossing the zero line is a structural signal. Signal line crossovers are trade triggers. The histogram is the leading indicator of both.
- MACD crossovers alone have a win rate near 50% — context is what creates edge. Asset class, trend direction, and volume all matter more than the crossover itself.
- Histogram divergence (bars shrinking while price extends) is the earliest warning signal the MACD generates — it fires before the crossover confirms.
- Pair MACD components with Bollinger Bands and volume for meaningful signal filtering. Don't use it in isolation.
- In crypto, histogram reversal signals show 62.3% win rates in backtesting. In commodities, the same signal drops to 44.1%. Asset class context changes everything.
Frequently Asked Questions
What are the three MACD components?
The three MACD components are the MACD line (calculated as the 12-period EMA minus the 26-period EMA), the signal line (a 9-period EMA of the MACD line), and the histogram (the difference between the MACD line and the signal line). Each component serves a distinct function: the MACD line measures momentum, the signal line acts as a trigger, and the histogram provides early warning of momentum shifts.
Which MACD component is most important?
All three matter, but the histogram is the most underutilized and arguably most powerful for active traders. Because it measures the distance between the MACD line and signal line, it begins revealing momentum changes — specifically when bars start shrinking — before the actual crossover occurs. Experienced traders watch histogram behavior as their primary MACD input and use the crossover as confirmation.
Why does the MACD signal line lag behind price?
The signal line is a 9-period EMA of the MACD line, which is itself calculated from two EMAs. This double-smoothing creates lag — each calculation step adds delay relative to raw price action. The lag is intentional: it filters out short-term noise so the crossover signal reflects a genuine shift in momentum rather than random price fluctuation. The histogram partially compensates for this lag by flagging momentum changes before the crossover fires.
Is the MACD bullish cross a reliable buy signal?
In isolation, no — not reliably. Stocks365's backtesting of 2,310 MACD Bullish Cross signals found a 49.7% win rate over a 10-day holding period with a profit factor of 0.94, meaning it slightly loses money without additional filters. The signal works better in trending markets and specific asset classes (commodities showed 55.2%, crypto showed only 39.2%). The crossover becomes genuinely useful when combined with trend direction, volume confirmation, and higher-timeframe agreement.
What's the difference between MACD divergence and a MACD crossover?
A MACD crossover happens when the MACD line crosses the signal line — it's a direct trigger event. MACD divergence is a structural disagreement between the MACD's direction and price's direction: for example, price makes a new high but the MACD line makes a lower high. Divergence is a warning signal that momentum is weakening before a reversal, while a crossover is the confirmation signal that the reversal may be underway. Divergence fires earlier; crossovers confirm later.