
MACD Crossover Strategy: How to Trade Buy & Sell Signals
The MACD crossover strategy is one of the most widely traded technical setups in the world. Momentum traders use it. Swing traders live by it. And beginners learn it first — sometimes to their detriment.
Here's the reality: Stocks365 backtested 2,310 MACD bullish cross signals across stocks, commodities, ETFs, and crypto and found a 49.7% win rate over a 10-day holding period, with a profit factor of 0.94. That's a coin flip with slightly negative expectancy — on its own. But when you understand which markets this setup works in, and what context it requires, the edge sharpens dramatically.
This guide breaks down exactly how the MACD crossover works, when to trust it, and when to ignore it.
What Is MACD? A Quick Primer
MACD stands for Moving Average Convergence Divergence. It was developed by Gerald Appel in the late 1970s and remains one of the most versatile momentum indicators available.
The MACD indicator consists of three components:
- MACD Line: The difference between the 12-period EMA and the 26-period EMA
- Signal Line: A 9-period EMA of the MACD line itself
- Histogram: The visual difference between the MACD line and the signal line
Understanding EMAs is foundational here. If you want to go deeper on how exponential moving averages are calculated and why they respond faster to recent price action than simple moving averages, read our guide on Exponential Moving Average (EMA) Explained With Examples.
The MACD crossover strategy specifically focuses on when the MACD line crosses the signal line — generating buy and sell signals. Simple in theory. Nuanced in practice.
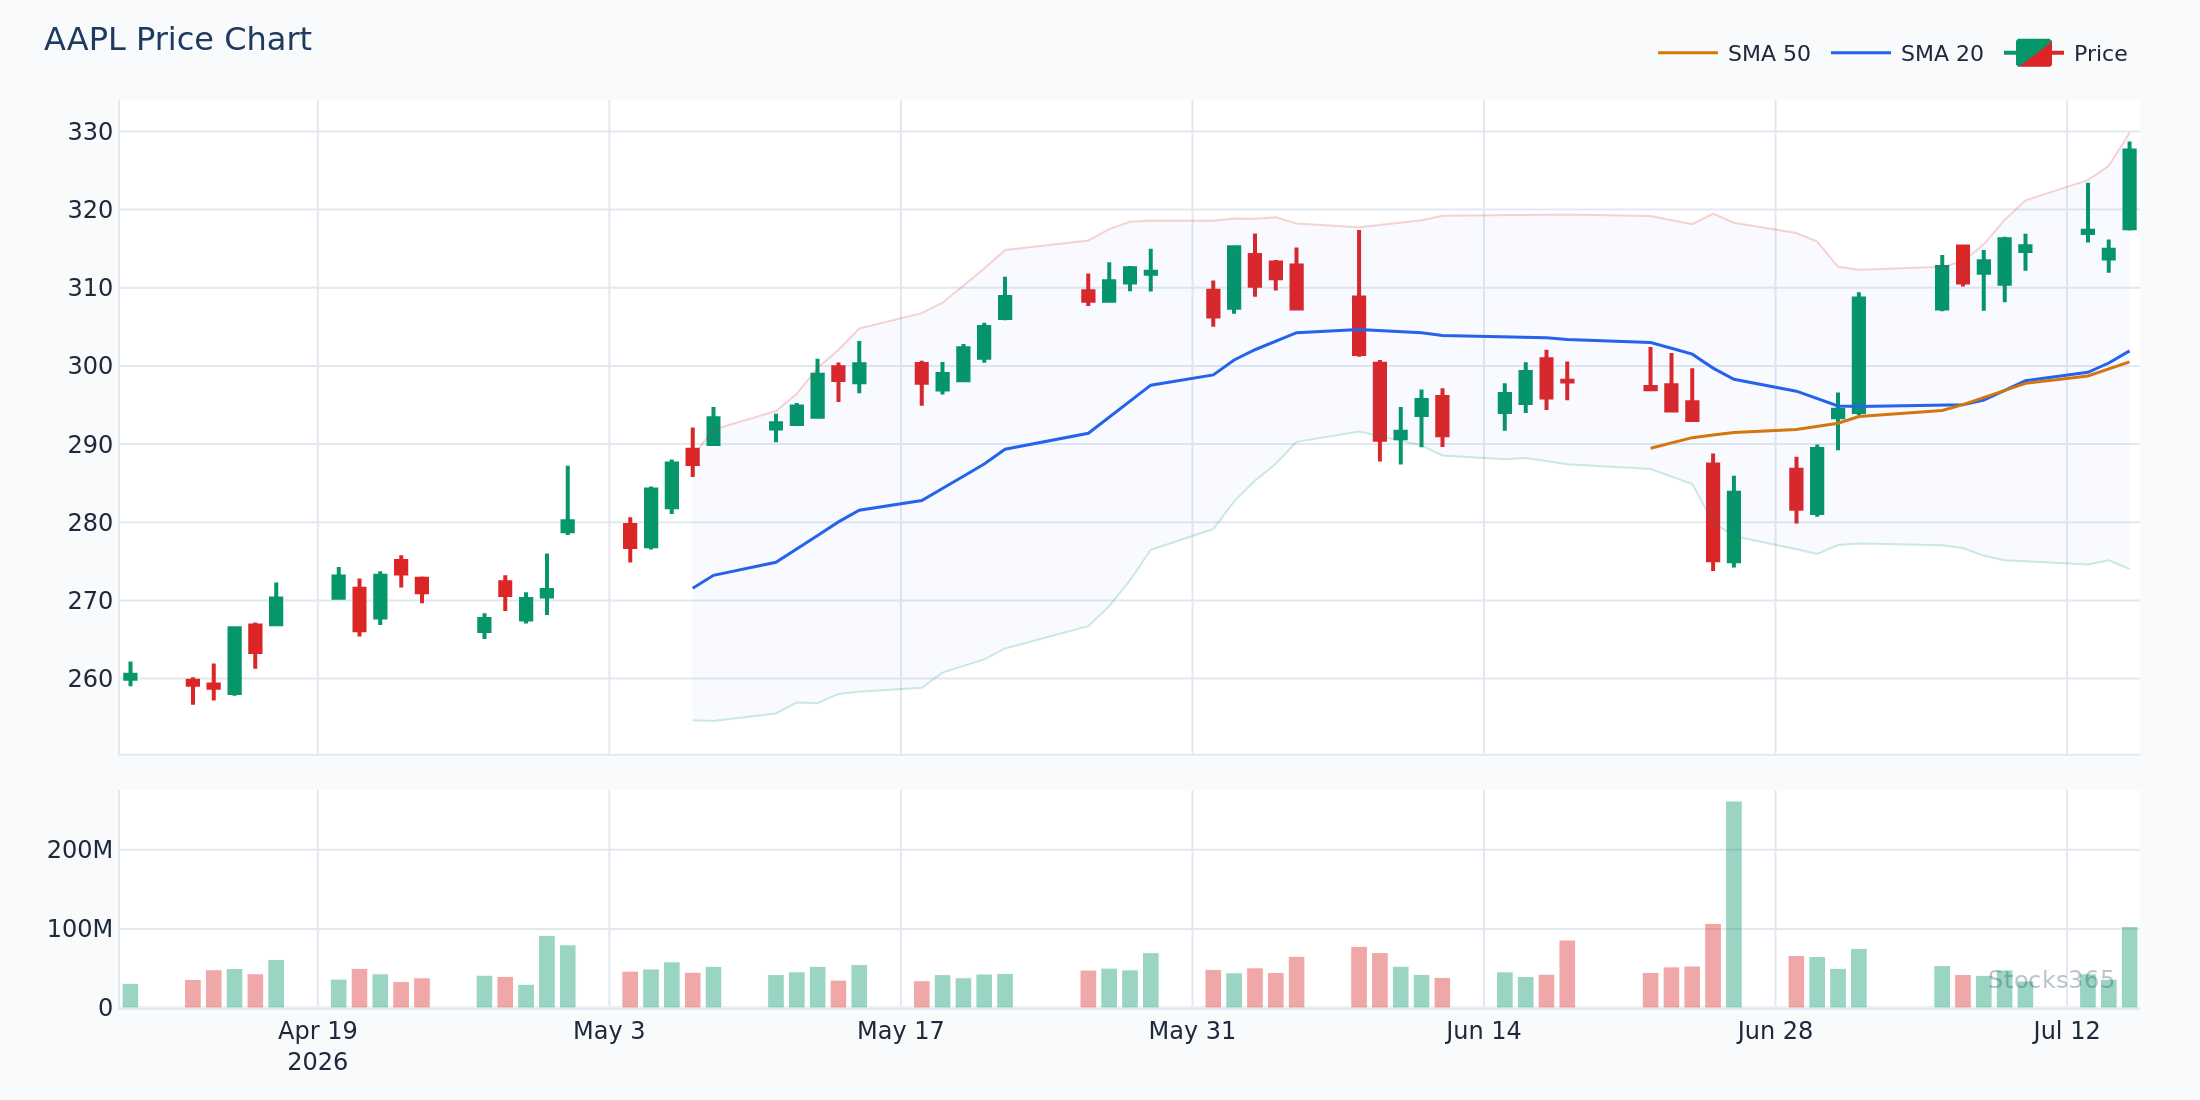
This chart shows the MACD line crossing above the signal line while price consolidates near a key moving average. When the histogram flips from negative to positive and price simultaneously breaks above short-term resistance, the setup confirms. A failure to hold the crossover — where the MACD line dips back below the signal line within 1-2 bars — typically signals a false breakout and warrants immediate reassessment.
How the MACD Crossover Generates Buy and Sell Signals
The Bullish MACD Crossover (Buy Signal)
A bullish MACD crossover occurs when the MACD line crosses above the signal line. This signals that short-term momentum is accelerating faster than the broader trend — a potential shift from bearish to bullish.
The strongest bullish crossovers share these characteristics:
- The crossover happens below the zero line (MACD and signal line both in negative territory)
- The histogram bars are growing in the positive direction after the cross
- Price breaks above a meaningful short-term moving average simultaneously
- Volume expands on the crossover candle — ideally 1.5x to 2x the 20-day average
A crossover that happens above the zero line is a continuation signal, not a reversal. Different context. Different risk profile.
The Bearish MACD Crossover (Sell Signal)
A bearish MACD crossover occurs when the MACD line crosses below the signal line. This suggests downward momentum is building and the uptrend may be exhausting.
Key characteristics of high-quality bearish crossovers:
- Crossover occurs above the zero line after a sustained uptrend
- The histogram reverses from positive to negative with expanding bars
- Price struggles to hold above its 20-day EMA around the same time
- RSI diverges — price makes a higher high but MACD makes a lower high
Our backtests of 2,347 MACD bearish cross signals show a 48.8% win rate with a profit factor of 0.88 on a 10-day hold. The worst-performing asset class: commodities at 43.4%. The best: crypto at 57.8%. Context is everything.
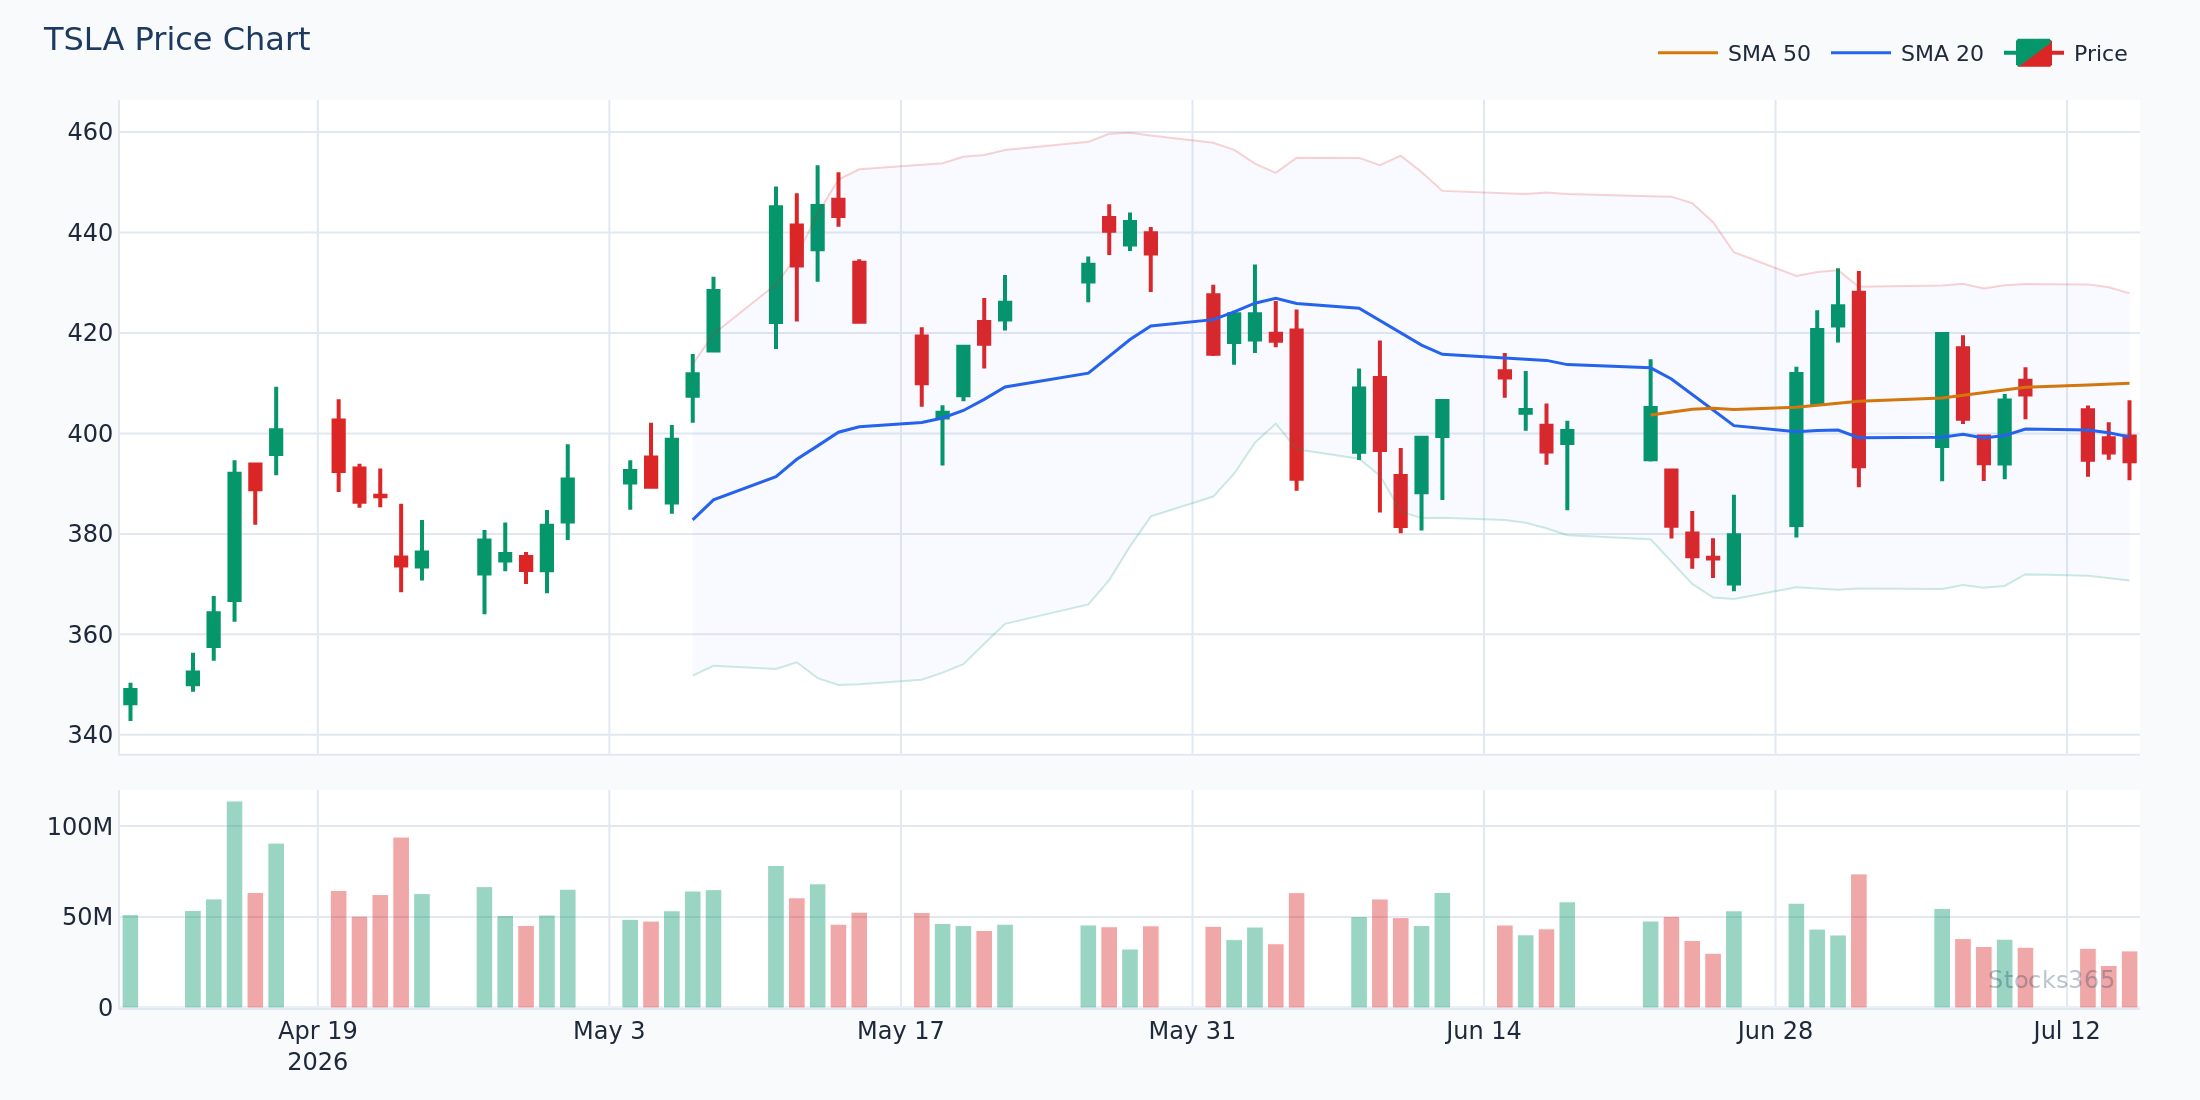
Here the MACD line rolls below the signal line after an extended rally, with the histogram printing its first negative bars. Watch for price to test the 20-day EMA shortly after this crossover — a rejection at that level confirms the bearish signal. If price instead reclaims the prior high while MACD stays negative, treat the signal as failed and step aside.
MACD Histogram Reversals: The Setup Most Traders Miss
Beyond the line crossover, the histogram reversal is an equally powerful — and often overlooked — signal.
A histogram reversal occurs when the bars begin shrinking before the actual crossover. This gives you an early warning that momentum is fading. Some traders use this as an entry trigger rather than waiting for the full crossover, accepting an earlier (but noisier) signal in exchange for a better entry price.
Stocks365 analyzed 10,807 MACD Histogram Reversal Down signals and found a 50.9% win rate with a profit factor of 0.97. Interestingly, crypto was the strongest asset class here at 62.3%, while commodities lagged at 44.1%. This is the inverse of what we see with the bullish line crossover — and it matters for how you allocate across markets. You can explore more cross-asset signal performance in our Asset-Class Scorecard: Where Our Signals Worked Best This Quarter.
How to Trade the Histogram Reversal
- Bearish histogram reversal: Histogram peaks and begins printing shorter positive bars — watch for entry on the first negative bar
- Bullish histogram reversal: Histogram troughs and begins printing shorter negative bars — watch for entry on the first positive bar
- Confirm with price action: a close below the 20-day EMA strengthens a bearish histogram reversal significantly
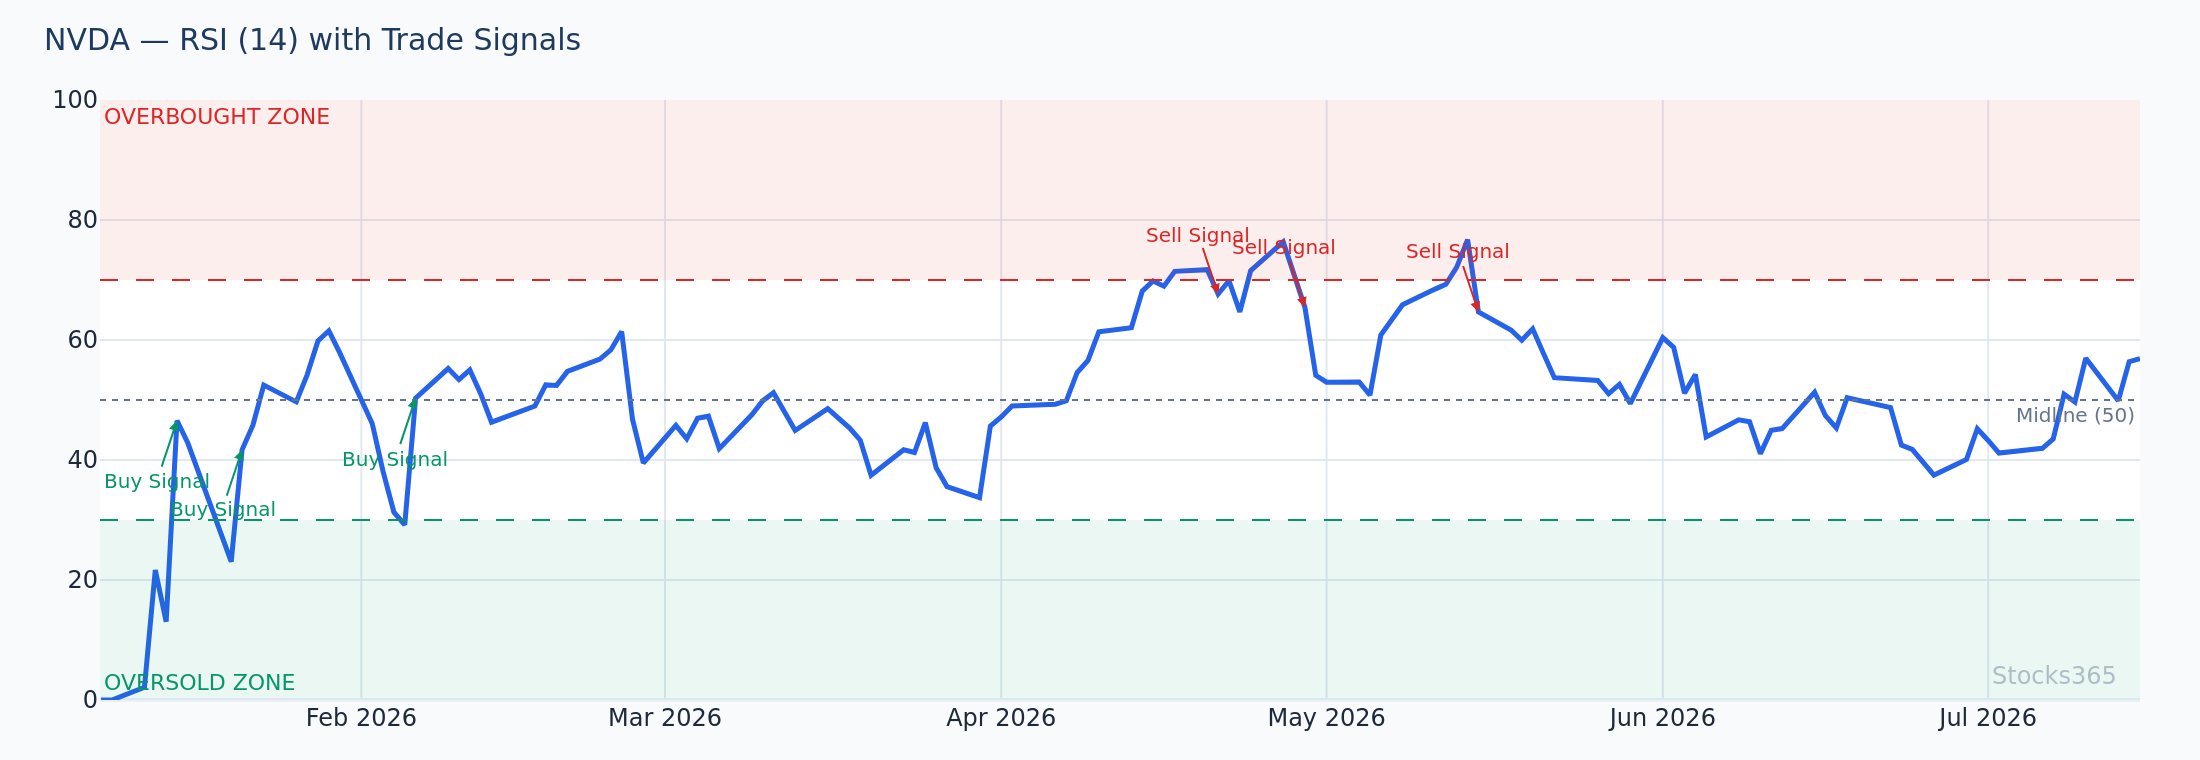
In this chart, the MACD histogram peaks and begins contracting while RSI simultaneously rolls over from overbought territory. This dual-confirmation setup is among the cleaner patterns you'll see. If both the histogram and RSI turn before price does, the subsequent move tends to be sharper. A histogram that reverses while RSI is still rising — with no price divergence — is a lower-conviction setup.
Here's What Most Traders Get Wrong
Most traders treat every MACD crossover as an actionable signal. They see the lines cross, they enter a trade, and then wonder why it fails 50% of the time.
The real mistake: trading MACD crossovers in choppy, range-bound markets. MACD is a trend-following, momentum-based indicator. In a trending market, crossovers are gold. In a sideways market, they're noise — and the indicator will whipsaw repeatedly, generating false signal after false signal. The fix isn't a better entry. It's a market regime filter. Before trading any MACD crossover, confirm the broader trend. If the 50-day and 200-day moving averages are flat and intertwined, wait. The crossover is likely a trap.
MACD Crossover Strategy: Building a Complete Trading Setup
Step 1: Identify the Market Regime
Use the slope of the 200-day SMA as your filter. Rising slope: look for bullish MACD crossovers only. Falling slope: look for bearish crossovers only. Flat slope: step aside entirely or reduce position size dramatically.
Step 2: Wait for a Zero-Line Confirmation
The most reliable bullish crossovers occur when the MACD line crosses the signal line below the zero line and then both lines rise toward zero. This structure shows accumulation happening before momentum goes fully positive. Similarly, the most reliable bearish crossovers form above the zero line as both lines begin declining toward it.
Step 3: Combine With a Secondary Indicator
MACD alone isn't enough. Pair it with one of the following:
- RSI: A bullish MACD crossover with RSI rising from below 40 is a high-confidence setup. Learn more about how RSI complements momentum signals in our RSI vs Stochastic Oscillator: The Essential Guide.
- Bollinger Bands: A MACD crossover while price bounces off the lower Bollinger Band adds a mean-reversion dimension to a momentum signal. See How Bollinger Bands Work: Master the Math Behind It for the mechanics.
- Volume: A crossover on above-average volume carries more conviction than one on thin, low-participation trading days.
- Moving Average alignment: A bullish MACD cross that coincides with price reclaiming the 20-day EMA is a powerful confluence. Our The 20-Day EMA: Your Go-To Short-Term Trading Signal article explains exactly how to use this.
Step 4: Define Entry, Stop, and Target
Entry on the close of the crossover candle — or the open of the next candle if you want confirmation. Stop loss below the most recent swing low (for longs) or above the most recent swing high (for shorts). Target based on a 1.5:1 to 2:1 reward-to-risk ratio, or trail using the 20-day EMA.
Never move your stop against the trade. That's where edge goes to die.
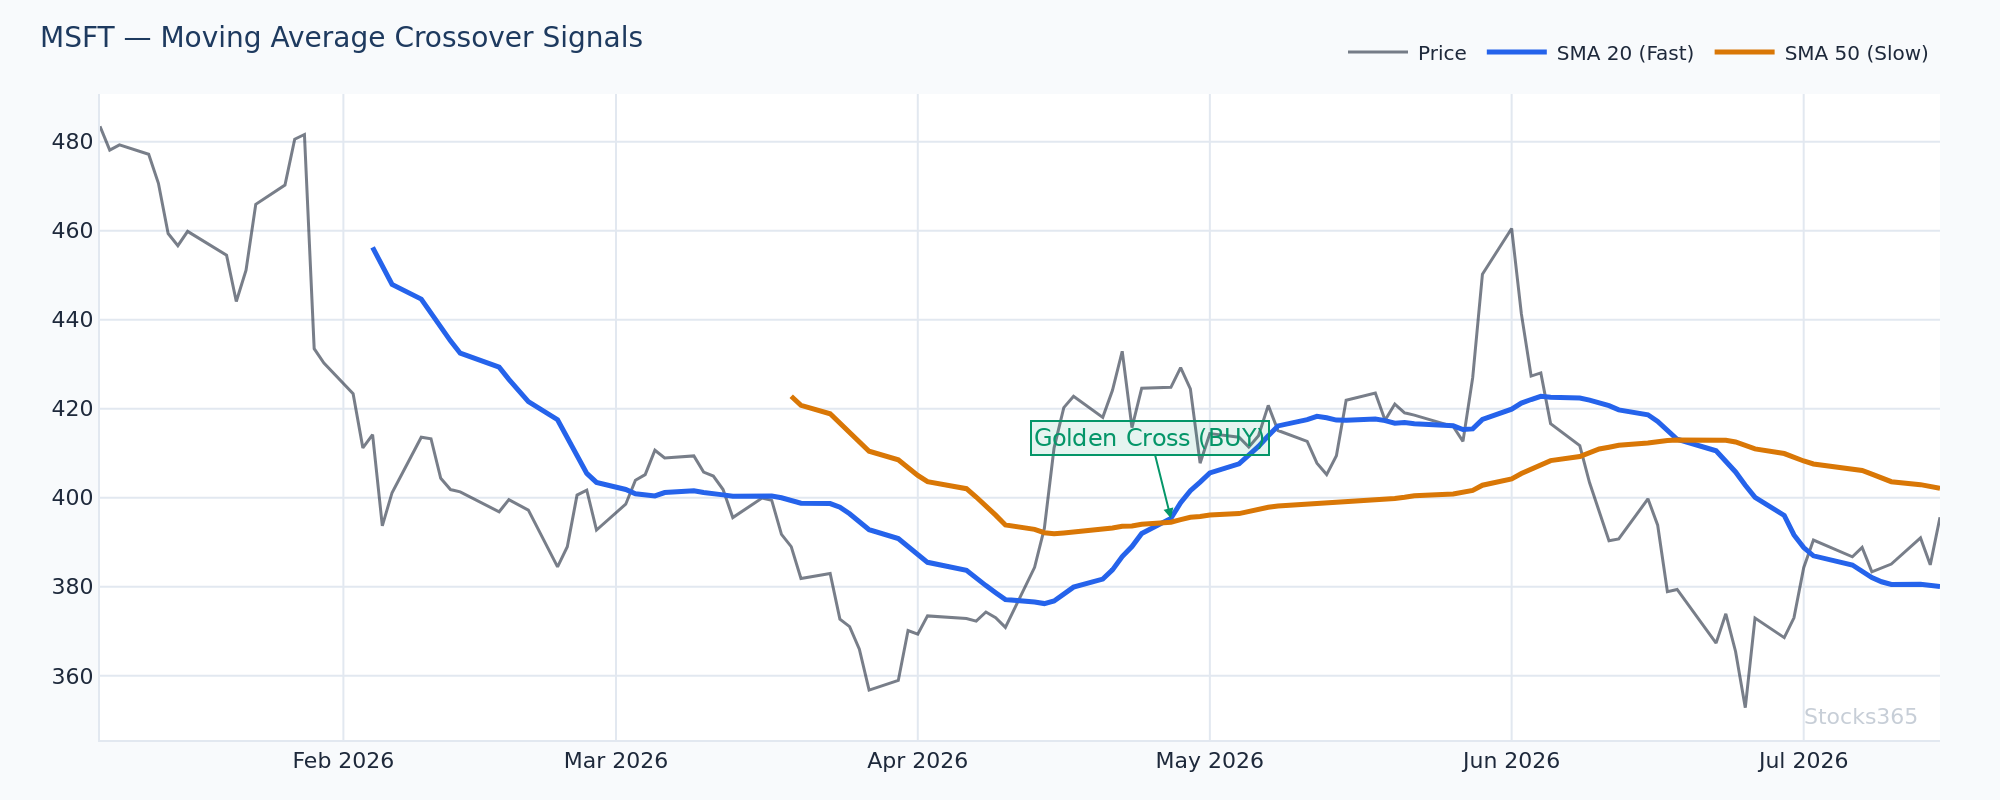
This setup shows the MACD bullish crossover occurring at the exact moment price reclaims the 20-day EMA after a brief pullback. Both signals firing together reduces the false-positive rate significantly compared to MACD alone. Invalidation comes if price closes back below the 20-day EMA within 2 bars of the crossover — that's an immediate exit signal, not a hold-and-hope situation.
MACD Crossover Strategy Across Asset Classes: What the Data Shows
Not all assets respond equally to MACD crossovers. This is one of the most practically useful findings from our research dashboard.
For bullish MACD crossovers: commodities show the highest win rate at 55.2%, while crypto lags significantly at 39.2%. The inverse is true for bearish crossovers, where crypto leads at 57.8%. This makes intuitive sense — crypto's volatility and momentum-driven nature means trend reversals, once they begin, tend to be sharper and more sustained than in commodity markets, which are more range-bound and mean-reverting.
For options traders: a MACD bullish crossover on a commodity ETF in a rising rate environment is a fundamentally different signal than the same crossover on a crypto asset. Treat them differently. For options-specific applications of momentum signals, see our article on RSI in Options Trading: Master Momentum for Perfect Timing — many of the timing principles translate directly.
MACD also pairs well with broader crossover frameworks. If you want to understand how moving average crossovers at a higher timeframe interact with MACD signals at a lower timeframe, the Moving Average Crossover Strategy: Complete Trading Guide covers multi-timeframe alignment in depth.
Common MACD Crossover Mistakes (And How to Avoid Them)
Mistake 1: Chasing Late Crossovers
If the MACD lines have already crossed and price has moved substantially, the signal is stale. Entering late means your risk-reward is compressed and you're often buying into overbought conditions. Wait for the next setup.
Mistake 2: Ignoring the Zero Line
A bullish crossover that happens when both lines are far above zero is a late-trend signal with limited upside. The highest-expectancy bullish crosses happen near or below zero. This is the difference between catching a trend early and buying exhaustion.
Mistake 3: Using MACD on Very Short Timeframes
On 1-minute or 5-minute charts, MACD crossovers generate excessive noise. The signal-to-noise ratio is poor. The indicator was designed for daily or weekly timeframes. Using it on daily or 4-hour charts produces significantly more reliable signals.
Mistake 4: Treating MACD Crossovers as Standalone Signals
As our backtested data shows, a 49.7% win rate on its own is below breakeven. The edge comes from confluence — combining the crossover with trend, volume, and price action confirmation. Isolated crossover trading is a slow bleed. Confluence-filtered crossover trading is an edge. Our team spotted some counterintuitive signal behavior worth reviewing in What Surprised Us This Month: Counterintuitive Patterns in Our Data.
What to Watch For
- Bullish MACD crossovers on commodity ETFs in trending markets: When the MACD line crosses above the signal line below the zero line while the 50-day SMA is sloping upward, this setup historically produces the strongest win rates in the commodity asset class — over 55% by our data.
- MACD bearish crossovers on crypto after RSI fails at the 60-70 zone: When RSI repeatedly fails to reach overbought territory and the MACD line rolls over above zero, this structure signals distribution. The momentum high has likely already been printed.
- Histogram divergence before the line crossover: Watch for the histogram to begin printing shorter bars in the same direction 3-5 candles before the actual line crossover. This early warning gives a better entry price and more time to confirm with volume and price structure.
- MACD crossovers following a Bollinger Band squeeze: When band width compresses to its lowest level in 20+ sessions and MACD simultaneously crosses bullish, the combination of volatility expansion and momentum shift produces high-momentum moves. The squeeze provides the fuel; the crossover lights the match.
- False crossovers in sideways markets: If the 50-day and 200-day SMAs are both flat and within 2% of each other, any MACD crossover has sharply reduced reliability. The signal isn't failing — the market regime is wrong for it. Wait for trend to reassert before re-engaging.
How Stocks365 Uses This
Stocks365 Trust Score Integration: MACD Signals
The MACD crossover is one of 12+ indicators that feed into the Stocks365 Trust Score system. Specifically, MACD contributes to the momentum agreement component of our scoring model — measuring how many independent momentum indicators are aligned in the same direction at any given time.
When a MACD bullish crossover occurs in agreement with RSI recovering from oversold, price reclaiming the 20-day EMA, and above-average volume, the Trust Score rises meaningfully for that signal. A MACD crossover that fires in isolation — with no support from other momentum or volume indicators — receives a lower Trust Score weighting, flagging it as a lower-confidence setup.
The goal is never to rely on a single signal. The Trust Score aggregates agreement across momentum, volatility, trend, and volume dimensions, ensuring that only the highest-confluence setups surface with top-tier confidence ratings. You can review active signals and their Trust Scores on the Stocks365 signals dashboard, or drill into individual equity signals like AAPL's current signal page to see how MACD fits into the broader picture in real time.
Key Takeaways
MACD Crossover Strategy — Summary
- MACD crossover signals have a 49.7% raw win rate — edge comes from filtering with trend, volume, and secondary indicators
- Bullish crossovers work best in commodities (55.2% win rate); bearish crossovers work best in crypto (57.8%)
- The strongest bullish crosses occur below the zero line; the strongest bearish crosses occur above the zero line
- Histogram reversals provide early warning before the actual crossover — watch for shrinking bars as the first signal
- Always confirm with a market regime filter — MACD crossovers in sideways, low-slope markets produce noise, not edge
- Pair MACD with RSI, Bollinger Bands, or 20-day EMA alignment to increase signal confidence meaningfully
- Stocks365 Trust Score uses MACD as part of a 12+ indicator momentum agreement model — single signals alone aren't enough