
MACD Scalping: The Complete Ultra-Short Timeframe Trading Guide
Scalping is one of the most demanding disciplines in active trading — requiring split-second decisions, iron discipline, and indicators tuned for speed. The Moving Average Convergence Divergence (MACD) indicator, traditionally associated with swing and trend trading, is actually a powerful weapon in the scalper's arsenal — when properly configured for ultra-short timeframes.
In this comprehensive guide, you'll learn exactly how to adapt MACD settings for 1-minute through 15-minute charts, how to filter out false signals in fast-moving markets, and how to combine MACD with complementary indicators to build a high-probability scalping system in 2026's volatile trading environment.
Key Insight: The standard MACD settings (12, 26, 9) were designed for daily charts. Scalpers who simply drop this default onto a 1-minute chart without adjustment are setting themselves up for late entries and excessive whipsaws. Optimization is everything.
Understanding MACD Mechanics Before Scalping
Before configuring MACD for scalping, you need a rock-solid understanding of what the indicator actually measures. MACD calculates the difference between two Exponential Moving Averages (EMAs) — typically the 12-period and 26-period EMA — plotted as the MACD line. A 9-period EMA of the MACD line forms the signal line, and the histogram visualizes the gap between these two lines.
On a daily chart, this setup captures medium-term momentum shifts. On a 1-minute chart, using the same settings, you're looking at the equivalent of a 12-minute and 26-minute moving average — far too slow for scalping. By the time a traditional MACD crossover fires on a 1-minute chart, the move is often 70-80% complete.
This lag problem is central to MACD scalping, and solving it is your first mission.
Optimal MACD Settings for Scalping
The Fast Scalping Configuration: (3, 10, 16)
For ultra-short timeframe scalping on 1-minute and 3-minute charts, many professional scalpers use a (3, 10, 16) MACD configuration. This dramatically shortens the EMA periods to react faster to price changes, while the 16-period signal line smooths out some of the inevitable noise.
- Fast EMA: 3 periods (hyper-responsive to price changes)
- Slow EMA: 10 periods (provides the baseline trend reference)
- Signal line: 16 periods (noise reduction on a short timeframe)
The Balanced Scalping Configuration: (5, 13, 1)
For 5-minute and 15-minute scalping — slightly longer holds of 2-8 minutes — consider the (5, 13, 1) setup. The signal line of just 1 period essentially removes it from the equation, leaving you trading pure MACD line direction and zero-line crosses. This is particularly effective on high-volume stocks like AAPL, TSLA, and NVDA where micro-trends are cleaner.
The Conservative Scalping Configuration: (8, 21, 5)
For traders on 15-minute charts who want scalping entries but with more confirmation, the (8, 21, 5) combination sits between the standard daily settings and pure ultra-short configurations. This is ideal for pre-market and post-market scalping when liquidity is thinner and false signals are more frequent.
| Timeframe | MACD Settings | Best For |
|---|---|---|
| 1-minute | 3, 10, 16 | High-frequency momentum scalps |
| 3-minute | 3, 10, 16 or 5, 13, 1 | News-driven breakout scalping |
| 5-minute | 5, 13, 1 | Opening range breakouts |
| 15-minute | 8, 21, 5 | Trend-following scalps |
Core MACD Scalping Signals
Signal 1: The Zero-Line Cross
The zero-line cross is the purest MACD scalping signal. When the MACD line crosses above zero, the short-term EMA has overtaken the longer EMA — confirming bullish momentum. When it crosses below zero, momentum has shifted bearish.
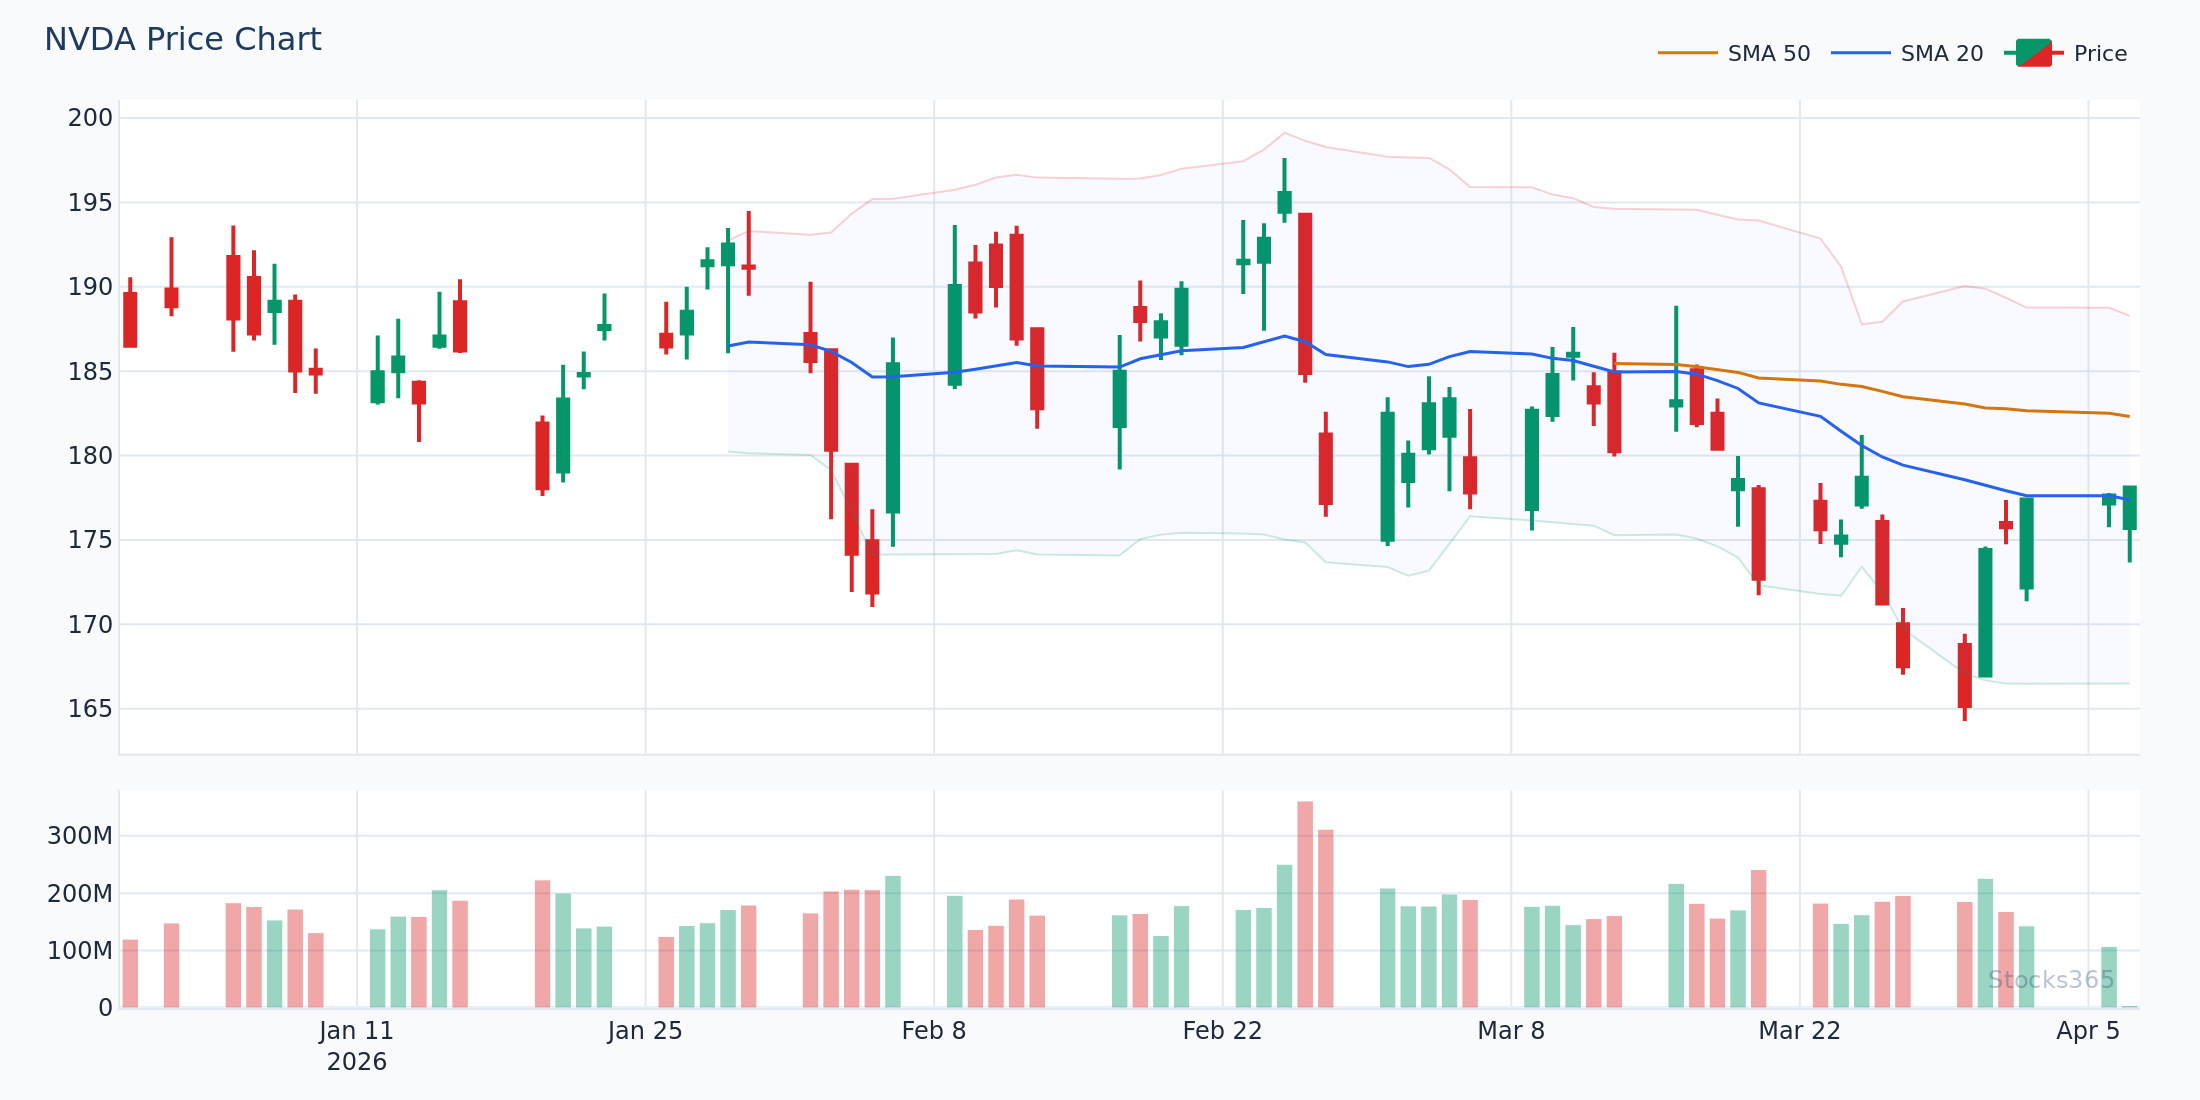
Practical example: NVDA is trading at $142.50 on a 5-minute chart. The MACD line (5, 13, 1) was negative at -0.08 for the past four candles. It then crosses above zero to +0.03 as price pushes above the VWAP. This is a long entry signal. Target: $143.20 (previous 5-minute resistance). Stop: $142.10 (below the crossover candle low). Risk/reward: approximately 1:2.
Signal 2: MACD Line and Signal Line Crossover
When using a non-zero signal line (such as the 5 or 16 period versions), crossovers between the MACD line and signal line provide early momentum signals — often firing before the zero-line cross. This gives you 1-3 candles of additional lead time, which in scalping can mean the difference between a full profit and a partial entry.
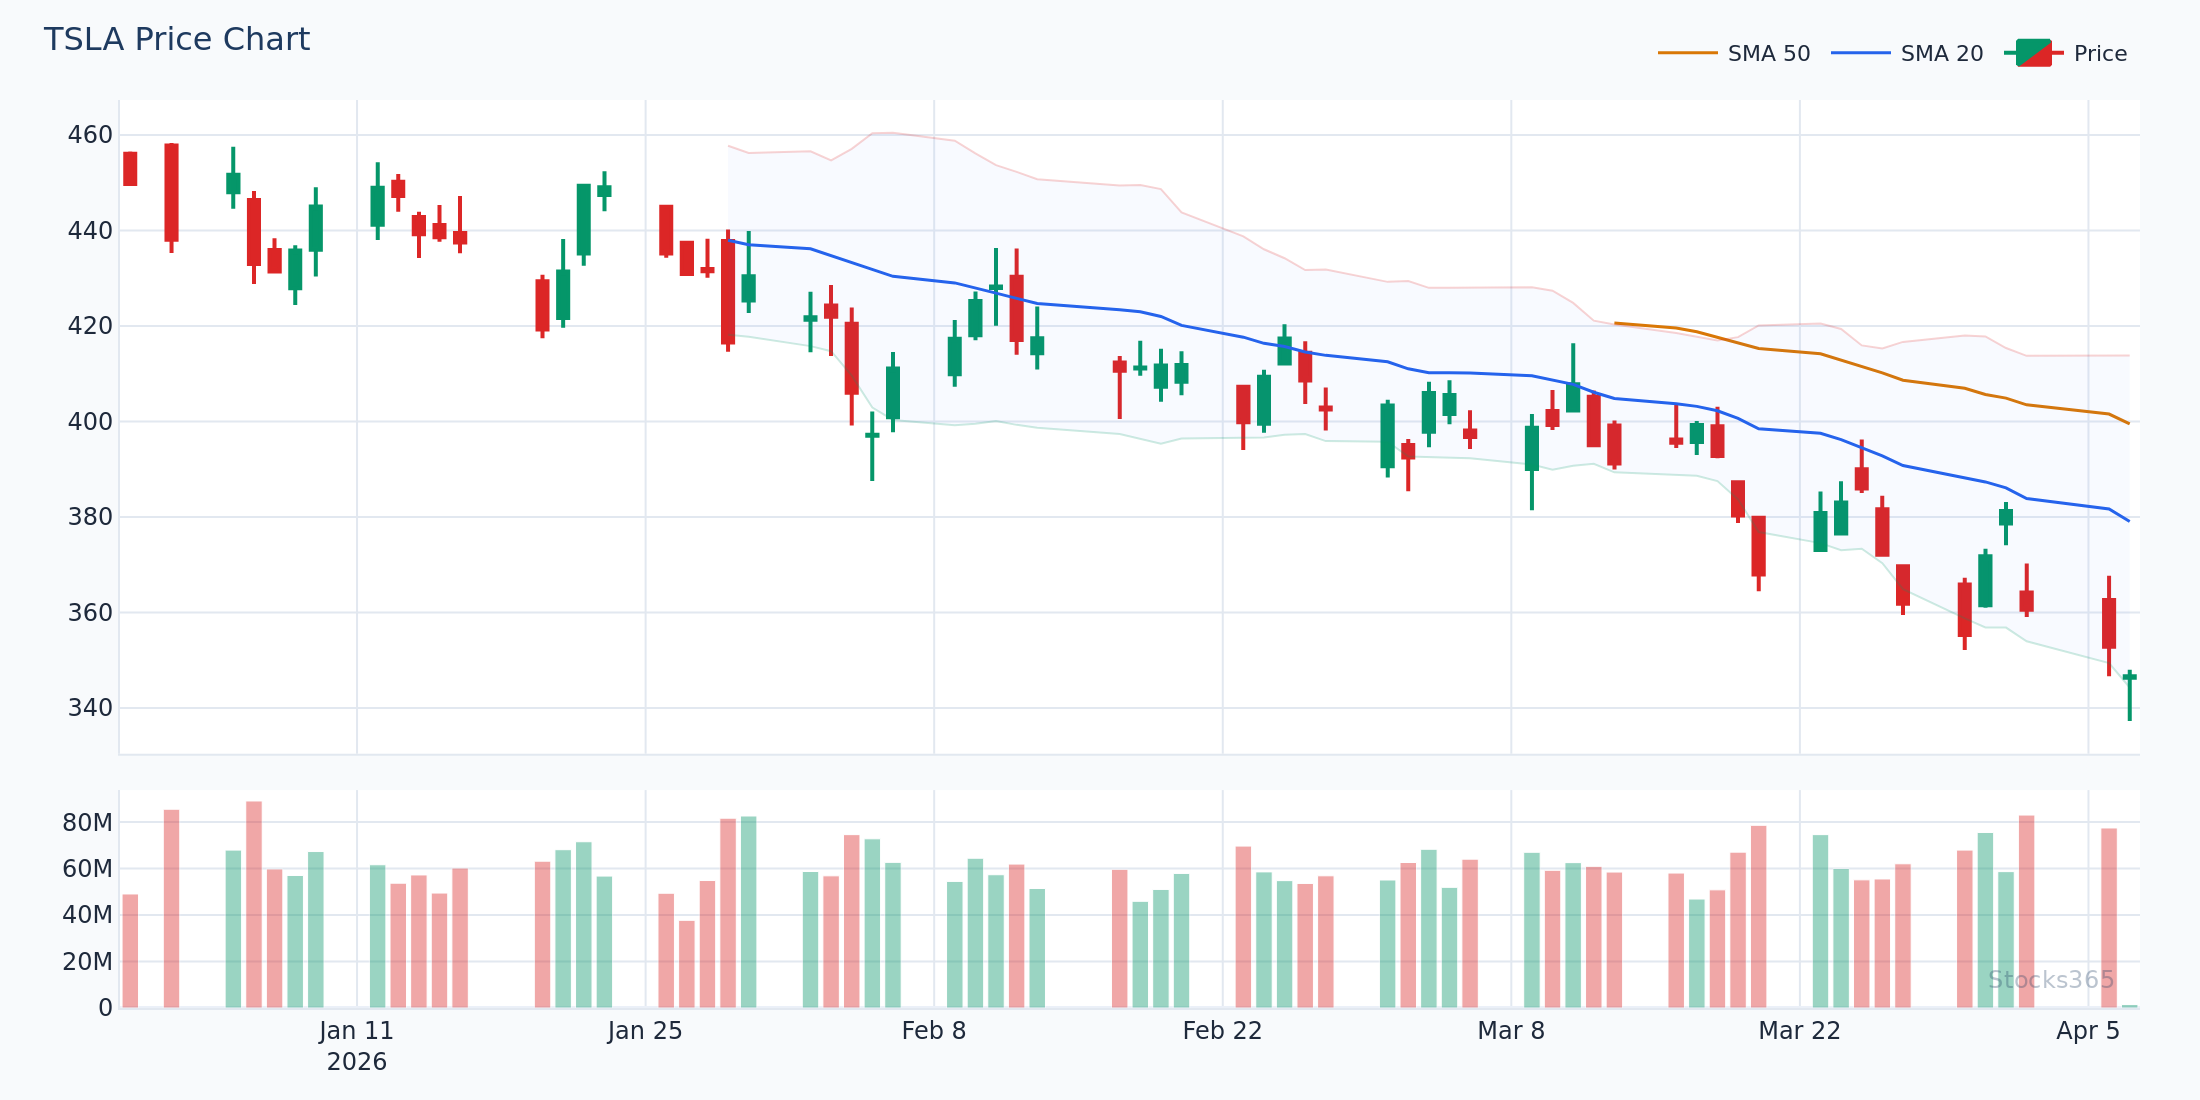
Practical example: TSLA is on a 3-minute chart at $285.00. Using (3, 10, 16) settings, the MACD line crosses above the signal line while both are still below zero. This is a early bullish crossover — not yet a full bull signal, but an alert to tighten your focus. When price then breaks the most recent 3-minute high at $285.70, you enter long. Stop below the swing low at $284.20. Target: $287.00. This is a classic scalping setup with a 1:1.8 risk/reward ratio.
Signal 3: Histogram Momentum Shifts
The histogram bars represent the distance between the MACD and signal lines. For scalping, watch for the histogram to shift from growing negative bars to shrinking negative bars — the very first bar that is less negative than the previous one is the earliest possible bullish signal. This "histogram peak" technique gives you the fastest possible entries.
However, be warned: histogram peaks produce the most false signals. Always require at least one additional confirmation before acting on a histogram shift alone in scalping conditions.
Combining MACD Scalping with Complementary Indicators
MACD + RSI for Scalping Confirmation
Pairing MACD with the Relative Strength Index significantly reduces false signals. While MACD identifies momentum direction and crossovers, RSI tells you whether price is entering overbought or oversold territory — crucial context for scalpers.
For scalping, use RSI with a period of 7 or 9 (not the standard 14) to match the faster pace. An ideal long scalp setup requires:
- MACD line crossing above signal line (or zero line)
- RSI between 40-60 (momentum building, not yet overbought)
- RSI trending upward over the last 2-3 candles
If you want to deepen your RSI knowledge for scalping applications, our guide on RSI Settings: Master the Best Period for Your Strategy covers exactly how to optimize RSI periods for different trading styles — an essential read for any scalper using dual-indicator confirmation.
For the foundational RSI knowledge that underpins effective combination strategies, What Is RSI? The Complete Beginner's Guide provides everything you need before scaling up to advanced MACD-RSI scalping systems.
MACD + VWAP for Intraday Scalping
The Volume Weighted Average Price (VWAP) is arguably the most important intraday reference level for scalpers. Combining MACD signals with VWAP context dramatically improves signal quality:
- Long bias: Only take MACD bullish crossovers when price is above VWAP
- Short bias: Only take MACD bearish crossovers when price is below VWAP
- VWAP reclaim: A MACD crossover occurring simultaneously with a VWAP reclaim is one of the highest-probability scalping setups available
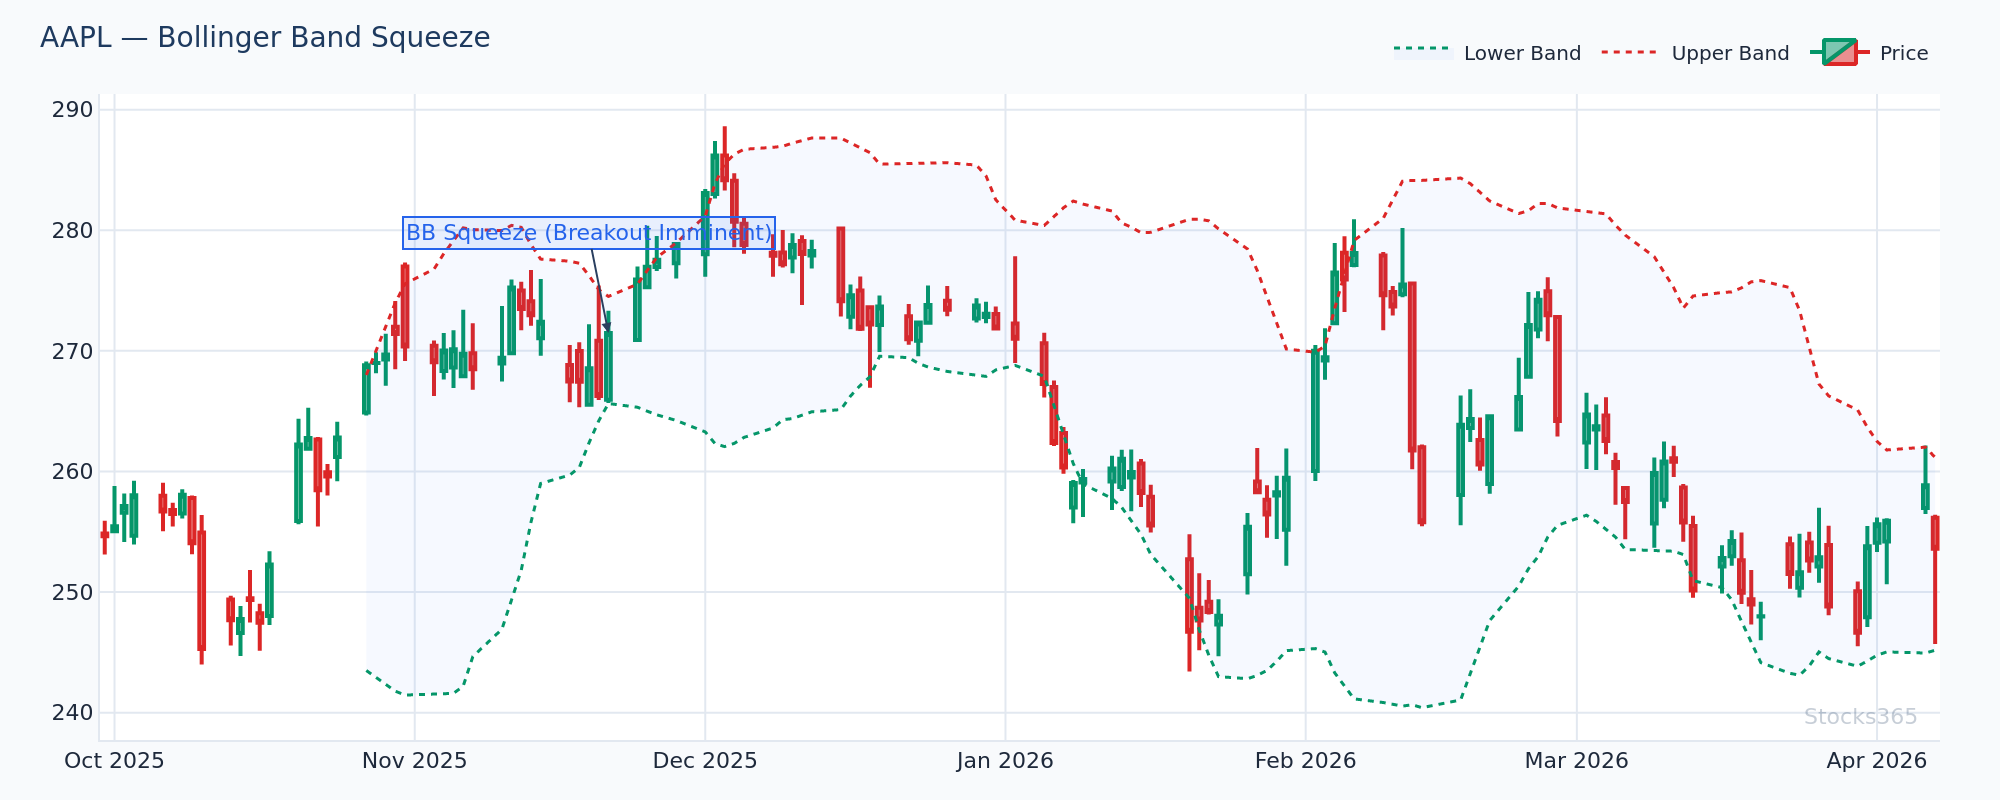
MACD + Bollinger Bands for Volatility Context
Bollinger Bands help scalpers understand when volatility is expanding (band widening) versus contracting (band squeezing). A MACD crossover during a Bollinger Band squeeze breakout is a premium scalping setup — low volatility compressed price is being released, and MACD is catching the initial momentum wave.
You can also check the Stocks365 signals dashboard for real-time alerts that incorporate multi-indicator confirmation, including MACD-based momentum signals across the most active scalping stocks.
Advanced MACD Scalping: Divergence on Ultra-Short Timeframes
Regular MACD Divergence for Scalping Reversals
MACD divergence — where price makes new highs but MACD fails to confirm — works on every timeframe, including 1-minute charts. For scalpers, this provides high-probability reversal entries at key intraday levels.
Bearish divergence scalping example: AAPL is on a 5-minute chart. Price makes a new session high at $215.40, but the MACD histogram prints a lower peak than the previous high at $214.80. This bearish divergence — combined with RSI overbought territory above 75 — signals a high-probability short scalp. Entry: $215.20 (on first bearish candle after the divergence). Stop: $215.60 (above the new high). Target: $214.40 (previous support). This 1:2 risk/reward setup with a $0.40 stop is textbook scalping.
For deeper divergence analysis techniques that complement MACD work, explore our guide on RSI Divergence Explained: Master Bullish & Bearish Signals. The same divergence principles apply across both MACD and RSI, and using both simultaneously elevates your confidence in any scalping reversal call.
Hidden MACD Divergence: Trend Continuation Scalps
Hidden divergence is even more powerful for scalpers trading with the trend. In a bullish trend, when price makes a higher low but MACD makes a lower low — that's hidden bullish divergence, signaling the trend will continue higher. This is a premium pullback entry for scalpers.
This concept parallels hidden RSI divergence perfectly. If you're unfamiliar with the hidden divergence mechanic, Hidden RSI Divergence: The Advanced Signal Most Traders Miss is essential reading — the same logic applies when hunting hidden MACD divergence on 3-minute and 5-minute scalping charts.
Risk Management for MACD Scalpers
Position Sizing on Ultra-Short Timeframes
The speed of scalping amplifies both gains and losses. Effective position sizing is non-negotiable. A common scalping rule is to risk no more than 0.1% to 0.25% of your account per trade — far less than swing trading norms. With 20-40 trades per session, even small per-trade losses compound quickly if sizing is oversized.
Stop-Loss Placement for MACD Scalps
For MACD crossover scalps, place your stop:
- Long trades: Below the most recent swing low before the MACD crossover candle
- Short trades: Above the most recent swing high before the MACD crossover candle
- Maximum stop size: 0.2-0.4% of asset price on 1-3 minute charts; 0.3-0.6% on 5-15 minute charts
Profit Targets and Exit Rules
Don't wait for the MACD to cross back in the opposite direction to exit — that's a losing approach in scalping. Instead, use:
- Fixed R multiples: Exit at 1.5R or 2R from entry (risk/reward pre-defined)
- Key intraday levels: Previous candle highs/lows, round numbers, VWAP
- MACD histogram fade: When histogram bars start shrinking in the direction of your trade, consider scaling out 50%
- Time-based exits: If the position hasn't moved within 3-5 candles, exit — capital is tied up unnecessarily
MACD Scalping Across Different Market Conditions
Trending Markets
MACD scalping performs best in trending conditions. On a trending day, you'll see MACD make clean crossovers in the trend direction with minimal false reversals. Focus on zero-line pullbacks and histogram continuation patterns. Stocks like NVDA with strong institutional momentum regularly create 3-5 clean MACD scalping setups on trending days.
Range-Bound Markets
In choppy, sideways markets, MACD scalping becomes treacherous. The indicator will whipsaw repeatedly as price oscillates without direction. If the MACD histogram shows small, alternating bars with no sustained directional momentum, stop scalping MACD signals and switch to mean-reversion approaches at range extremes instead.
High-Volatility Events (Earnings, FOMC)
During high-impact events, MACD signals on ultra-short timeframes become unreliable due to extreme spread widening and algorithmic order flow that bypasses normal momentum mechanics. Either widen your settings significantly or step aside during the initial 3-5 minutes of extreme volatility, then re-engage once MACD signals normalize.
The Stocks365 dashboard provides trust scores that reflect signal quality in real-time — a critical filter when deciding whether current market conditions support aggressive MACD scalping or require a more conservative approach. Higher trust scores correlate with cleaner technical setups where MACD signals are more reliable.
Building Your MACD Scalping Routine
Pre-Market Preparation
Before the open, identify your watchlist of 3-5 stocks with high relative volume and clear pre-market trends. For each, note key levels: yesterday's high/low, overnight high/low, pre-market VWAP, and any significant gaps. These become your MACD signal filters — you'll only take MACD scalp signals at or near these high-probability zones.
Session Structure
- 9:30-10:00 AM: Highest volatility — use (3, 10, 16) settings, wait for first 5 minutes before trading
- 10:00 AM-12:00 PM: Primary scalping window — cleaner MACD signals, better risk/reward
- 12:00-2:00 PM: Lunch doldrums — reduce size or stop scalping entirely
- 2:00-4:00 PM: Secondary scalping window — afternoon momentum, MACD signals resume reliability
For traders who also incorporate RSI into their scalping systems, understanding how RSI overbought and oversold levels interact with MACD signals is crucial. Our detailed breakdown in RSI Overbought and Oversold Levels: Master the Signals explains how to use these thresholds as MACD signal filters — avoiding entries when RSI is already at extremes.
📊 Key Takeaways: MACD Scalping
- Optimize your settings: Never use default (12, 26, 9) MACD for scalping — use (3, 10, 16) for 1-3 minute charts and (5, 13, 1) for 5-minute charts
- Zero-line crosses and histogram shifts are your primary entry signals on ultra-short timeframes
- Always combine MACD with VWAP — only take long MACD signals above VWAP and short signals below it
- Risk management is paramount — limit per-trade risk to 0.1-0.25% of account on scalping strategies
- Avoid choppy markets — MACD scalping works in trending conditions; alternating small histogram bars signal range-bound conditions to avoid
- MACD divergence applies to 1-minute charts — bearish divergence at session highs and bullish divergence at session lows provide the highest-probability scalp reversals
- Use the Stocks365 trust score as a real-time filter for signal quality before committing to MACD scalp entries
Frequently Asked Questions
What are the best MACD settings for scalping on a 1-minute chart?
For 1-minute chart scalping, the (3, 10, 16) MACD configuration is widely favored among professional scalpers. The shortened EMA periods (3 and 10 vs. the standard 12 and 26) react faster to price changes, giving you earlier signals before the move is over. The 16-period signal line provides a touch of noise reduction. Avoid the default (12, 26, 9) settings on 1-minute charts — they create far too much lag for effective scalping.
Is MACD reliable for scalping, or does it produce too many false signals?
MACD can be highly reliable for scalping when used correctly, but it becomes noise-prone without proper filters. The key is combining MACD with VWAP (only taking signals in the direction of price vs. VWAP), avoiding range-bound conditions (identify them by small, alternating histogram bars), and using a secondary indicator like RSI for confirmation. Standalone MACD on a 1-minute chart without filters will produce excessive false signals in choppy markets.
What timeframe is best for MACD scalping?
The 5-minute chart offers the best balance between signal frequency and reliability for most MACD scalpers. The 1-minute chart provides more trades but also more noise and false signals, requiring faster reflexes and tighter discipline. The 15-minute chart produces fewer but higher-quality signals — better for traders who prefer 2-5 trades per session rather than 20-40. Start with the 5-minute chart and adjust based on your execution speed and risk tolerance.
Should I combine MACD with RSI for scalping?
Yes — combining MACD with RSI is one of the most effective dual-indicator approaches for scalping. Use RSI (period 7 or 9 for scalping) to filter MACD entries: only take long MACD crossovers when RSI is below 65 (room to run), and only take short MACD crossovers when RSI is above 35. Avoid MACD entries when RSI is in extreme overbought (above 80) or oversold (below 20) territory, as mean reversion risk increases dramatically. For a complete guide to combining these indicators, see our article on How to Use RSI in Trading.
How do I avoid MACD whipsaws when scalping?
Whipsaws are the biggest enemy of MACD scalpers. The most effective solutions are: (1) Add VWAP as a directional filter — only trade MACD signals aligned with the VWAP direction; (2) Wait for the zero-line cross rather than just the signal line crossover for higher conviction; (3) Require a minimum histogram bar size before acting — ignore crossovers where bars are tiny (less than 0.02 on most stocks); (4) Avoid the first and last 10 minutes of the regular session when spreads widen and algorithmic activity creates artificial MACD signals; (5) Check volume — legitimate MACD scalp signals should be accompanied by above-average volume on the crossover candle.