
تحسين فترة المتوسط المتحرك: إيجاد الإعداد الأمثل لاستراتيجيتك
المتوسط المتحرك هو المؤشر الأكثر استخدامًا في التداول. وهو أيضًا الأكثر إساءة استخدام.
كلّ متداول يضع متوسط 200-SMA على رسمه البياني ويعتقد أنّ الأمر انتهى. لكن اختيار فترة المتوسط المتحرك المناسبة هو الفارق بين استراتيجية تُحقق ميزة وأخرى تولّد ضوضاء. عبر 3,332 إشارة اختبرناها على منصة Stocks365 على متوسط 20-SMA وحده، وصلت نسبة الفوز عند إعداد الاختراق السعري الهبوطي البسيط إلى 50.9% فقط — بالكاد أعلى من رمي العملة. هذا الرقم مهم. يُخبرك أنه لا توجد فترة سحرية واحدة. التحسين هو كلّ شيء.
يُفصّل هذا الدليل بدقة كيفية إيجاد أفضل فترة للمتوسط المتحرك بناءً على أسلوب تداولك، فئة الأصول، والإطار الزمني — مستندًا إلى بيانات حقيقية، لا إلى أساطير منتديات التداول.
ما هي فترة المتوسط المتحرك — ولماذا هي مهمّة؟
فترة المتوسط المتحرك تُحدد عدد الشموع التي يحسب المؤشر متوسطها معًا. إذا استخدمتَ فترة 10، سيتفاعل الخط بسرعة — يلتصق بحركة السعر بشكل وثيق. إذا استخدمتَ فترة 200، سيتحرك ببطء، مُرشِّحًا الضجيج قصير الأمد.
المقايضة دائمًا بين السرعة والموثوقية.
- الفترات القصيرة (5–20): تستجيب بسرعة لتغيرات السعر. إشارات أكثر، إيجابيات خاطئة أكثر.
- الفترات المتوسطة (21–50): توازن بين ترشيح الضجيج والاستجابة. شائعة في التداول المتأرجح.
- الفترات الطويلة (100–200+): مرشّحات اتجاه بطيئة الحركة. الأفضل لتحديد حالات السوق الكلية، وليس الدخولات.
الفترة التي تختارها ليست عشوائية — يجب أن تتماشى مع مدة احتفاظك، ملف تقلب الأصل، وحالة السوق التي تتداول فيها. إعداد يحقق نتائج رائعة في أسواق الكريبتو الاتجاهية قد يُدمّر حساب فوركس في نفس الأسبوع.
فترات المتوسط المتحرك الأكثر شيوعًا (والغرض الحقيقي منها)
المتوسط 9 و10 فترات SMA: المضاربة والتداول اليومي
هذه الإعدادات فائقة القصر مصمّمة للسرعة. المتداولون اليوميون على الرسوم البيانية من دقيقة واحدة و5 دقائق يستخدمونها للإمساك بتحولات الزخم الدقيقة. تُولّد إشارات باستمرار — كثيرة جدًا بحيث لا تستطيع معظم الاستراتيجيات ترشيحها بفعالية دون تأكيد ثانوي مثل الحجم أو RSI.
استخدمها فقط على أصول عالية السيولة. على أسهم صغيرة غير سائلة أو أزواج كريبتو منخفضة الحجم، تصبح عديمة المعنى.
المتوسط 20 فترة SMA: خط الأساس للمتداول المتأرجح
متوسط 20-SMA هو الافتراضي لسبب وجيه. على الرسوم اليومية، يقارب شهر تداول واحد من حركة السعر. متفاعل كفاية للإمساك بحركات التأرجح لكن مستقر كفاية لترشيح قفزات اليوم الواحد.
إنه الإعداد الأكثر اختبارًا على منصة Stocks365 — والبيانات مُلهمة. عبور السعر فوق 20-SMA حقق نسبة فوز 48.3% عبر 3,289 إشارة بفترة احتفاظ 10 أيام. هذا إعداد توقع سلبي بمعزل عن غيره. الدرس: تقاطع 20-SMA وحده ليس استراتيجية. إنه عنصر.
أفضل النتائج على 20-SMA تظهر في الأسهم، حيث يصل التقاطع الصعودي إلى نسبة فوز 52.3%. الكريبتو يُظهر الأداء الأضعف على التقاطعات الصعودية عند 36.9% فقط — نتيجة حاسمة إذا كنت تبني استراتيجيات خاصة بالكريبتو.
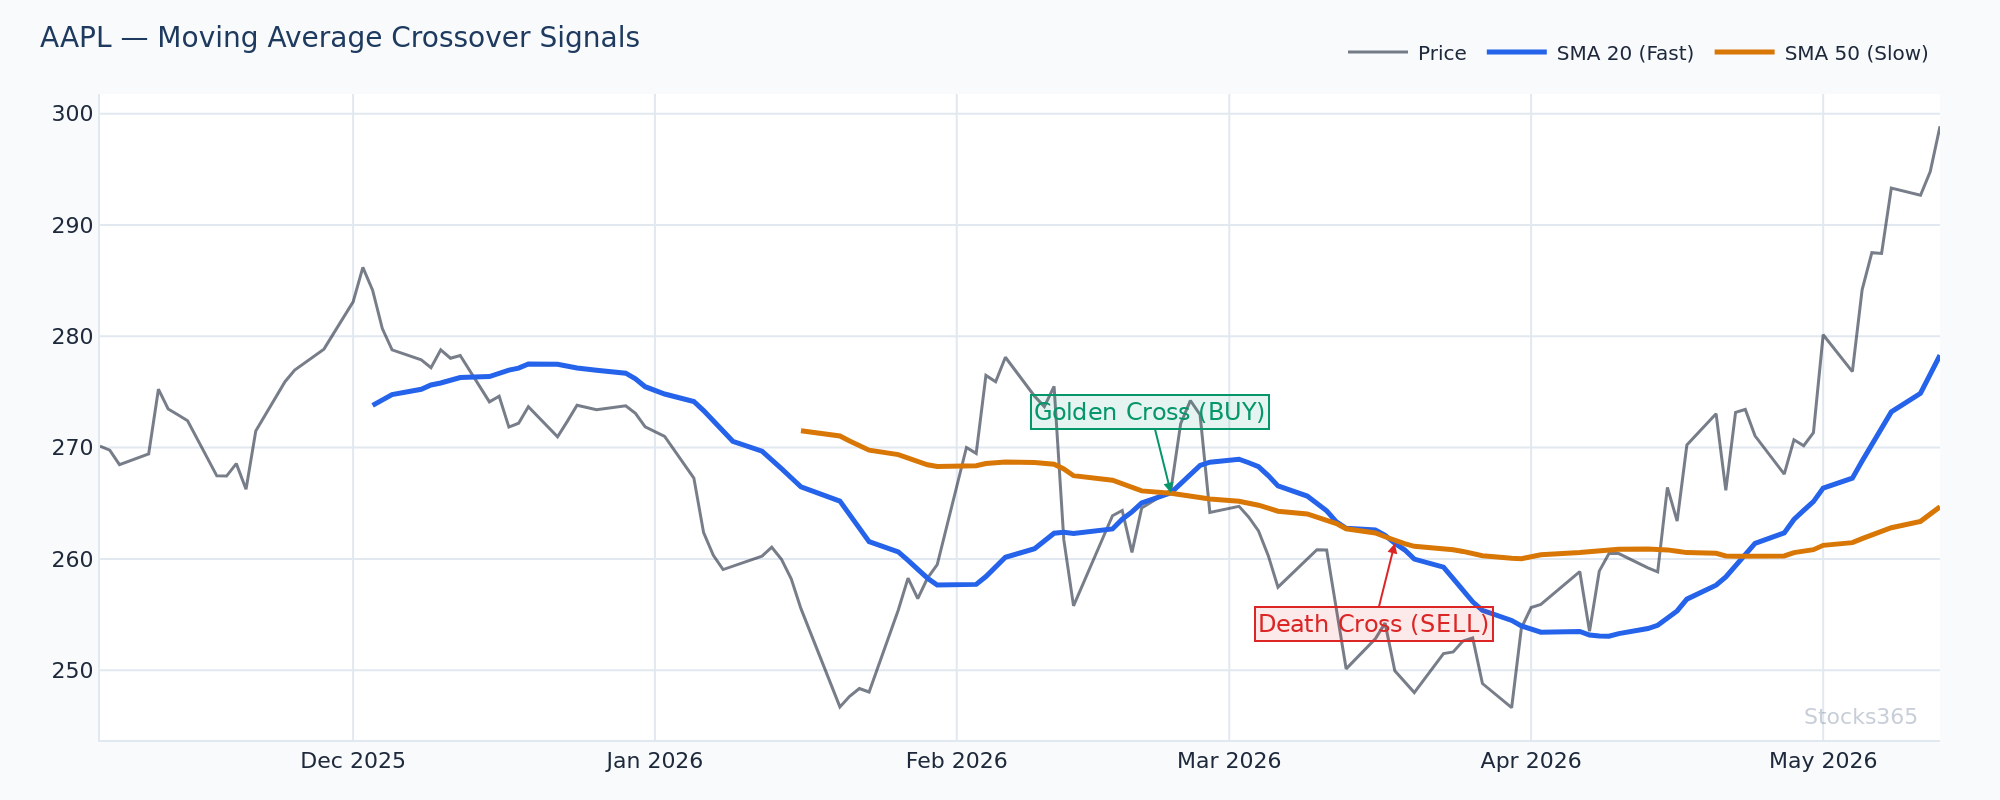
يُظهر هذا الإعداد السعر يستعيد 20-SMA بعد تراجع، مع بدء المتوسط نفسه في الانحدار صعودًا — البنية الكلاسيكية لإعادة التحميل الصعودي. عندما يثبت السعر فوق 20-SMA في إغلاقين متتاليين ويتوسع الحجم على شمعة الاستعادة، يكتسب الإعداد قوّة. إغلاق عودة تحت 20-SMA مع توسع الحجم يُبطل الحركة ويشير إلى احتمال استمرار الهبوط.
المتوسط 50 فترة SMA: منطقة انتباه المؤسسات
متوسط 50-SMA على الرسم اليومي تراقبه المكاتب المؤسسية. يمثل تقريبًا شهرين ونصف من حركة السعر. الانهيارات واستعادة هذا المستوى مهمّة — غالبًا تتزامن مع ردود أفعال الأرباح الفصلية، تدويرات القطاع، وأحداث إعادة التوازن للصناديق.
للمتداولين المتأرجحين بآفاق احتفاظ 2–6 أسابيع، 50-SMA قد يكون المتوسط المتحرك الأكثر فائدة على الإطلاق. يُرشّح ضجيج يومي كافٍ لإبقائك في اتجاهات قوية بينما يُطلِق مع تحولات الزخم المهمّة.
المتوسط 100 و200 فترة SMA: مرشّحات الاتجاه الكلي
هذه مؤشرات حالة، وليست إشارات دخول. متوسط 200-SMA يفصل بين ظروف السوق الصاعدة والهابطة على المستوى الكلي. السعر فوق 200-SMA على الرسم الأسبوعي يُخبرك أن الاتجاه طويل الأمد صاعد. هذا هو المرشّح — وليس المحفّز.
استخدام 200-SMA للدخولات على الرسوم اليومية يُدخل تأخرًا هائلًا. بحلول وقت عبور السعر 200-SMA، غالبًا تكون الحركة قد استُنفدت. طبّق هذه الإعدادات طويلة الفترة كمرشّحات هيكلية، ثم انتقل إلى فترات أقصر للتنفيذ الفعلي.
هنا يعمل 200-SMA كأرضية دعم ديناميكية خلال اتجاه متعدد الأشهر. السعر المرتد عن 200-SMA بشمعة ابتلاع صعودية وقراءة RSI أعلى من 40 هي إشارة استمرار عالية الجودة. النمط يفشل إذا أغلق السعر بشكل حاسم تحت 200-SMA على حجم مرتفع — عندها تتحول حالة الاتجاه الكلي من صاعد إلى محايد أو هابط.
EMA مقابل SMA: أيّ فترة تعمل بشكل أفضل؟
هذا الجدل يملأ منتديات التداول. إليك الجواب العملي: متوسطات EMA تتفاعل أسرع، متوسطات SMA تُرشّح بشكل أفضل.
المتوسط الأسّي (EMA) يعطي وزنًا أكبر لبيانات السعر الحديثة، ما يجعله أكثر استجابة للزخم الحالي. المتوسط البسيط (SMA) يعطي وزنًا متساويًا لجميع الفترات، ما يجعله أكثر استقرارًا كمرجع هيكلي.
للأصول سريعة الحركة مثل الكريبتو وأسهم التكنولوجيا النامية، EMA بفترات معادلة سيُمسك بالانعكاسات مبكرًا. للأدوات الأبطأ مثل أسهم القيمة الكبرى أو أزواج الفوركس الرئيسية، استقرار SMA يُقلل الإشارات الخاطئة.
أفضل فترة للمتوسط المتحرك ليست مجرد رقم — إنها رقم بالإضافة إلى نوع حساب. متوسط 21-EMA يتصرف بشكل مختلف تمامًا عن 21-SMA في الأسواق المتقلبة.
ما الذي يُخطئ فيه معظم المتداولين بخصوص فترات المتوسط المتحرك
معظم المتداولين يعتقدون أن فترة المتوسط المتحرك الأطول أكثر موثوقية تلقائيًا. خطأ. المتوسط 200-SMA ليس أكثر دقة — إنه فقط أبطأ. في سوق متقلب ومحدود النطاق، متوسط 200-SMA لا يعطيك أيّ إشارة مفيدة إطلاقًا. يبقى مسطّحًا بينما السعر يتأرجح ذهابًا وإيابًا عبره، مُطلقًا تقاطعات خاطئة في كلا الاتجاهين.
طول الفترة يجب أن يتطابق مع حالة السوق. في الأسواق الاتجاهية، الفترات الأطول تبقيك في الصفقات. في الأسواق المحدودة، تُدمرك بالتأخر. الميزة ليست في إيجاد فترة واحدة عالمية — بل في معرفة أيّ فترة تناسب البيئة الحالية. هذا يعني قراءة التقلب وبنية الاتجاه أولاً، ثم اختيار فترتك. وليس العكس.
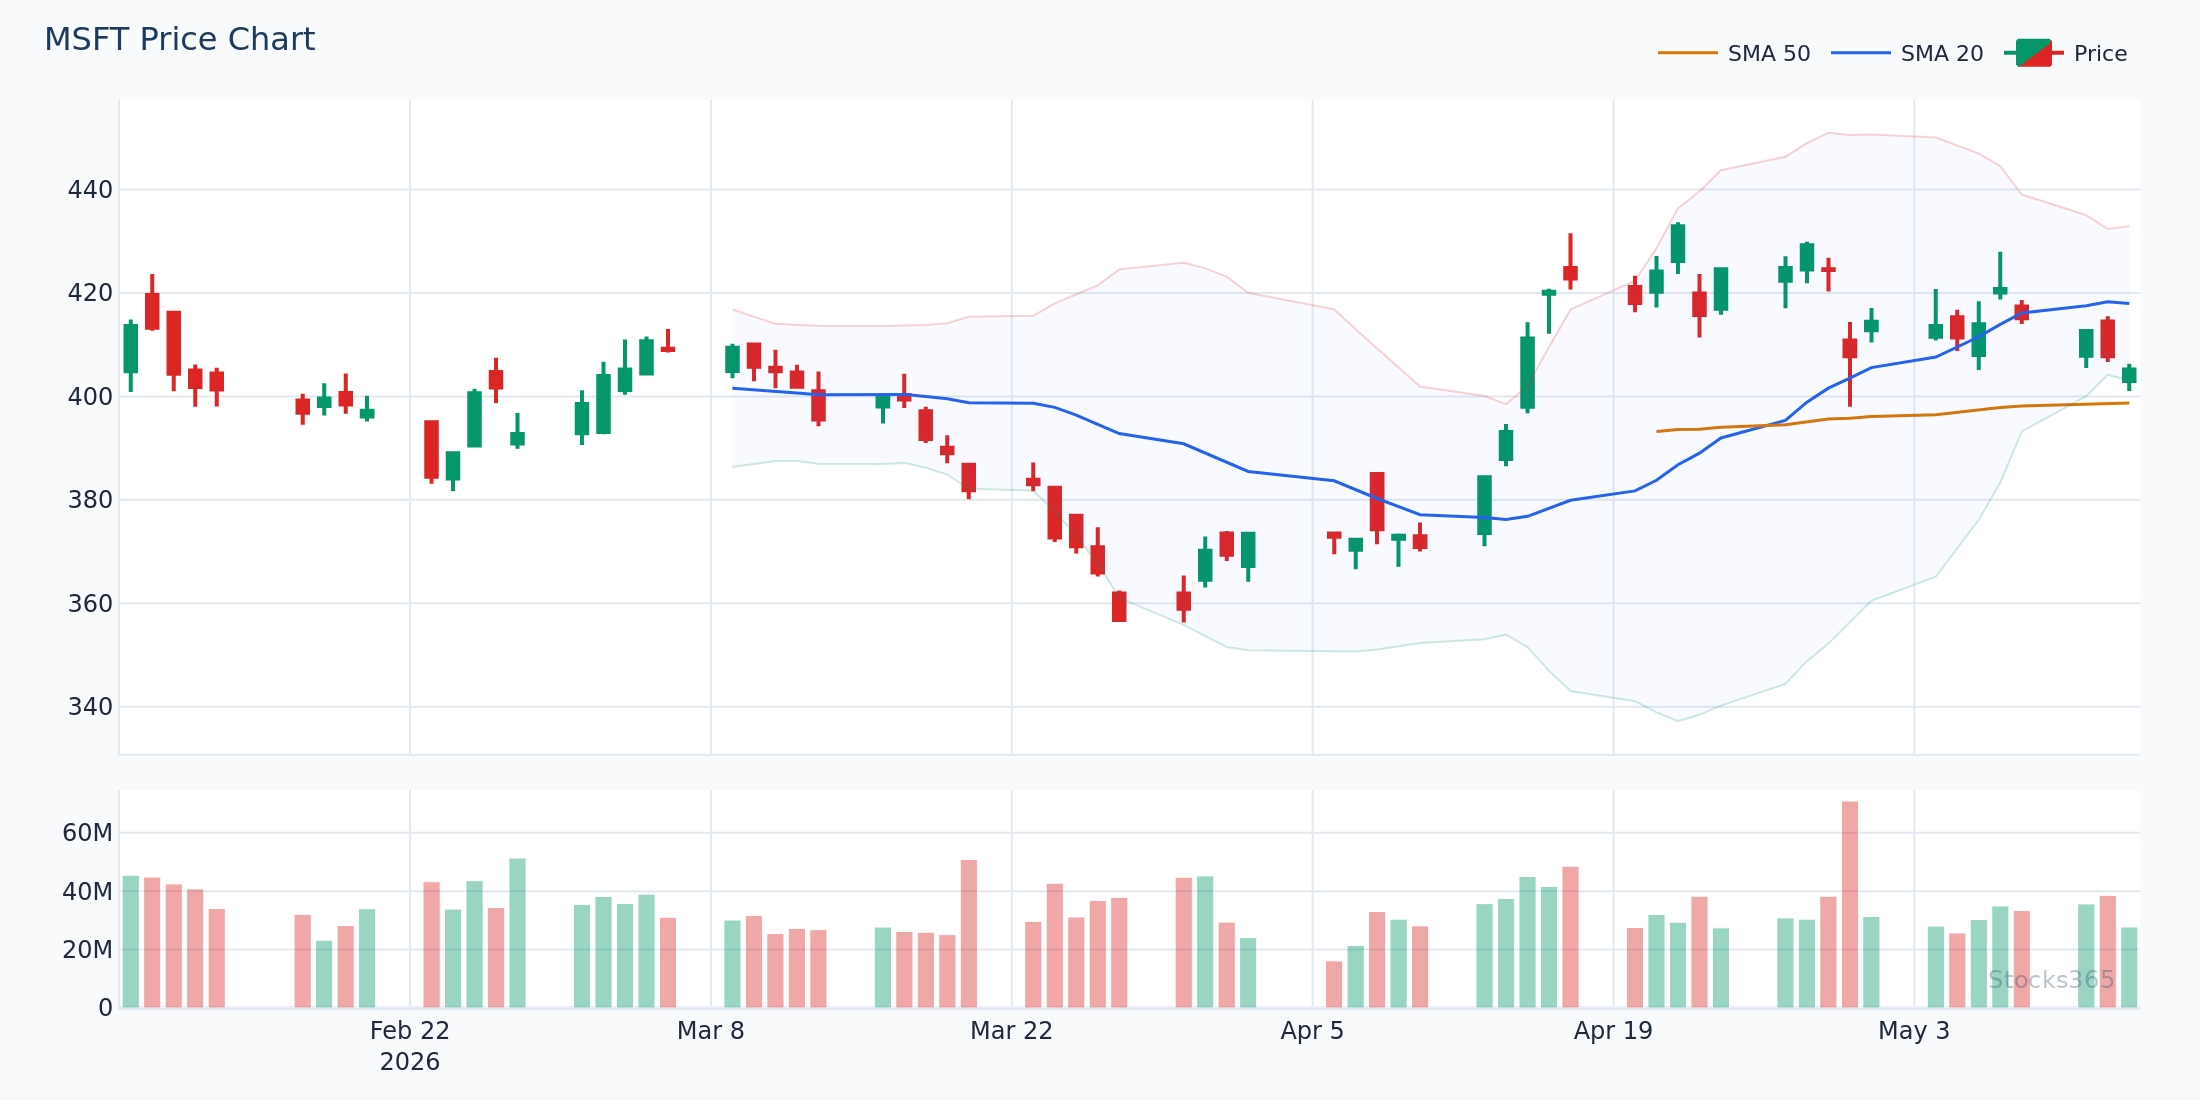
يُوضح هذا الرسم التباعد بين متوسط 20-SMA السريع ومتوسط 50-EMA المتوسط خلال مرحلة اتجاهية متقلبة. عندما ينحدر كلا المتوسطين في نفس الاتجاه ويبقى السعر فوقهما، تُؤكّد حالة الاتجاه ويُكافأ الاحتفاظ. يضعف الإعداد عندما يتذبذب السعر بين الخطّين دون التزام — هذه منطقة التقلب حيث يهمّ تحسين الفترة أكثر.
كيفية تحسين فترات المتوسط المتحرك لفئات أصول مختلفة
الأسهم: مزيج 21-EMA و50-EMA
للأسهم الفردية على الرسوم اليومية، مزيج 21-EMA و50-EMA يقدّم توازنًا ممتازًا. متوسط 21-EMA يتتبع الزخم قريب الأجل. متوسط 50-EMA يُحدد الاتجاه متوسط الأجل. عندما ينحدر الاثنان صعودًا ويثبت السعر فوقهما، يكون الانحياز طويلاً. التراجعات إلى 21-EMA في اتجاه صاعد هي مناطق إعادة تحميل عالية الاحتمال.
اربط هذه البنية مع استراتيجية المتوسطات الثلاثة لإضافة طبقة ثالثة من تأكيد الاتجاه — مفيد خصوصًا في أسماء التكنولوجيا عالية البيتا حيث التقاطعات الخاطئة شائعة.
الفوركس: فترات أبطأ، مرشّحات أدق
الفوركس هو حيث تكافح إشارات المتوسط المتحرك أكثر. بياناتنا المختبَرة تُظهر أن إعداد التقاطع الهبوطي لـ 20-SMA يحقق نسبة فوز 42.5% فقط في الفوركس — الأداء الأضعف من أيّ فئة أصول. أزواج العملات بيئات ارتداد للمتوسط متأثرة بشدة بأحداث الاقتصاد الكلي، ما يجعل استراتيجيات المتوسط المتابعة للزخم تُحقق أداءً ضعيفًا.
في الفوركس، الفترات الأطول (50، 100) المستخدَمة كمرشّحات اتجاه مع إشارات الفترات الأقصر تعمل بشكل أفضل. استخدام 20-SMA منفردًا لدخولات الفوركس إحصائيًا استراتيجية خاسرة. لنظرة أعمق على دمج المؤشرات في أسواق العملات، راجع دليلنا حول MACD في تداول الفوركس.
الكريبتو: التقلب العالي يتطلب تفكيرًا تكيّفيًا
الكريبتو هي فئة الأصول الأكثر استقطابًا لاستراتيجيات المتوسط المتحرك. إعداد التقاطع الهبوطي لـ 20-SMA يحقق بالفعل نسبة فوز 66.8% في الكريبتو — النتيجة الأقوى عبر جميع فئات الأصول في اختبارنا. لكن التقاطع الصعودي فوق نفس 20-SMA يصل فقط إلى 36.9% — النتيجة الأسوأ.
ماذا يُخبرك هذا؟ في الكريبتو، الإعدادات البيعية القائمة على المتوسطات لها دعم إحصائي أكبر من الإعدادات الشرائية عند مستوى الفترة 20. هذا على الأرجح يعكس ميل الكريبتو للانهيارات الحادة والسريعة عند كسر الزخم — كسر 20-SMA هبوطًا يحمل متابعة. التقاطعات الصعودية في الكريبتو غالبًا تحدث خلال ارتدادات التعافي في حالات لا تزال هابطة، ما يفسّر نسبة الفوز الضعيفة على الإشارات الصعودية.
للكريبتو، فكّر في دمج إشارات المتوسط المتحرك مع أدوات تباعد الزخم. دليلنا حول تباعد RSI يغطي بالضبط كيفية استخدام تأكيد الزخم لإعدادات أعلى احتمالاً.
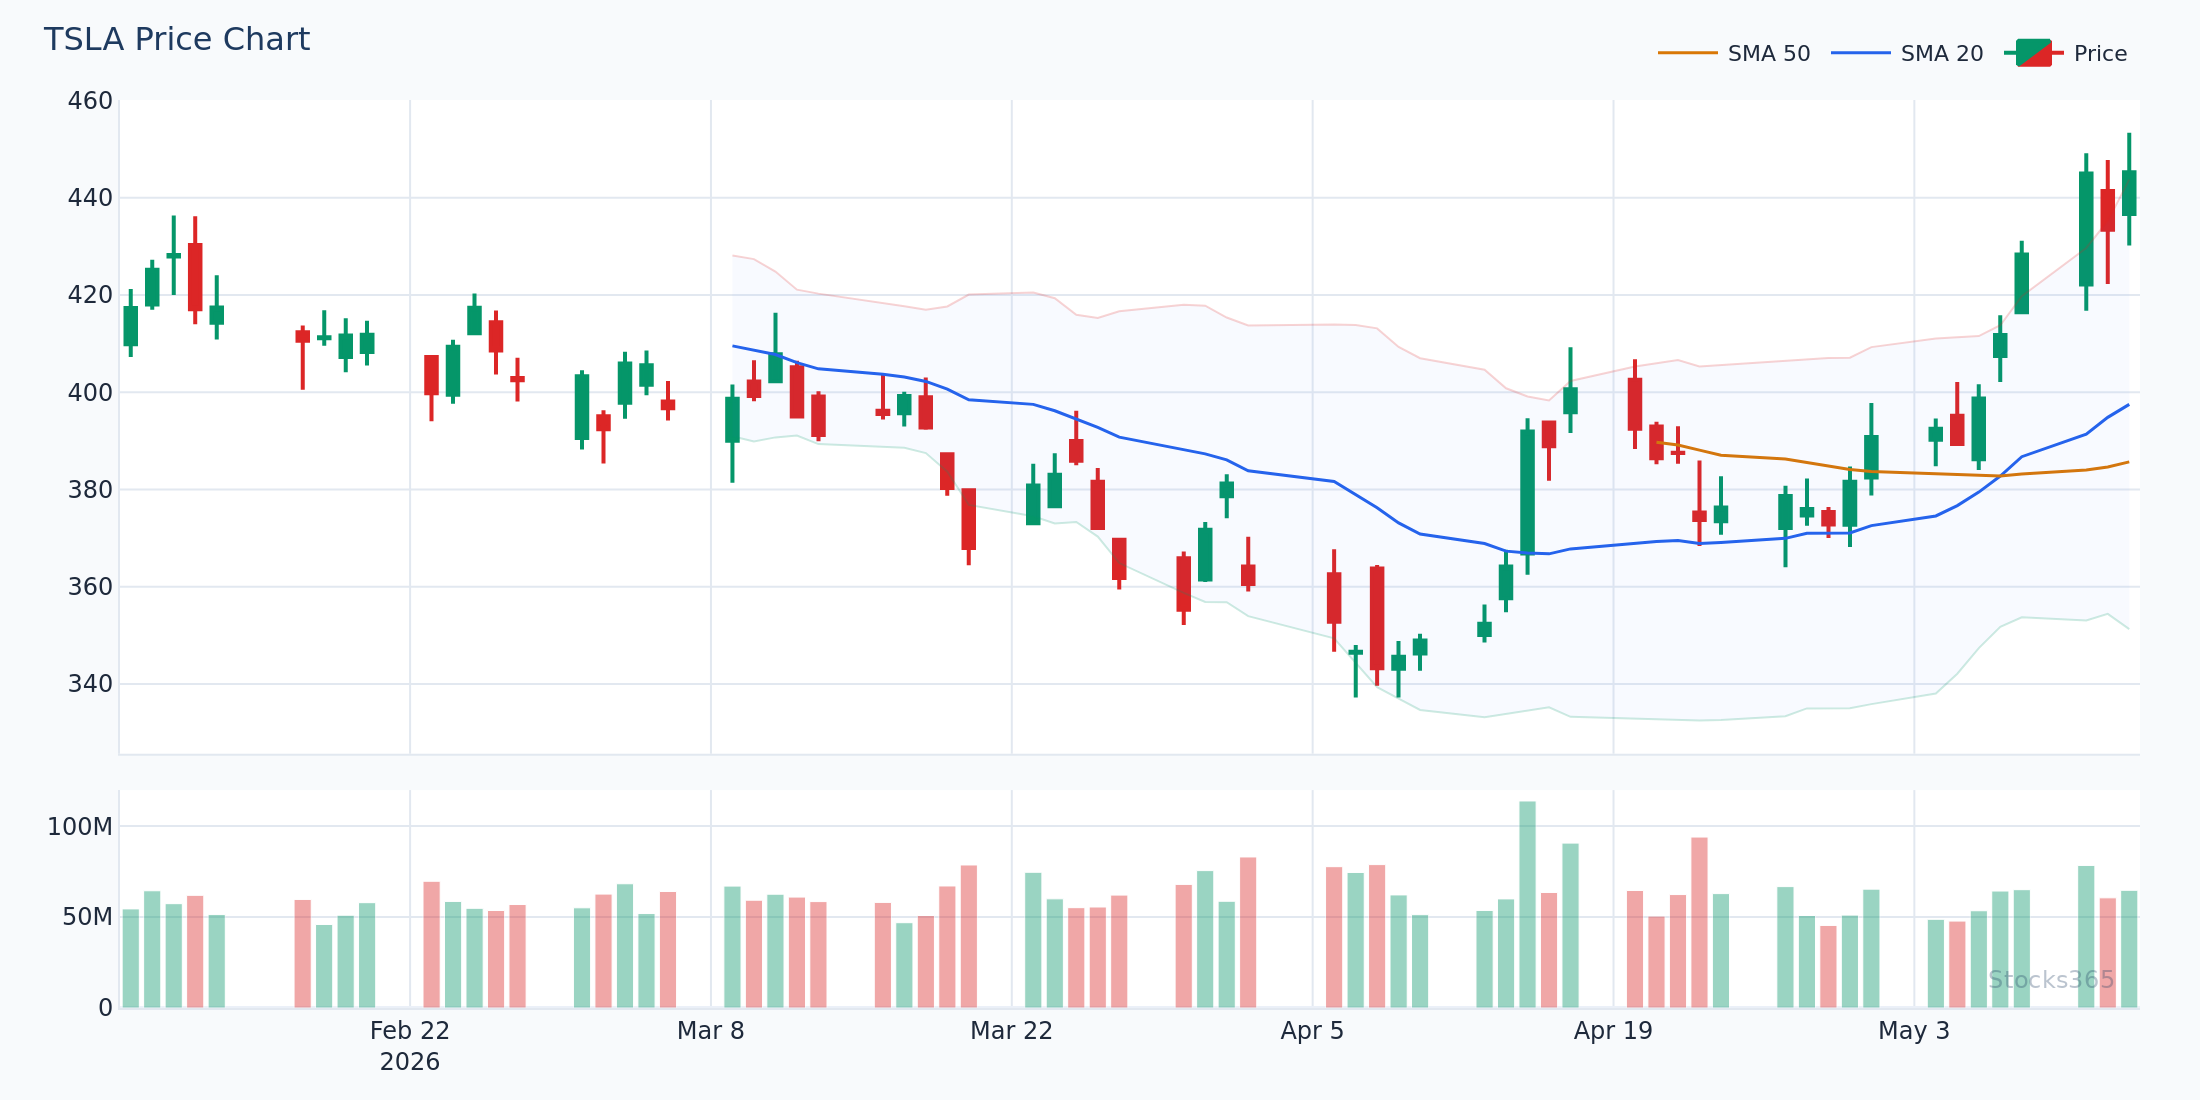
ملف تقلب TSLA يجعله حالة دراسية مثالية لتحسين الفترة. عندما يكسر السعر تحت متوسط 20-EMA صاعد بعد امتداد طويل، تميل الحركة لأن تكون حادة وسريعة — مُؤكدة أن الفترات الأقصر تعمل جيدًا للإمساك بنقاط التحول في الأسماء عالية البيتا. النمط يقوى عندما يُرافق الكسر ارتفاع في الحجم فوق متوسط 20 يومًا، ما يشير إلى توزيع مؤسسي وليس ضجيجًا مؤقتًا.
تحسين فترة المتوسط المتحرك متعدد الأطر الزمنية
التحليل على إطار زمني واحد يُفوّت الصورة الأكبر. أفضل فترة للمتوسط المتحرك لإطار دخولك تعتمد على ما يفعله الإطار الأعلى.
إطار عملي:
- الرسم الأسبوعي: 20-SMA كمرشّح اتجاه كلي. فوقه = انحياز صعودي، تحته = انحياز هبوطي.
- الرسم اليومي: 21-EMA و50-EMA لبنية الاتجاه ومناطق الدخول.
- الرسم 4 ساعات: 9-EMA و20-EMA لتأكيد الزخم وتوقيت دخول دقيق.
عندما تتماشى الأطر الزمنية الثلاثة — الأسبوعي فوق 20-SMA، اليومي فوق 21-EMA، الـ4 ساعات يتراجع إلى 9-EMA — يكون احتمال الاستمرار أعلى بكثير من أيّ إعداد على إطار زمني واحد منفرد.
هذا النهج الطبقي هو ما يفصل التداول المنهجي الاحترافي عن التخمين بالتجزئة.
دمج فترات المتوسط المتحرك مع مؤشرات أخرى
المتوسطات المتحركة لا تعمل بمعزل. أفضل النتائج تأتي من استخدامها كأدوات بنية اتجاه بينما مؤشرات أخرى تتعامل مع الزخم، ظروف ذروة الشراء/البيع، وتوقيت الإشارة.
المزيجات الأكثر فعالية تشمل:
- المتوسط + RSI: استخدم المتوسط لتحديد اتجاه الاتجاه، وRSI لتوقيت الدخولات. تراجع إلى 21-EMA مع وصول RSI لـ 40-45 في اتجاه صاعد هو إعداد إعادة تحميل نموذجي. راجع كيفية تحسين فترات RSI جنبًا إلى جنب مع إعدادات المتوسط في دليلنا حول إعدادات RSI.
- المتوسط + الحجم: استعادة السعر لـ 50-SMA على حجم أعلى من المتوسط يحمل وزنًا أكبر بكثير من انجراف منخفض الحجم فوقه.
- المتوسط + خطوط اتجاه RSI: عندما يثبت السعر فوق 20-SMA ويخترق RSI فوق خط اتجاه هابط، يشير المزيج إلى تحول زخم عالي الثقة. استراتيجية خطوط اتجاه RSI تتزاوج بشكل استثنائي مع تحليل فترة المتوسط.
لا تستخدم أبدًا تقاطع المتوسط المتحرك كإشارة منفردة. إنه مرشّح. عامله كذلك.
الفترات الديناميكية مقابل الثابتة: المتوسطات المتحركة التكيفية
المتوسطات المتحركة ذات الفترات الثابتة لها عيب حاسم واحد: تتصرف بشكل متطابق في الأسواق الاتجاهية والمحدودة. المتوسطات المتحركة التكيفية تحل هذا.
متوسط كوفمان التكيفي (KAMA) ومتوسط الفهرس الديناميكي المتغيّر (VIDYA) يُعدّلان فترتهما الفعلية تلقائيًا بناءً على تقلب السوق. عندما يكون التقلب عاليًا واتجاهيًا، يُقصّران فترتهما الفعلية لاستجابة أسرع. عندما تتقلب الأسواق، يُطيلانها لترشيح الضجيج.
للمتداولين الذين يريدون التحسين دون تعديل يدوي مستمر، المتوسطات التكيفية جديرة بالدراسة. لا تحلّ محل الحاجة لفهم تحسين الفترة — بل تمدّده.
الاختبار التاريخي لإعدادات فترة المتوسط المتحرك
الحدس ليس اختبارًا تاريخيًا. كل إعداد فترة يحتاج بيانات خلفه قبل المخاطرة برأس المال.
عند الاختبار التاريخي لفترات المتوسط المتحرك، تتبع هذه المقاييس:
- نسبة الفوز: أيّ نسبة من الإشارات أسفرت عن نتائج مربحة خلال فترة الاحتفاظ المستهدفة؟
- عامل الربح: إجمالي الربح الإجمالي مقسومًا على إجمالي الخسارة الإجمالية. فوق 1.5 قوي. تحت 1.0 يعني تخسر مالاً إجمالاً.
- تكرار الإشارة: الفترات الأقصر تولّد إشارات أكثر. إشارات أكثر تعني تكاليف معاملة أكثر وقرارات أكثر.
- التراجع: إلى أيّ عمق تذهب سلاسل الخسارة؟ نسبة فوز عالية مع تراجعات هائلة ليست استراتيجية جيدة.
- خصوصية فئة الأصول: النتائج من الأسهم نادرًا ما تنتقل بنظافة إلى الكريبتو أو الفوركس. اختبر كلاً على حدة.
لوحة البحث لدينا توفّر بيانات أداء اختبار تاريخي مجمَّعة عبر آلاف الإشارات حتى تتمكن من مقارنة نتائج استراتيجيتك الخاصة مع خطوط أساس إحصائية حقيقية — وليس حكايات المنتديات.
يمكنك أيضًا استكشاف أداء الإشارات المباشر على أسماء فردية مثل إشارات AAPL لترى كيف تؤدي الإعدادات القائمة على المتوسط المتحرك في ظروف السوق الحالية.
ما الذي يجب مراقبته
- استعادة 20-SMA مع تحول الانحدار: عندما يكسر السعر للأعلى فوق متوسط 20-SMA هابط ثم يبدأ في التسطح والانقلاب صعودًا، هذا التحول في الانحدار أقوى من التقاطع نفسه. راقب هذا النمط على الرسوم اليومية بعد تراجع متعدد الأسابيع — غالبًا يُحدد بداية الساق الاتجاهي التالي.
- انضغاط 50-SMA مع انكماش الحجم: عندما يلتف السعر بإحكام حول 50-SMA على مدار 10–15 جلسة وينخفض الحجم إلى أدنى مستوياته منذ أشهر، تميل حركة التوسع اللاحقة لأن تكون اتجاهية وقوية. متوسط 50-SMA يعمل كمحور ارتكاز للاختراق.
- تباعد فترة المتوسط في الكريبتو: عندما يتقاطع 20-EMA تحت 50-EMA على الرسم اليومي بينما يبقى RSI تحت 50، إعداد التقاطع الهابط للمتوسط أظهر تاريخيًا متابعة قوية في الكريبتو — متسقًا مع نسبة الفوز 66.8% على كسرات 20-SMA الهبوطية التي وثّقناها.
- تراصّ المتوسطات الثلاثة بعد فجوات الأرباح: عندما يقفز سهم على الأرباح وتنحدر المتوسطات الثلاثة (20، 50، 200) صعودًا على الرسم اليومي بعد الفجوة، التراجعات إلى 21-EMA في الأسابيع 2–3 التالية هي دخولات عالية الاحتمال للاستمرار. التأكيد الرئيسي هو بقاء RSI فوق 50 خلال التراجع.
- أنماط فشل التقاطع: تقاطع السعر فوق 20-SMA يعكس فورًا للأسفل خلال 1–2 شمعة — التقاطع الفاشل — هو إشارة هبوطية أقوى من الانهيار النظيف. المشترون بالتجزئة علقوا في الاختراق الخاطئ. راقب هذا النمط خصوصًا في الفوركس والكريبتو، حيث التقاطعات الفاشلة تسبق حركات سريعة للأسفل.
كيف تستخدم Stocks365 هذا
تحليل فترة المتوسط المتحرك في نظام درجة الثقة من Stocks365
تدمج Stocks365 تحليل فترة المتوسط المتحرك مباشرةً في نظام درجة الثقة متعدد المؤشرات. تُقيّم المنصة موضع السعر بالنسبة لفترات متوسط متعددة في وقت واحد — بما في ذلك متوسطات 20، 50، و200 فترة SMA وEMA — كجزء من مكوّن تسجيل حالة الاتجاه. عندما تتفق بنية السعر، تراصّ المتوسطات، واتجاه الانحدار عبر الأطر الزمنية، تعكس درجة الثقة تقاربًا أعلى. على العكس، عندما تتضارب المتوسطات (قصير الأجل صعودي، طويل الأجل هبوطي)، تُشير درجة الثقة إلى الإعداد كمنخفض القناعة وتُقلل وزن ثقة الإشارة وفقًا لذلك.
هذا يمنع المتداولين من التصرف بناءً على إشارات مؤشر واحد في ظروف غامضة. تحليل فترة المتوسط يساهم في كلٍّ من نقاط اتفاق الاتجاه وتصنيف الحالة — اثنان من أكثر من 12 عاملاً يُقيَّمون على كل إشارة في لوحة إشارات Stocks365. النتيجة: لا ترى فقط ما إذا أطلق المتوسط المتحرك، بل ما إذا كان السياق الهيكلي الأوسع يدعم متابعته.
النقاط الرئيسية
- لا توجد فترة واحدة أفضل عالميًا. اختيار الفترة يجب أن يتطابق مع فترة احتفاظك، فئة الأصول، وحالة السوق الحالية.
- متوسط 20-SMA نقطة بداية، وليس استراتيجية كاملة. نسب الفوز المختبَرة 48–51% تُؤكد أنه يحتاج تقاربًا إضافيًا لتوليد ميزة.
- الفوركس يُحقق أداءً ضعيفًا في استراتيجيات تقاطع 20-SMA (نسبة فوز 42.5%). الكريبتو يتفوق على التقاطعات الهبوطية (66.8%). اعرف سلوك فئة أصولك.
- متوسطات EMA تستجيب أسرع، SMA تُرشّح بشكل أفضل. طابق نوع الحساب مع تقلب الأصل.
- التماشي متعدد الأطر الزمنية يُضاعف الاحتمال. إعداد يومي مدعوم ببنية اتجاه أسبوعية أقوى من أيّ منهما منفردًا.
- المتوسطات المتحركة مرشّحات اتجاه، وليست إشارات دخول. اجمعها مع RSI، الحجم، وحركة السعر لإعدادات عالية الجودة.
- اختبر إعداداتك الخاصة للفترة تاريخيًا على فئة أصولك الخاصة قبل إلزام رأس المال. المعايير من أسواق أخرى لا تنتقل بنظافة.