
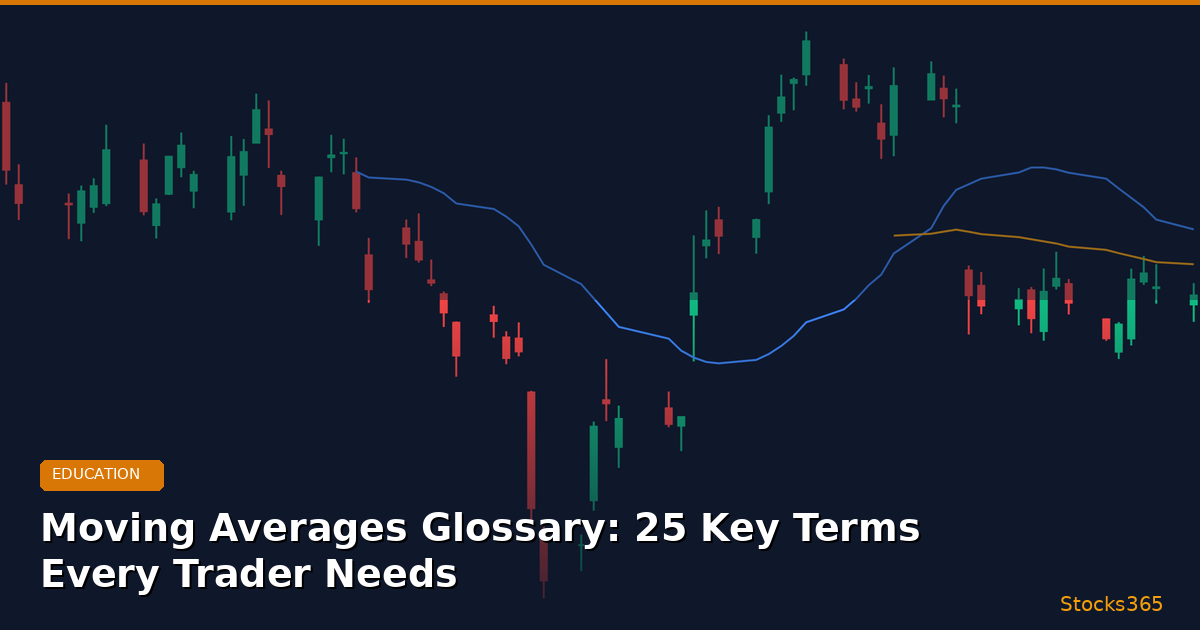
Moving Averages Glossary: 25 Key Terms Every Trader Needs to Know
Moving averages are the backbone of technical analysis. They appear on virtually every professional chart, power dozens of strategy frameworks, and form the foundation of momentum, trend, and mean-reversion systems alike. Yet most traders use them without truly understanding the language around them.
That's a problem. Because precision matters in trading.
Stocks365 backtested 3,332 price-crosses-below-SMA-20 signals across multiple asset classes and found a 50.9% win rate — but the range between best and worst performers was enormous, from 66.8% in crypto down to 42.5% in forex. That gap exists almost entirely because traders misapply moving average concepts without understanding the context behind them. The terminology isn't just academic. It defines how and when you enter.
This glossary covers 25 essential moving average trading terms — defined clearly, applied practically, and organized so you can build real trading intelligence from the ground up.
Core Moving Average Types
1. Simple Moving Average (SMA)
The SMA calculates the arithmetic mean of a security's price over a defined number of periods. Add the closing prices for N periods, divide by N. That's it. The 20-SMA, 50-SMA, and 200-SMA are the most widely watched levels in professional trading. Simplicity is its strength — and its limitation. Every period carries equal weight, which means a spike from 30 days ago affects today's value just as much as yesterday's close.
2. Exponential Moving Average (EMA)
The EMA applies a multiplier that gives more weight to recent prices. This makes it more responsive to new data. When price breaks above the 20-EMA on surging volume, that signal is typically faster and sharper than the equivalent SMA signal. Momentum traders favor EMAs. Swing traders often prefer SMAs for cleaner trend definitions.
3. Weighted Moving Average (WMA)
The WMA assigns linearly increasing weights to each period — the most recent close gets the highest weight, and each prior period gets progressively less. It's more reactive than the SMA but slightly less aggressive than the EMA. Less common in retail trading platforms but frequently used in institutional quantitative models.
4. Hull Moving Average (HMA)
Developed by Alan Hull to reduce lag while maintaining smoothness. The HMA uses weighted moving averages in a multi-step calculation that produces a line that tracks price more tightly than a standard EMA of the same period. Popular among algorithmic traders who need low-lag signals without sacrificing too much noise filtration.
5. Volume-Weighted Moving Average (VWMA)
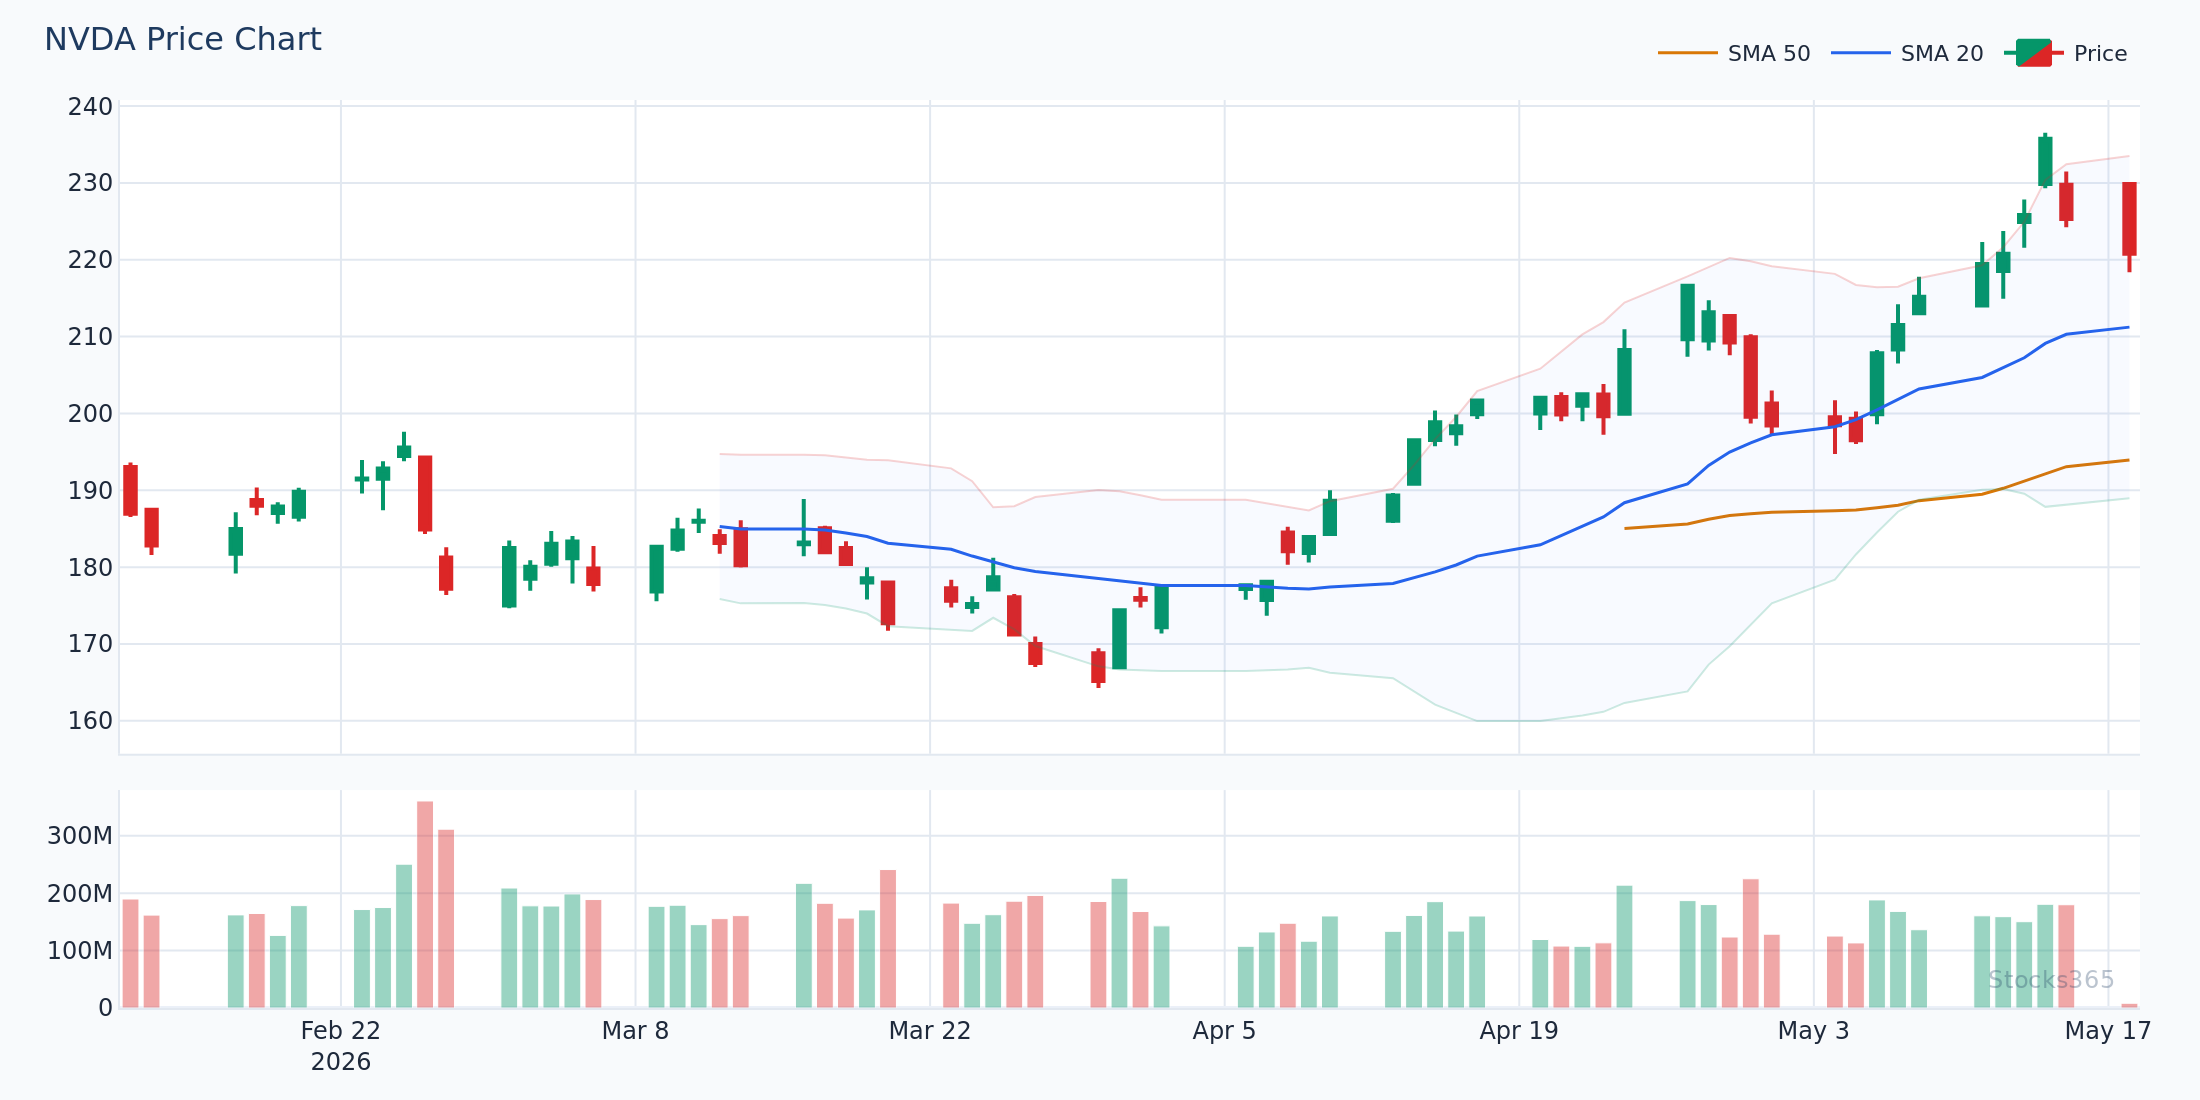
The VWMA weights each price by the volume traded at that price, then calculates an average. When volume is high, those price levels carry more influence. This makes the VWMA especially powerful in equities, where institutional order flow creates high-volume price clusters that act as real support and resistance. Watch for price reclaiming the VWMA after a volume-driven sell-off — that's often the first clean long entry.
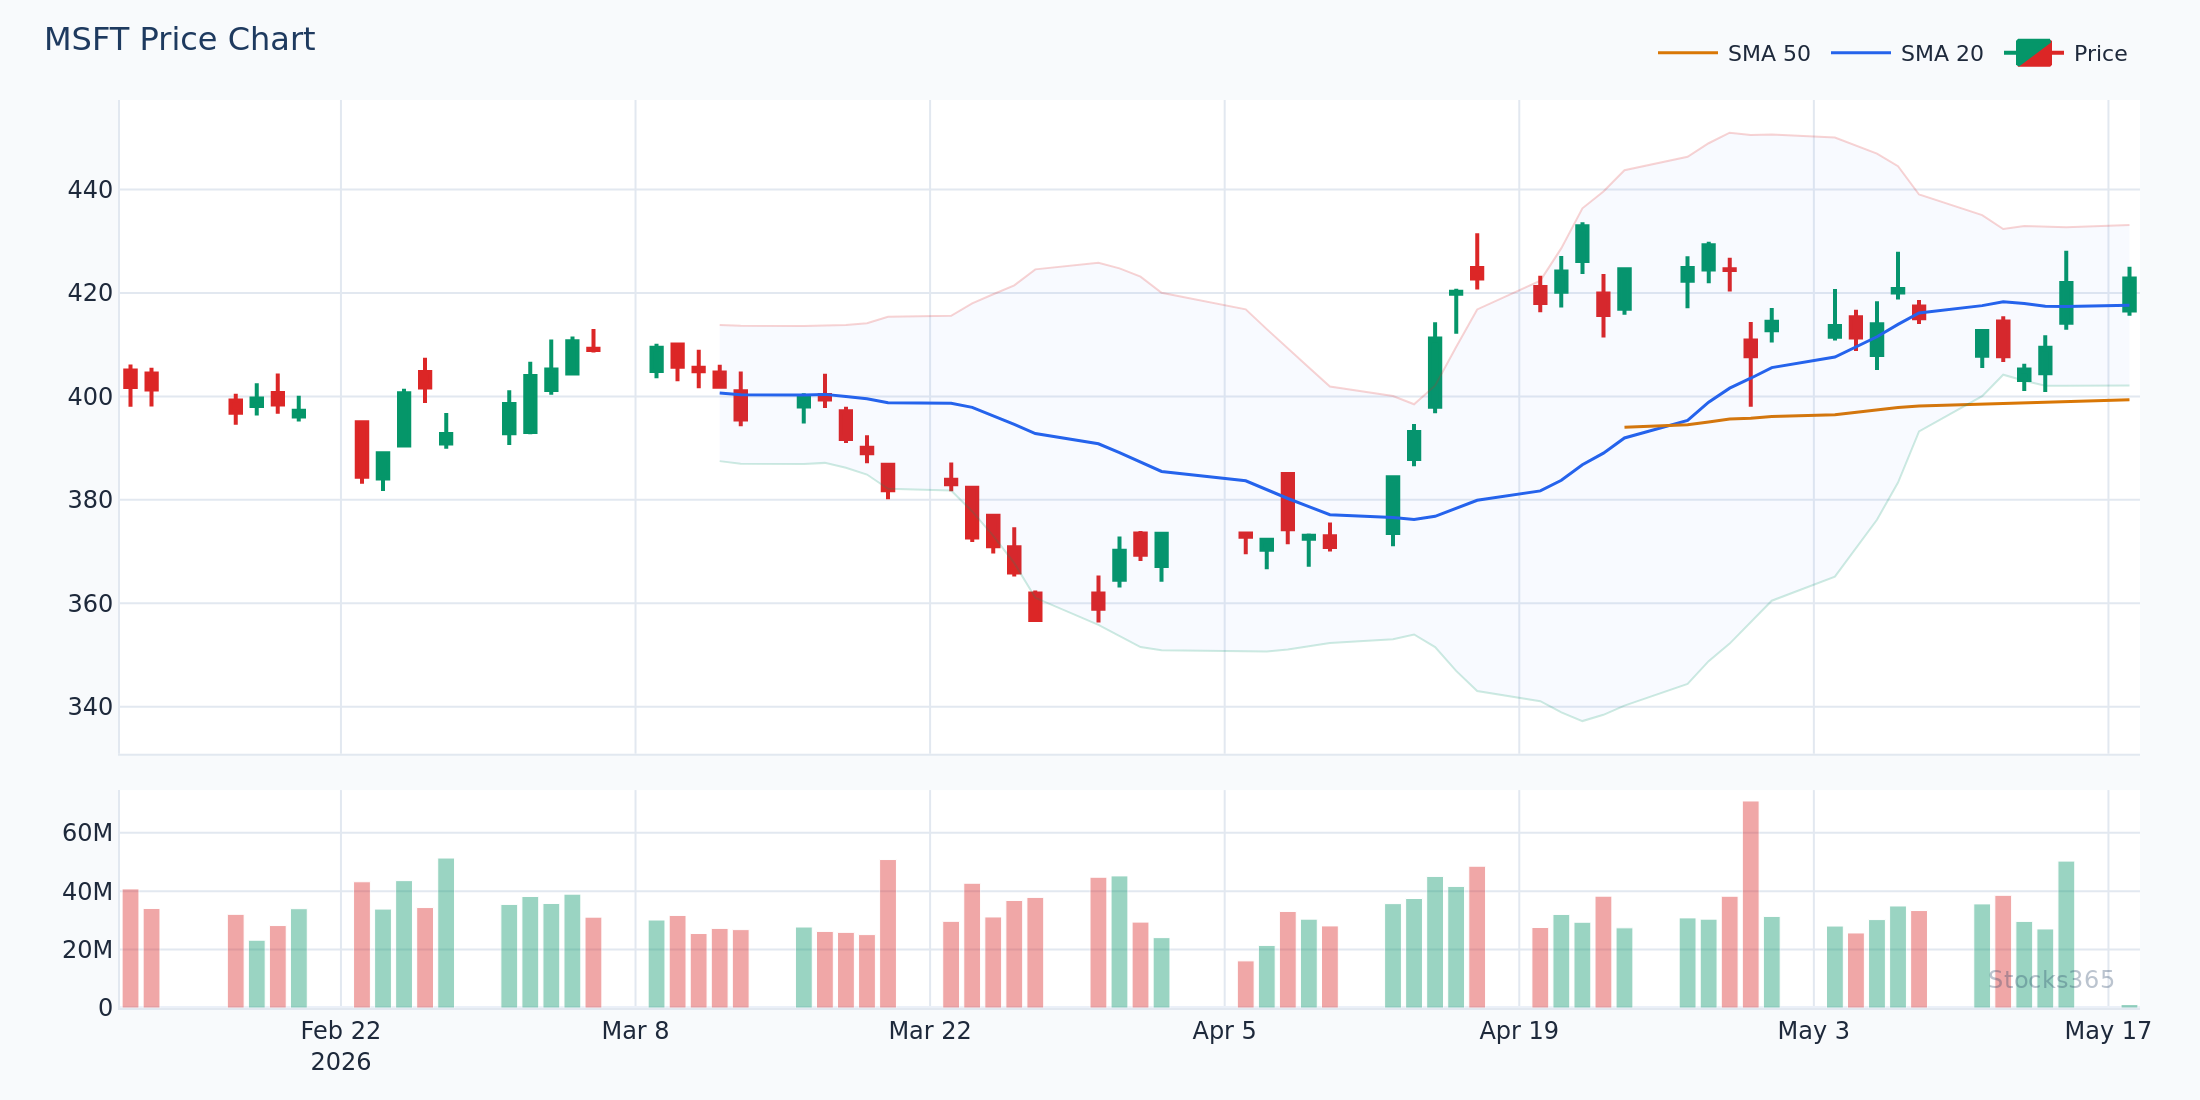
This chart shows price interacting with both the 20-SMA and 50-SMA after a period of compression. When the shorter average curves upward and begins closing the gap with the longer one, a crossover becomes increasingly likely. A confirmed close above both averages on above-average volume validates the bullish shift. If price immediately reverses below the 20-SMA after the crossover, the signal is invalidated and re-entry should wait for a retест.
Moving Average Periods and Timeframes
6. Short-Term Moving Average
Typically refers to averages spanning 5 to 20 periods. These react quickly to price changes and are used primarily for momentum and intraday trend identification. The 9-EMA and 20-SMA are the most widely used short-term averages in retail and professional trading environments.
7. Medium-Term Moving Average
Generally spans 20 to 100 periods. The 50-SMA is the defining medium-term average. It filters out short-term noise while still reflecting the current trend phase. When price holds above the 50-SMA across multiple weeks, the medium-term trend is clearly bullish.
8. Long-Term Moving Average
The 200-SMA is the gold standard. Institutional funds, pension managers, and algorithmic systems all reference the 200-SMA when categorizing whether a market is in a bull or bear regime. Price above the 200-SMA is the single most-watched macro filter in technical analysis.
9. Lookback Period
The number of bars or candles included in a moving average calculation. A 50-period SMA on a daily chart uses 50 days of closing prices. The same 50-period SMA on a 4-hour chart uses 50 four-hour candles — roughly 8 trading days. Understanding your lookback period relative to your timeframe is non-negotiable. Mismatched periods generate misleading signals.
Moving Average Crossover Terms
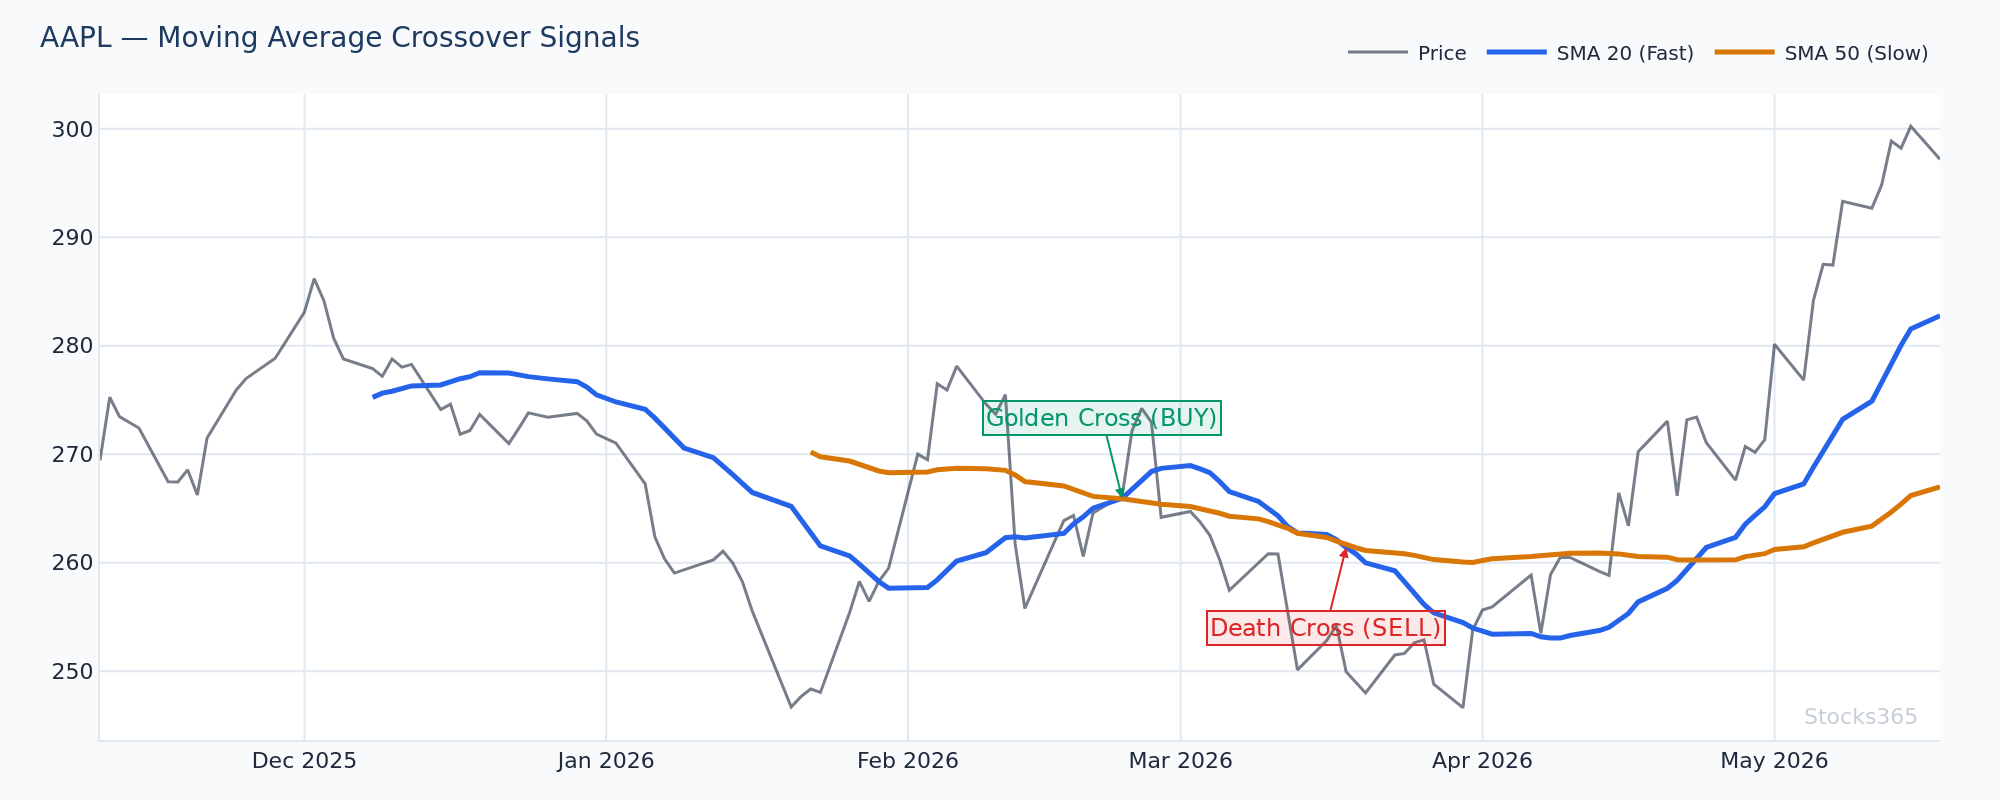
10. Golden Cross
A golden cross occurs when the 50-SMA crosses above the 200-SMA on a daily chart. This is one of the most widely recognized bullish signals in technical analysis. It confirms a long-term regime shift from bearish to bullish. The move doesn't have to be explosive — often price consolidates for weeks after a golden cross before the real trend acceleration begins. For more on crossover strategy mechanics, read our Moving Average Crossover Strategy: Complete Trading Guide.
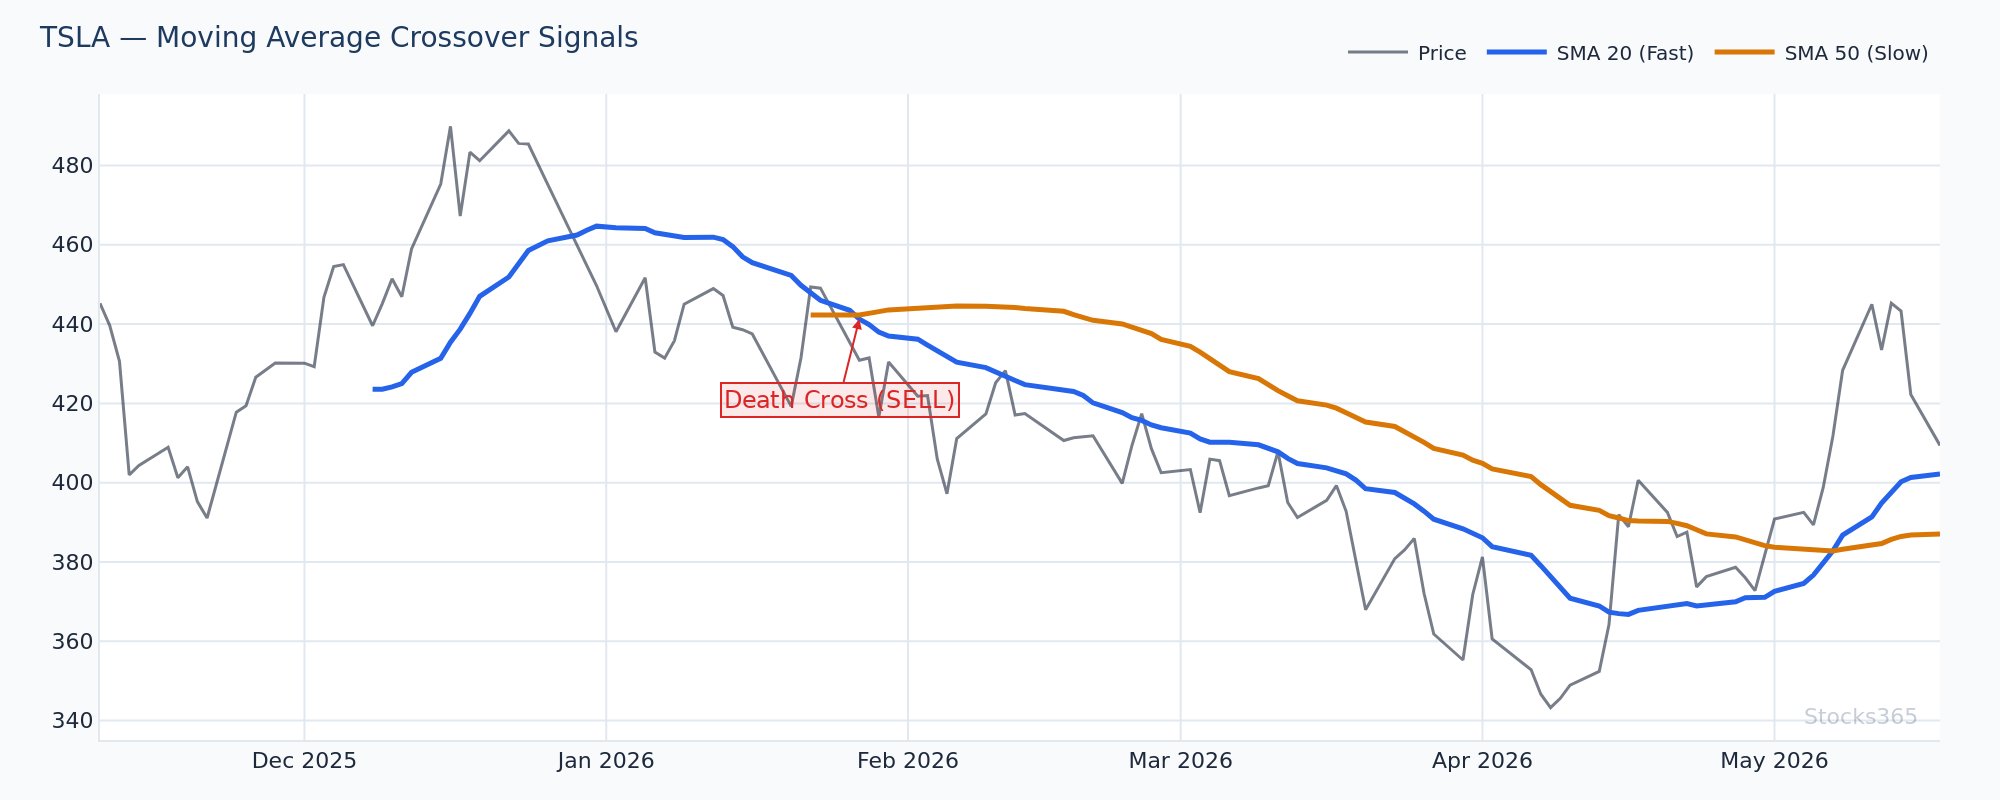
11. Death Cross
The inverse of the golden cross. When the 50-SMA crosses below the 200-SMA, the death cross signals a long-term bearish regime. It often appears after a significant trend reversal has already occurred, making it a confirmation signal rather than an early warning. Don't chase shorts the moment the cross appears — look for the first rally rejection as the higher-probability short entry.
12. Bullish Crossover
Any crossover where a shorter-period moving average crosses above a longer-period moving average. This applies across any combination of periods — 9/21, 20/50, 50/200. The significance of the signal scales with the periods involved. A 9/21 EMA cross on a 15-minute chart is a scalp signal. A 50/200 SMA cross on a daily chart is a regime signal.
13. Bearish Crossover
The opposite — a shorter moving average crosses below a longer one. Bearish crossovers in downtrending markets carry strong momentum implications. In sideways or choppy markets, they generate false signals at a high rate. Context is everything.
This setup illustrates a bearish crossover forming after an extended distribution phase — price making lower highs while the short-term average curves downward toward the medium-term average. Once the cross is confirmed, the first bounce toward the now-resistance moving average typically offers a cleaner short entry than the crossover candle itself. The pattern fails if price reclaims both averages with a strong-volume close.
Price and Moving Average Relationship Terms
14. Price Above Moving Average
When price trades above a given moving average, that average acts as dynamic support. This is the fundamental definition of an uptrend relative to any specific time horizon. Price above the 20-SMA means short-term trend is bullish. Price above the 200-SMA means long-term trend is bullish. Both conditions simultaneously? That's an aligned trend environment — and the highest-probability setup category.
15. Price Below Moving Average
The inverse. Moving averages flip from support to resistance when price breaks below them with conviction. A failed attempt to reclaim a moving average is one of the cleanest short setups in technical trading. Watch for the retest, watch for rejection, watch for volume to confirm the move.
Here's what most traders get wrong: They treat a price break above a moving average as an instant buy signal. It's not. The signal is the hold. Price breaking above the 50-SMA only matters if it can close a second and third candle above it. A single-candle pierce that immediately reverses is a trap — and professional algorithms are specifically designed to hunt those stops. The edge isn't in the cross. The edge is in the confirmation.
16. Dynamic Support and Resistance
Unlike horizontal support and resistance levels, dynamic levels move with price. Moving averages are the primary tool for identifying dynamic support and resistance. The 20-EMA acts as dynamic support in strong uptrends. The 200-SMA acts as major dynamic resistance in bear markets. These levels update every bar — which makes them far more actionable than static lines drawn months ago.
17. Mean Reversion
The tendency of price to return to its moving average after extended deviation. When price runs 15-20% above its 200-SMA without consolidation, mean reversion pressure builds. This doesn't mean immediate reversal — it means the risk profile of chasing further upside increases dramatically. Mean reversion strategies fade extreme extensions back toward the average. Trend-following strategies ignore them. Know which game you're playing.
18. Moving Average Slope
The direction and angle of a moving average reveals trend momentum. A steeply rising 50-SMA signals strong bullish momentum. A flattening 200-SMA suggests a trend losing conviction. The slope matters as much as the price position relative to the average. A rising price that crosses a downward-sloping 50-SMA carries less weight than the same cross with an upward-sloping average.
This setup shows multiple successful bounces off a rising 50-SMA, each with decreasing sell volume on the touch. When the average is rising and price repeatedly respects it, each subsequent touch becomes a higher-probability long entry. The setup breaks down if price closes below the 50-SMA on a high-volume candle — at that point, the dynamic support has failed and the average begins functioning as resistance.
Advanced Moving Average Concepts
19. Moving Average Ribbon
A moving average ribbon plots multiple moving averages simultaneously — typically 6 to 12 EMAs spread across different periods. When the ribbon expands (averages fan out), trend momentum is strong. When the ribbon compresses (averages converge), the trend is weakening or a reversal is approaching. Ribbon expansion in the direction of the trend is one of the cleanest continuation signals available. For a structured approach using three specific averages, see our Triple Moving Average Strategy for Trend Confirmation.
20. Adaptive Moving Average (AMA)
An AMA automatically adjusts its sensitivity based on market volatility. During trending conditions, it behaves like a fast EMA and tracks price closely. During choppy conditions, it slows down and filters noise. Perry Kaufman's KAMA is the most widely known version. Adaptive averages reduce whipsaw signals in ranging markets — a significant practical advantage over fixed-period averages.
21. Moving Average Envelope
Envelopes plot two bands at a fixed percentage above and below a moving average. When price reaches the upper envelope, it's statistically extended to the upside. Lower envelope touches signal oversold conditions relative to the average. Unlike Bollinger Bands, envelope width is fixed rather than volatility-adjusted — which makes them better for stable, low-volatility assets. For a powerful combination of averages and volatility bands, explore our Moving Average + Bollinger Bands: Complete Strategy Guide.
22. Lag
Lag is the delay between a price move and a moving average's response to it. All moving averages lag by definition — they're calculations of past prices. The longer the period, the greater the lag. EMAs reduce lag relative to SMAs of the same period. HMAs reduce it further. But reducing lag always increases noise. Every trader must find their own balance between signal responsiveness and false positives.
23. Whipsaw
A whipsaw occurs when price crosses a moving average, triggers a signal, then immediately reverses — generating a losing trade. Whipsaws are the primary cost of using moving average crossover systems. They cluster in sideways, choppy markets where price oscillates around the average without establishing direction. The solution isn't a better moving average — it's a regime filter. Only take crossover signals when the broader trend is already established.
24. Moving Average Convergence Divergence (MACD)
MACD is a momentum oscillator built entirely from moving averages. It calculates the difference between a 12-period EMA and a 26-period EMA, then plots a 9-period EMA of that difference as a signal line. While it's often categorized separately, MACD is fundamentally a moving average derivative — which is why understanding pure MA concepts makes MACD interpretation sharper and faster. For forex-specific MACD applications, see our MACD in Forex Trading: Master Currency Pair Strategies.
This chart shows the MACD histogram expanding positively while price consolidates in a tight range above the 20-EMA — a classic pre-breakout setup. When the histogram grows while price is sideways, momentum is building beneath the surface. A breakout above the consolidation range on expanding volume, with the histogram still positive, typically leads to an extended trending move. The setup fails if the histogram turns negative before price breaks out.
25. Moving Average Channel
A moving average channel uses two moving averages of different periods to create a zone rather than a single line. Price trading between the 20-EMA and 50-EMA in an uptrend represents a healthy pullback zone — an area where trend continuation entries carry favorable risk/reward. Breakouts above the channel signal momentum acceleration. Breaks below signal trend deterioration. Channels convert a single average into a tradeable range.
Putting the Terminology Together: How These Terms Build Real Strategy
Knowing the definitions is only the first step. The power comes from combining these concepts into coherent frameworks.
Consider a straightforward example: price trades in a bullish trend (above the 200-SMA), pulls back to dynamic support at the 50-SMA, then shows a bullish crossover of the 9-EMA back above the 20-EMA on rising volume. Each element of that description uses the terminology from this glossary — and together, they define a high-conviction entry setup rather than a random trade.
Or consider the opposite: price experiences a death cross, rallies into the now-resistance 50-SMA, shows a bearish crossover of short-term averages at that level, and the MACD histogram turns negative. Every term connects to every other. The language creates the strategy.
Moving average trading terms aren't vocabulary exercises. They're the scaffolding of repeatable, systematic trading decisions.
For traders combining moving averages with momentum oscillators, our RSI Trendline Strategy guide shows how to layer RSI signals on top of moving average structure for higher-probability entries. And if you're newer to momentum indicators, start with RSI for Beginners: 5 Simple Rules to Start Trading Today before combining systems.
Our research dashboard tracks live performance data across all major indicator combinations — including moving average setups across equities, forex, and crypto — so you can see which configurations are working in current market conditions, not just historically.
What to Watch For
- Moving average ribbon compression on trending assets: When 6+ EMAs converge into a tight band after a sustained trend, the subsequent expansion typically produces the strongest directional move of the cycle. The tighter the compression, the more explosive the breakout tends to be.
- Price reclaiming the 200-SMA after an extended period below it: The first confirmed weekly close back above the 200-SMA following a prolonged downtrend is historically one of the highest win-rate setups in equities. The first retest of the 200-SMA from above often provides the cleaner entry.
- Bearish crossover forming within a moving average channel in crypto: Given that Stocks365 backtested data shows crypto as the strongest performer for downside moves off the 20-SMA (66.8% win rate on price-crosses-below), watch for 9/21 EMA bearish crossovers forming inside the 20-50 SMA channel zone — that confluence historically produces high-conviction momentum moves.
- Slope divergence between short and long averages: When the 20-EMA is rising but the 50-SMA is still falling, the trend is in transition — not yet confirmed. High-probability entries wait for both averages to slope in the same direction before committing full size.
- Whipsaw clustering as a regime signal: If your moving average crossover system triggers three or more losing trades in quick succession, that's not bad luck — it's a ranging market telling you to step aside. Monitor average true range (ATR) and moving average slope to identify when the trend regime returns.
📊 How Stocks365 Uses Moving Averages
Moving averages are embedded throughout the Stocks365 Trust Score system. Specifically, the relationship between price and key SMAs (20, 50, and 200) contributes to the trend regime score — one of 12+ indicator components that power each signal's Trust Score rating.
When price holds above multiple moving averages with rising slopes, the trend regime component scores bullish, increasing the overall Trust Score for long-side signals on that asset. When averages converge or produce conflicting signals, the regime score drops — flagging the setup as lower conviction before you ever look at the chart manually.
Every signal in the Stocks365 signals dashboard reflects this moving average context automatically. For individual stock signals — like AAPL — the dashboard displays the current moving average alignment alongside RSI, MACD, Bollinger Band position, and volume metrics in a single Trust Score reading. No manual indicator-stacking required.
🎯 Key Takeaways
- SMA vs. EMA: SMAs weight all periods equally; EMAs prioritize recent data. Use EMAs for momentum, SMAs for trend structure.
- Crossovers are confirmation, not prediction: The golden cross and death cross confirm regime shifts — they don't predict them in advance.
- Lag is unavoidable: Every moving average lags price. The goal is balancing responsiveness against noise, not eliminating lag entirely.
- Dynamic support and resistance: Moving averages create levels that move with price — more actionable than static lines in trending markets.
- Context determines signal quality: A bullish crossover in an uptrend is a continuation signal. The same crossover in a downtrend is often a whipsaw. Regime matters.
- Asset class matters for MA strategies: Backtested data shows significant performance variation — crypto and stocks respond differently to the same moving average setups.
- MACD is a moving average derivative: Understanding core MA concepts makes every MACD reading sharper and more interpretable.