
How to Read MACD Signals: A Step-by-Step Guide
The MACD is one of the most widely used momentum indicators in trading. And one of the most misread. Most traders see a bullish crossover and buy immediately — then wonder why the trade moves against them within days. The signal wasn't wrong. The interpretation was.
This guide breaks down exactly how to read MACD signals, step by step. From the math underneath it to the setups that actually produce edge — and the ones that only look like they do.
Stocks365 backtested 2,310 MACD bullish cross signals across multiple asset classes and found a 49.7% win rate over a 10-day holding period — with commodities leading at 55.2% and crypto lagging at 39.2%. That tells you something important before you even draw your first signal line: context changes everything.
What Is MACD? The Foundation You Need First
MACD stands for Moving Average Convergence Divergence. Developed by Gerald Appel in the late 1970s, it measures the relationship between two exponential moving averages (EMAs) of price. The default settings — 12, 26, and 9 periods — remain the industry standard for a reason: they balance responsiveness with noise reduction across most timeframes.
Three components make up the MACD display:
- The MACD Line: The difference between the 12-period EMA and the 26-period EMA. When price momentum accelerates upward, this line rises. When it stalls or reverses, it drops.
- The Signal Line: A 9-period EMA of the MACD line itself. It smooths out the MACD line, making crossovers more readable.
- The Histogram: The visual representation of the gap between the MACD line and the Signal line. Expanding bars mean momentum is building. Shrinking bars mean it's fading.
Understanding these three elements individually is the difference between reading MACD and using MACD. They tell different stories. A skilled trader reads all three simultaneously.
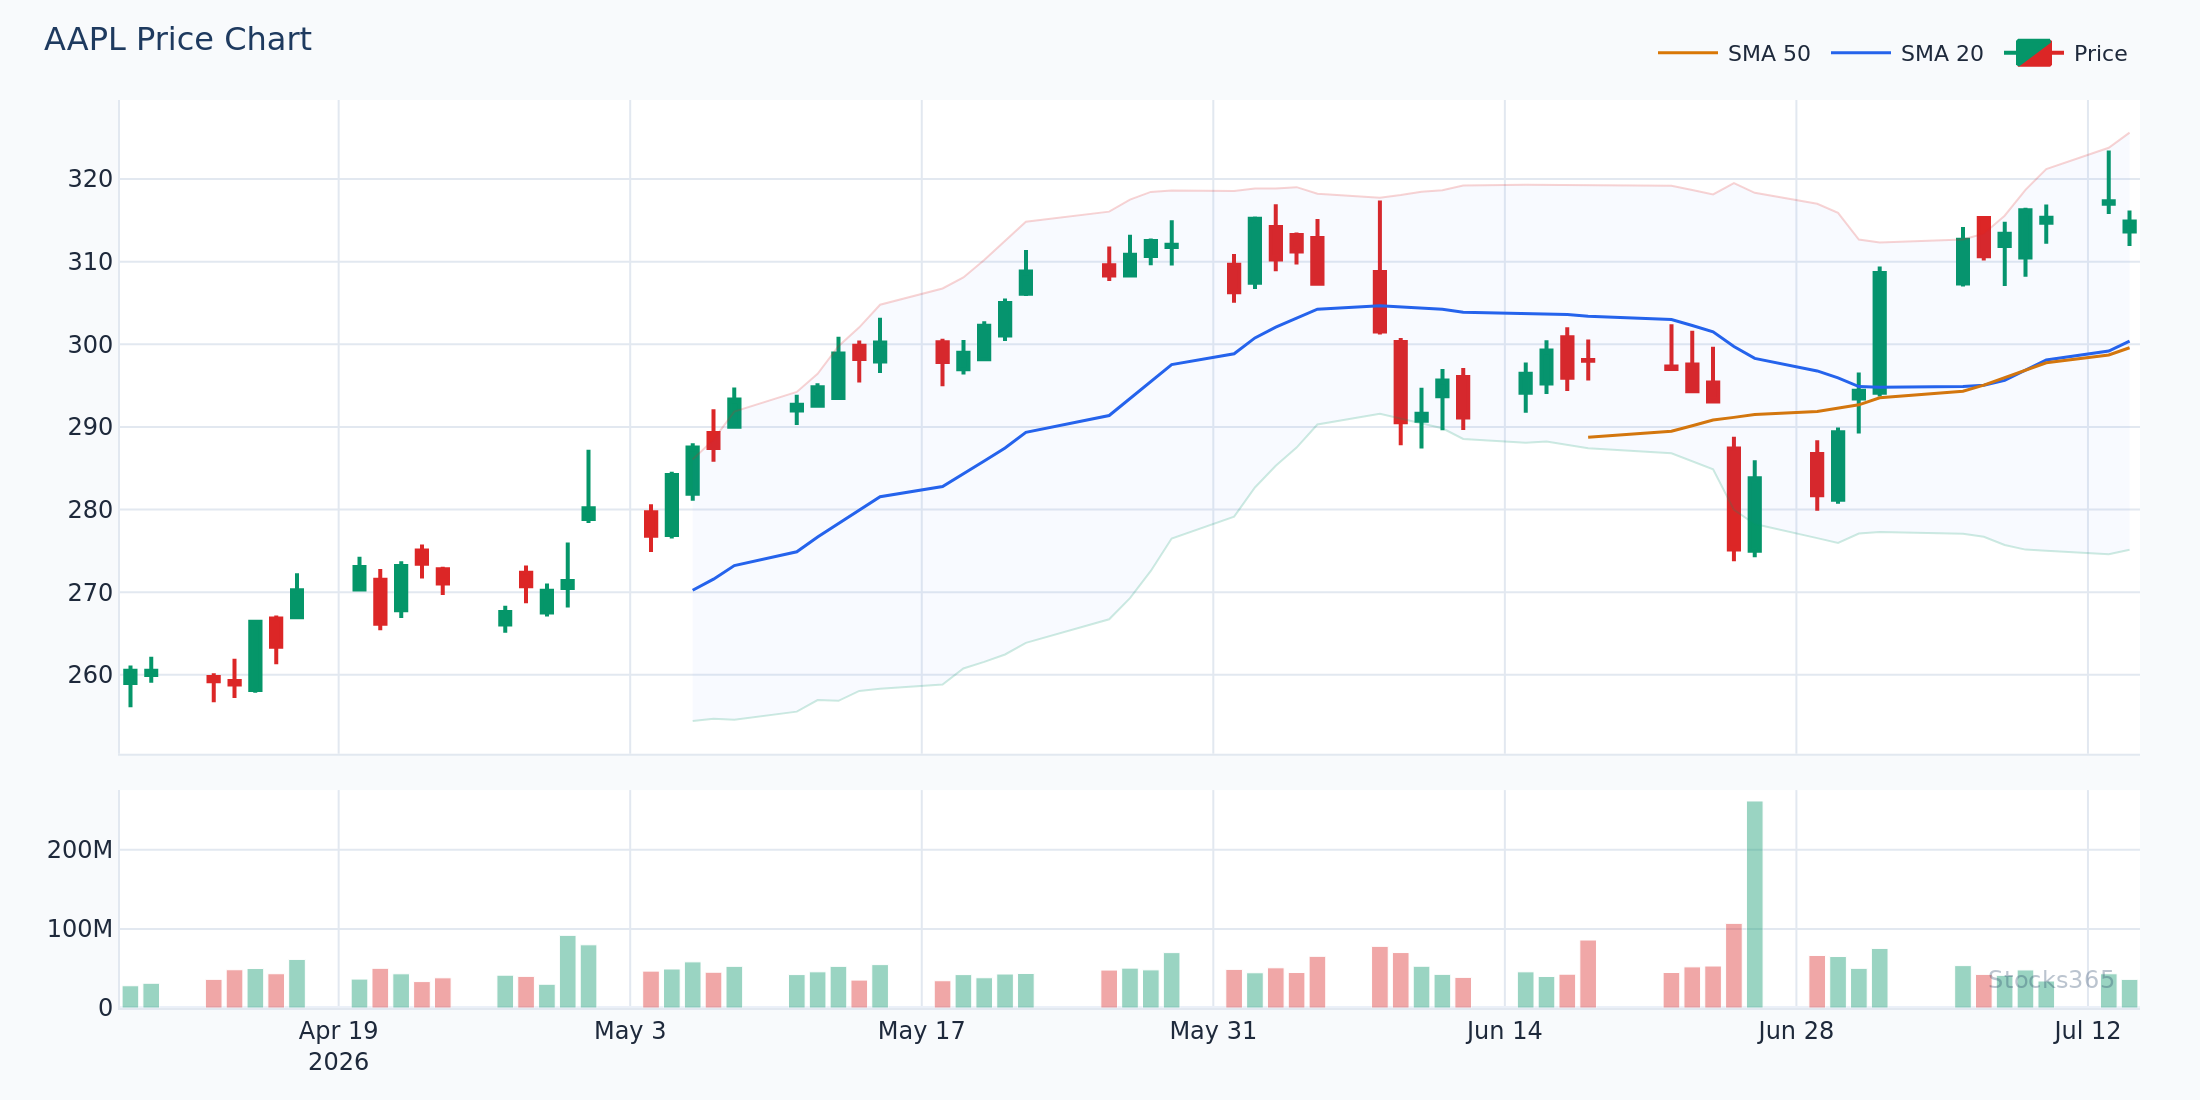
This chart shows all three MACD components in action. Notice how the histogram starts shrinking before the MACD line crosses the signal line — that early warning is the setup most traders miss. When the histogram bars flip from growing to shrinking, momentum is already shifting. A confirmed crossover shortly after validates the direction.
Step 1 — Read the MACD Line vs. Signal Line Crossover
The crossover is the most recognizable MACD signal. Here's how it works in plain terms:
- Bullish crossover: The MACD line crosses above the Signal line. Momentum is shifting to the upside.
- Bearish crossover: The MACD line crosses below the Signal line. Momentum is shifting to the downside.
Simple. But here's where most beginners go wrong.
Here's what most traders get wrong: They treat every MACD crossover as an automatic entry signal. It isn't. A MACD crossover tells you momentum is shifting — not that price has confirmed a new trend. In a choppy, sideways market, MACD crossovers fire constantly and nearly all of them fail. The signal becomes reliable when it occurs after a sustained trend move, when price is near a meaningful structure level, or when confirmed by a companion indicator. A crossover in isolation is a heads-up. A crossover with confirmation is a trade.
How to Confirm a MACD Crossover
Use at least one of the following filters before acting on a crossover signal:
- Price breaks above or below a key moving average at the same time (e.g., the 20-day EMA)
- Volume surges above the 20-session average on the crossover candle
- RSI is in a neutral zone (40–60 for bullish, 60–40 for bearish), showing room to run
- The crossover occurs above the zero line for bullish setups, below it for bearish ones
That last point matters more than most guides acknowledge. A bullish crossover that happens above the zero line means the shorter EMA is still above the longer EMA — the underlying trend is already supportive. A crossover below zero is a counter-trend signal. Those require extra confirmation and tighter risk management.
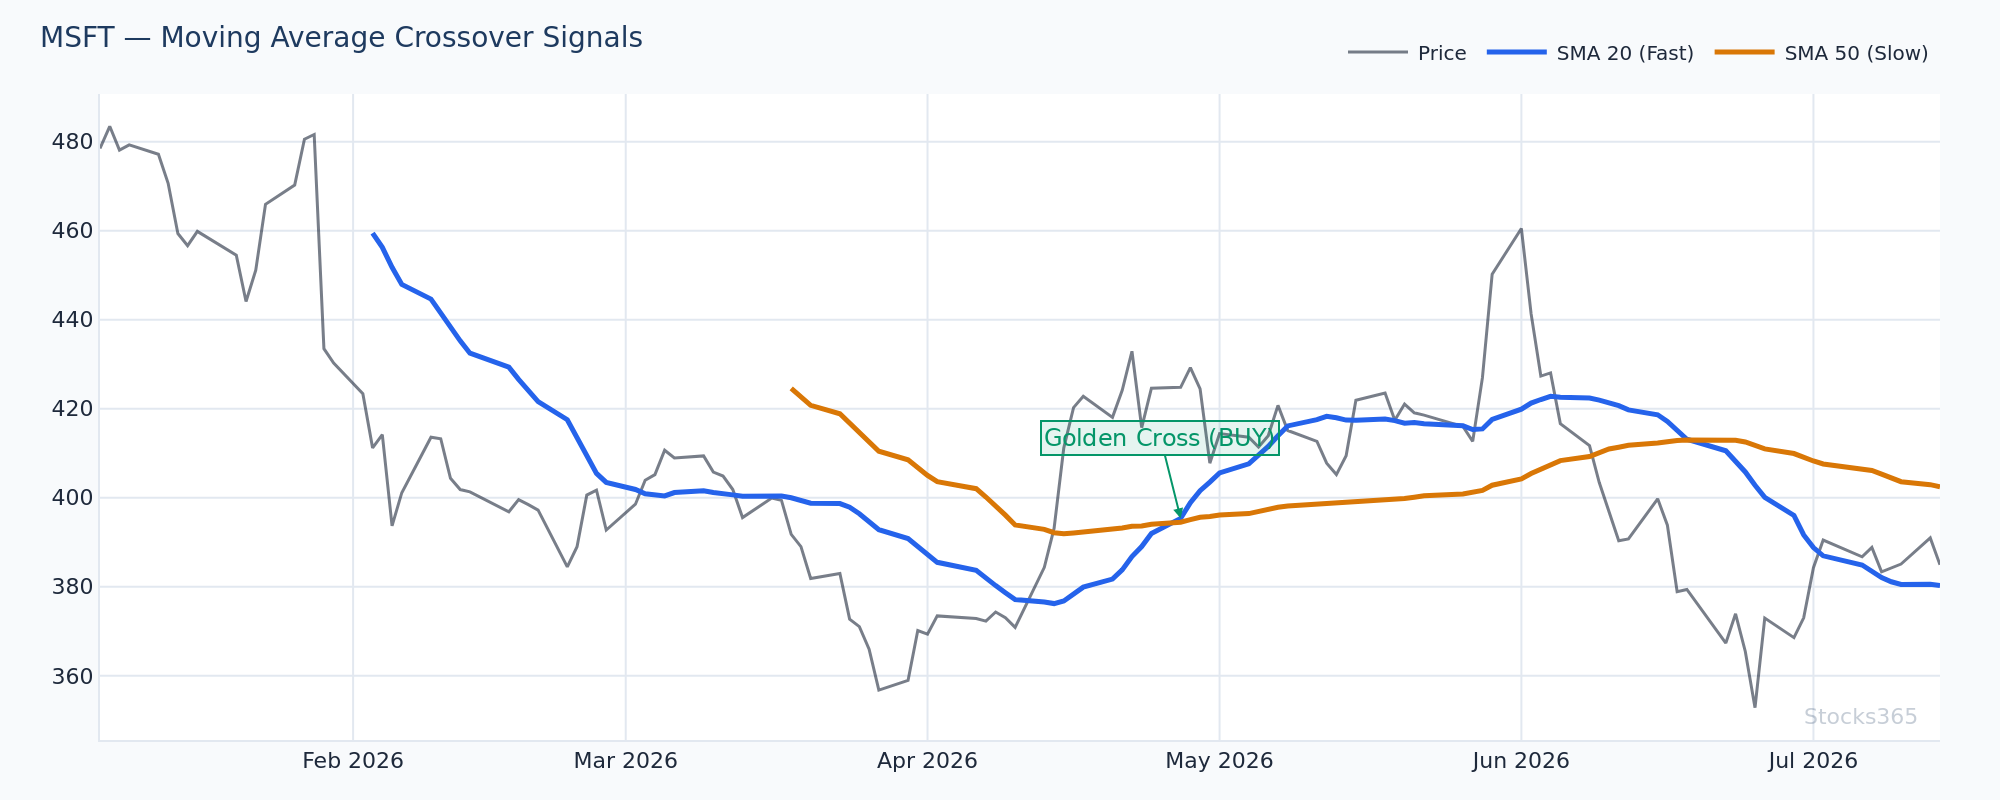
This setup shows a MACD bullish crossover happening while the MACD line is already above zero — a higher-probability configuration. The signal line cross combined with a volume surge on the breakout candle is the confirmation. If price then holds above the 20-period EMA on the next session, the setup is valid. A failed hold below that EMA invalidates the move.
Step 2 — Read the MACD Histogram for Early Momentum Shifts
The histogram is the most underused component of MACD. Most traders watch it passively. The ones who profit from it watch it actively.
Here's the core principle: the histogram shows acceleration, not just direction. When histogram bars are growing in height (either positive or negative), momentum in that direction is increasing. When bars start shrinking — even while remaining on the same side of zero — momentum is fading. That fade often precedes a crossover by several sessions.
Histogram Reversal Signals
A histogram reversal occurs when bars switch from growing to shrinking, signaling a potential momentum shift before the MACD line actually crosses the signal line. This gives traders an earlier entry — but with more risk, since the actual trend hasn't confirmed yet.
Our analysis of 10,807 MACD histogram reversal signals found a 50.9% win rate over a 10-day holding period — with crypto outperforming significantly at 62.3% and commodities lagging at 44.1%. Interestingly, this is nearly the inverse pattern of what we see with standard crossovers. Our research dashboard breaks this down further across asset classes and timeframes.
Two histogram setups worth watching:
- Histogram peak-and-fade: Bars reach a new extreme height, then the next bar is noticeably shorter. This is the first warning that momentum is exhausting. Two consecutive shorter bars becomes a signal worth preparing for.
- Zero-line rejection: Histogram dips toward zero but fails to cross, then resumes in the original direction. This often occurs in strong trends and signals continuation — not reversal.
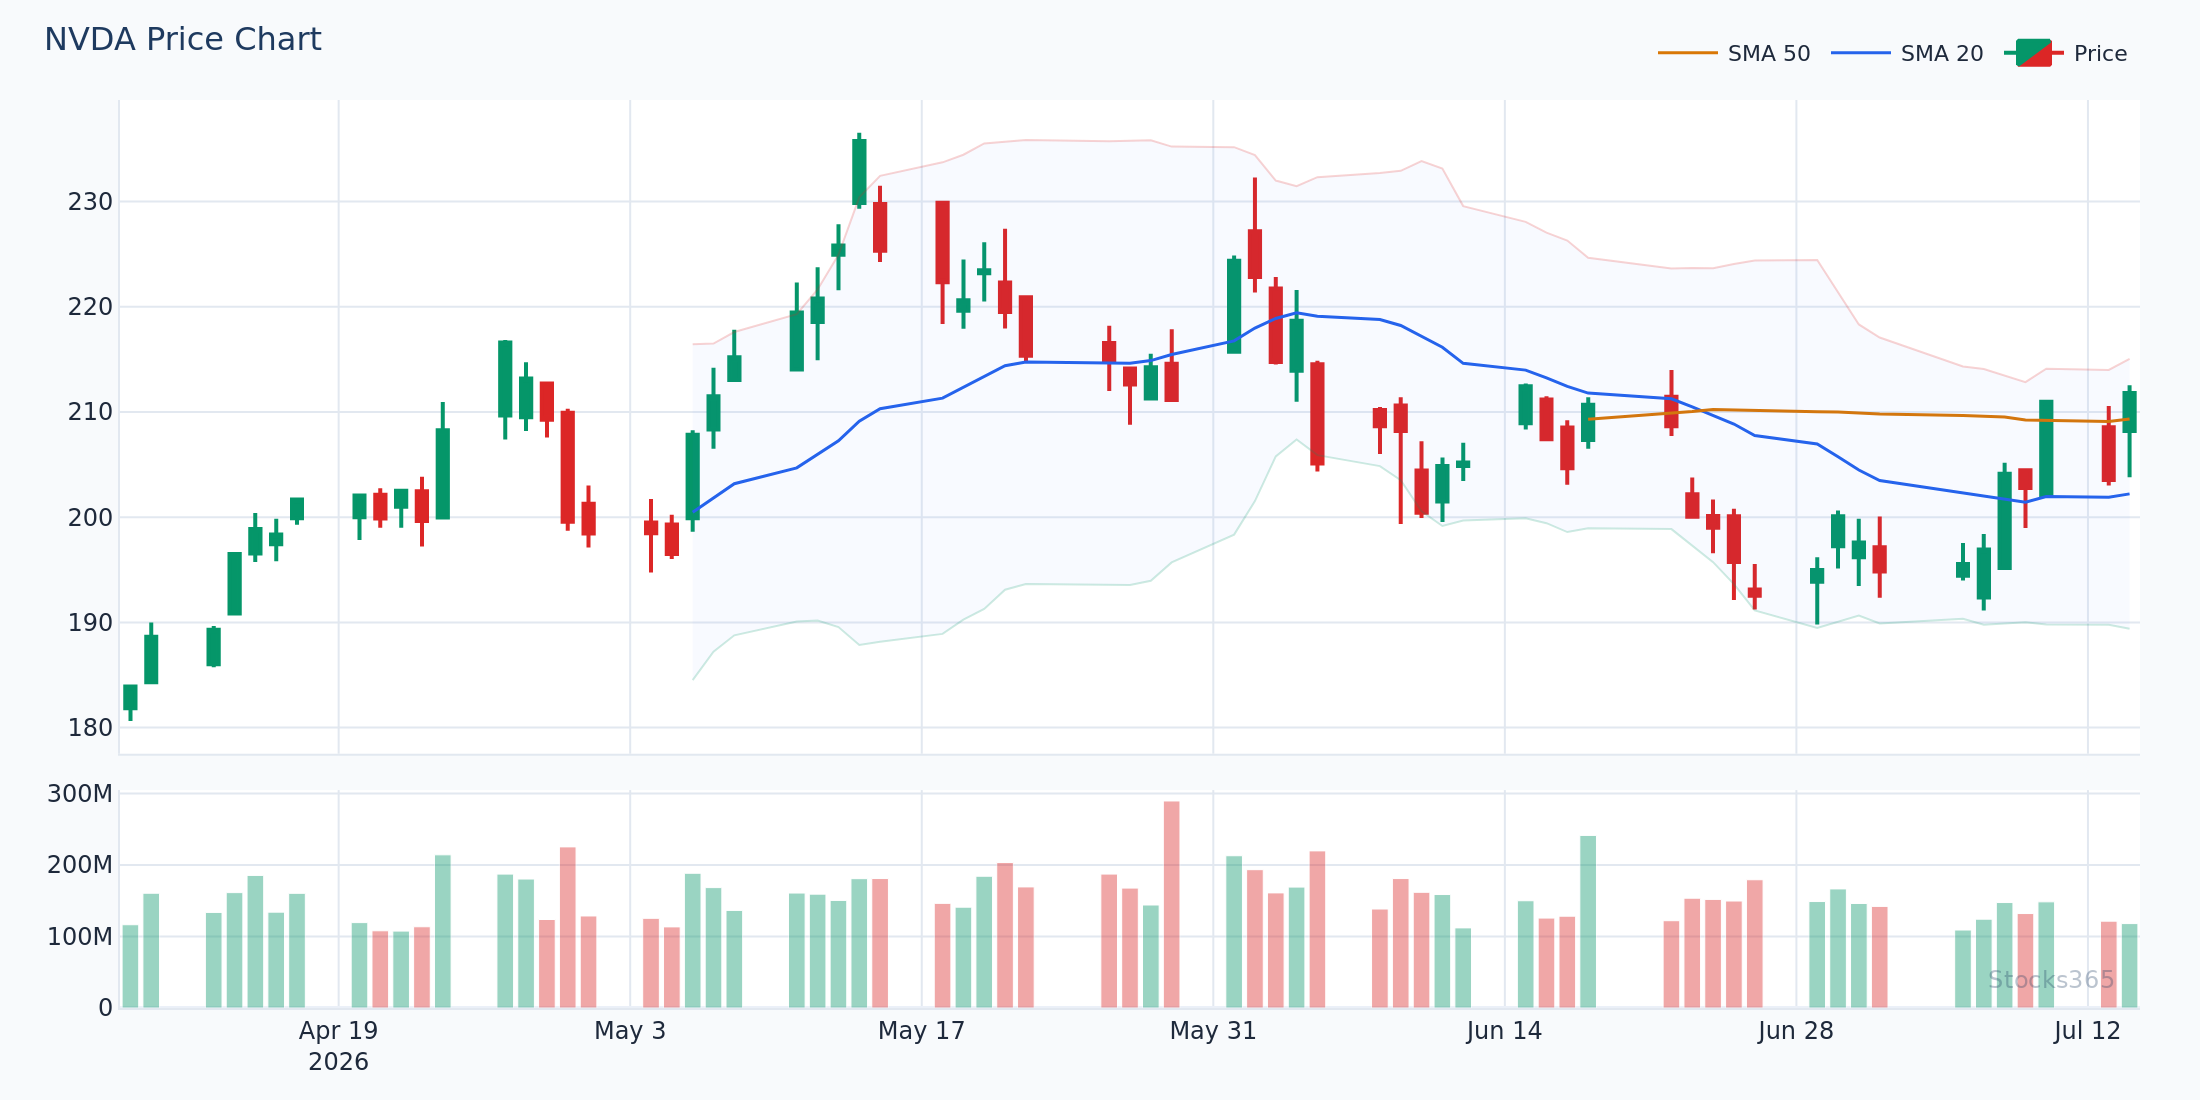
This chart shows histogram bars reaching maximum height, then shrinking over the next three sessions before the MACD line crosses the signal line. The shrinking histogram gave traders early warning. The actual crossover confirmed it. Together, they created a high-quality entry signal on the short side. If histogram bars immediately reverse and start expanding again in the original direction, the reversal signal is invalidated.
Step 3 — Read MACD Divergence
Divergence is where MACD gets genuinely powerful. And genuinely misunderstood.
MACD divergence occurs when price makes a new high (or low) but the MACD indicator does not confirm that move. The gap between what price is doing and what momentum is doing is the signal.
Bullish MACD Divergence
Price makes a lower low. MACD makes a higher low. Selling pressure is weakening even as price falls. This often precedes a meaningful reversal, especially when it appears after a prolonged downtrend and MACD is operating below the zero line.
Bearish MACD Divergence
Price makes a higher high. MACD makes a lower high. Buying pressure is fading even as price rises. Common near market tops — but timing the exit on divergence alone is dangerous. Always wait for the MACD line to break below the signal line as confirmation before acting.
Divergence signals pair well with RSI divergence. When both indicators show divergence simultaneously, the reversal probability increases substantially. Two independent momentum indicators telling the same story carry far more weight than one.
Divergence without a catalyst is just a warning. Divergence with a crossover confirmation is a trade.
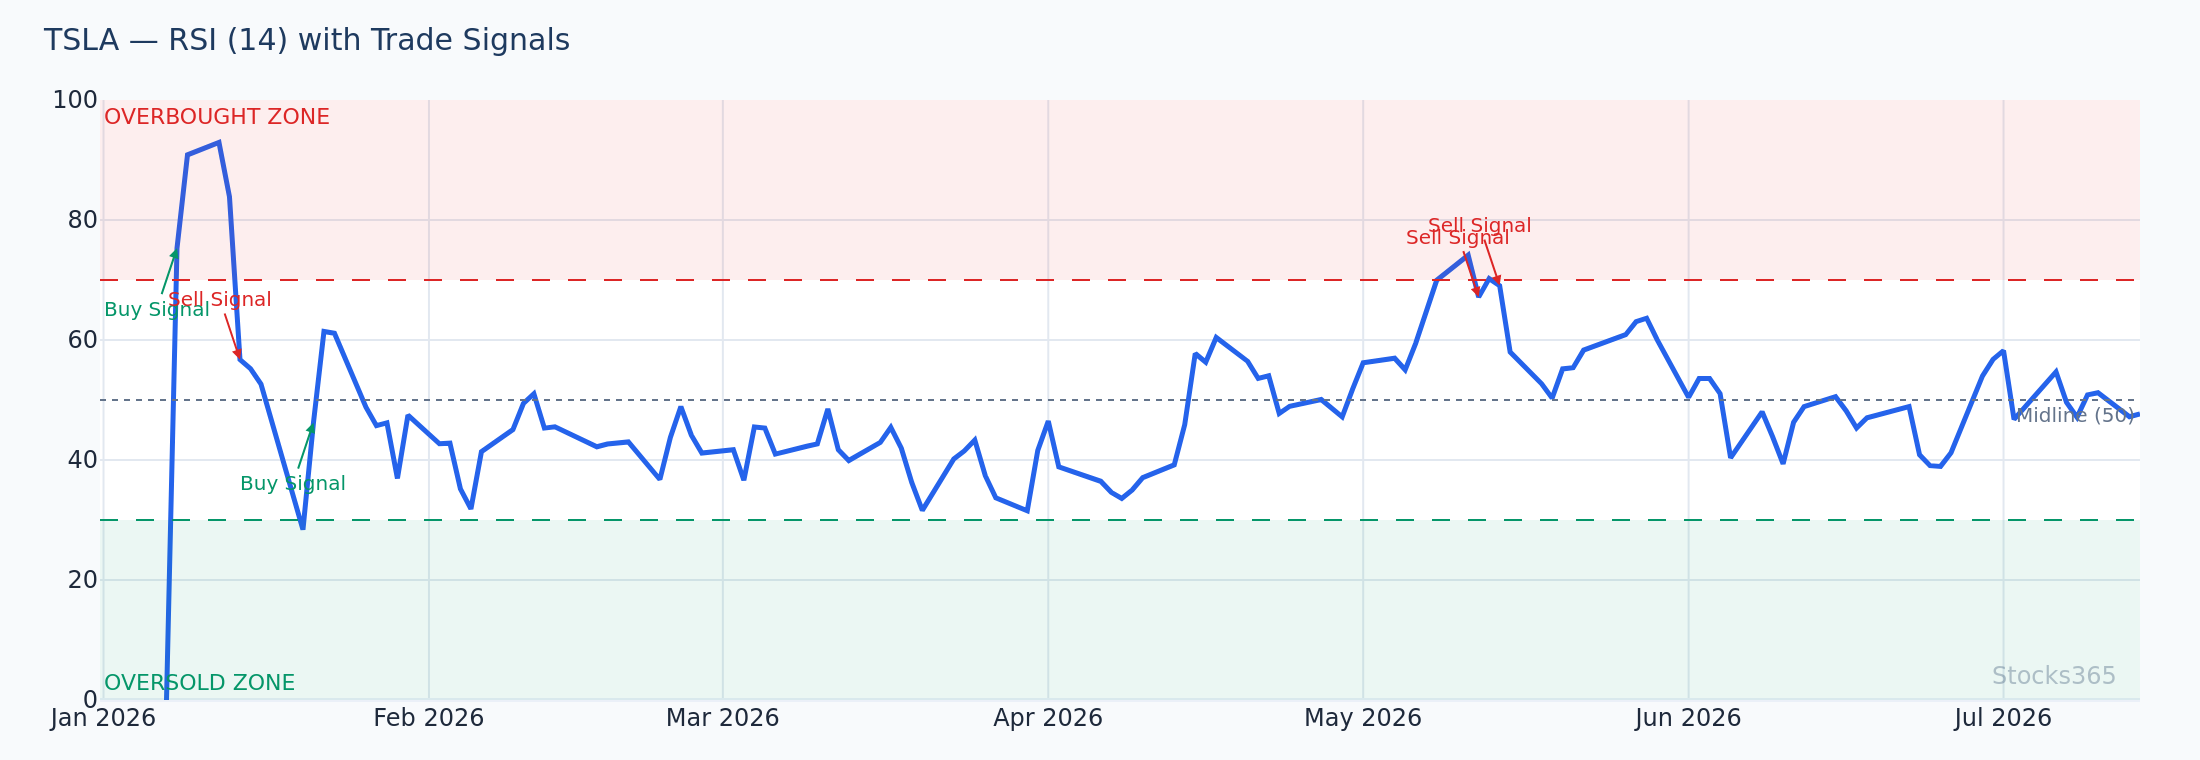
This setup shows price printing a higher high while both MACD and RSI form lower highs — double divergence. The combination is a strong exhaustion signal. Confirmation comes when the MACD line crosses below the signal line. Invalidation occurs if price consolidates and MACD forms a new higher high alongside price, negating the divergence entirely.
Step 4 — Combine MACD With Supporting Indicators
MACD alone works. MACD in context works better. Here's how to build a multi-indicator framework that filters out the noise without overcomplicating your process.
MACD + Moving Average Crossover
One of the most reliable MACD confirmation methods is aligning a crossover signal with a moving average crossover on price. When the MACD gives a bullish cross and price simultaneously crosses above a major moving average (20-EMA, 50-SMA), both momentum and trend are aligned. These setups have historically produced stronger follow-through than crossover signals in isolation.
MACD + Bollinger Bands
MACD crossovers that occur when price is near the lower Bollinger Band after a squeeze have elevated reliability. The squeeze indicates compressed volatility — and the MACD crossover can mark the beginning of the expansion move. Understanding how Bollinger Bands work gives you a structural framework that pairs naturally with MACD's momentum signals.
MACD + RSI for Options Timing
For options traders, MACD and RSI together are particularly powerful. MACD identifies momentum direction while RSI quantifies overbought or oversold conditions. A bullish MACD crossover combined with RSI emerging from below 30 creates a high-conviction entry with defined timing. If you trade options, this combination is explored in detail in RSI in Options Trading.
Step 5 — Apply MACD Across Different Asset Classes
MACD doesn't perform uniformly across all markets. This is one of the most overlooked aspects of using the indicator professionally.
Our backtested data tells the story clearly. MACD bearish cross signals showed a 57.8% win rate in crypto over a 10-day holding period (n=2,347), compared to just 43.4% in commodities. Crypto's higher volatility and trend-persistence characteristics make MACD momentum signals more reliable in that asset class — particularly on bearish setups. Commodities, with their mean-reverting tendencies and sensitivity to fundamental supply-demand data, produce more MACD false signals.
Calibrate your MACD settings accordingly:
- Equities: Default 12/26/9 works well across daily and weekly timeframes. On individual stocks, pair with earnings calendar awareness — MACD signals that fire immediately before earnings carry elevated gap risk.
- Crypto: Higher volatility means MACD generates more signals. Filter aggressively. Only act on crossovers that align with the dominant weekly trend direction.
- Commodities: Treat MACD crossovers as secondary signals here. Lead with fundamental context or seasonality, and use MACD to time entries within that framework rather than as a standalone trigger.
- Forex: MACD performs well on major pairs during trending sessions. Avoid it during low-liquidity periods when pairs chop sideways.
For a current breakdown of which asset classes are producing the strongest signal performance, check our Asset-Class Scorecard.
How to Read MACD on Different Timeframes
Timeframe alignment is the hidden multiplier for MACD signals. A bullish crossover on the daily chart means more when the weekly MACD is also in bullish territory. When shorter and longer timeframes agree, the probability of follow-through increases.
A practical multi-timeframe approach:
- Weekly MACD: Establishes the macro momentum direction. This is your bias filter — only take daily signals that align with weekly direction.
- Daily MACD: Primary signal timeframe for swing traders. Crossovers, divergences, and histogram reversals here drive most tactical decisions.
- 4-hour or 1-hour MACD: Entry timing for day traders. Use to fine-tune entries within a daily signal setup.
Never fight the weekly MACD. It moves slowly and reverses slowly — which means when it turns, it stays turned.
Common MACD Mistakes to Avoid
Beyond the crossover-as-automatic-entry error already covered, here are the other recurring mistakes that cost traders money:
- Ignoring the zero line: Where the crossover occurs relative to zero dramatically changes the signal's meaning. A bearish cross well above zero is different from one right at zero after a trend exhaustion.
- Using MACD in sideways markets: MACD is a trend-following and momentum indicator. In range-bound conditions, it produces whipsaws. Use ATR or Bollinger Band width to assess whether the market is trending before applying MACD.
- Treating divergence as immediate: Divergence can persist for many sessions before resolving. Divergence spotted is a warning — the crossover is the trigger. Don't front-run it.
- Changing settings constantly: Many traders endlessly optimize MACD periods to fit historical data. Stick to 12/26/9 unless you have a statistically validated reason to deviate. Curve-fitted settings fail in live markets.
Some patterns are less intuitive than they appear. If you're finding MACD setups behaving differently than expected in current market conditions, our monthly counterintuitive patterns analysis often surfaces exactly why.
What to Watch For
- Histogram divergence before the crossover fires: When price makes a new swing high but the histogram prints a lower peak, start preparing for a bearish crossover setup — not chasing price, but anticipating the confirmation candle.
- Bullish MACD crossovers in commodity markets with trend alignment: Given the 55.2% win rate our backtests show in commodities, look for crossovers that occur after a defined pullback within an established uptrend — not as reversal signals from a multi-month low.
- Bearish MACD cross in crypto with weekly trend confirmed: Our data shows a 57.8% win rate for bearish crosses in crypto. The highest-quality setups occur when the weekly MACD is also trending bearish and a relief rally has just faded — not when you're trying to top-tick a parabolic move.
- Double divergence (MACD + RSI simultaneously): When both indicators diverge from price on the same swing, watch for the first MACD signal line crossover as the entry trigger. These combined setups have historically marked more significant turning points than single-indicator divergence.
- Zero-line crossovers during low-volatility periods: When the MACD line crosses from negative to positive territory (or vice versa) after a prolonged sideways period, the next directional move tends to be more sustained — particularly if accompanied by a Bollinger squeeze breakout on the price chart.
How Stocks365 Uses This
How Stocks365 Integrates MACD Into Its Trust Score System
MACD is one of 12+ indicators that feed into the Stocks365 Trust Score — our proprietary signal confidence rating attached to every alert on the platform. MACD contributes specifically to the momentum agreement component of the Trust Score.
When MACD signals align with RSI, EMA positioning, and volume patterns, the Trust Score rises — reflecting multi-indicator confirmation rather than a single trigger. A MACD bullish crossover that also has RSI above 50, price above the 20-day EMA, and above-average volume will generate a materially higher Trust Score than a MACD crossover occurring in isolation against those other factors.
The system also weights asset class context: given our backtested data showing MACD bullish crosses underperform in crypto (39.2% win rate) versus commodities (55.2%), the Trust Score adjusts signal confidence accordingly based on what asset class the signal is firing in.
You can see MACD-informed Trust Scores in action on any signal page — for example, the AAPL signal page shows current MACD status alongside the full indicator stack. Explore all live signals on the Stocks365 dashboard.
Key Takeaways
- MACD has three components — the MACD line, signal line, and histogram. Read all three, not just the crossover.
- Crossovers above the zero line are stronger than crossovers below it. Zero-line position tells you whether you're trading with or against the underlying trend.
- The histogram signals momentum shifts before crossovers confirm them. Watch for shrinking bars as your early warning system.
- Divergence is a warning, not a trigger. Wait for a crossover to confirm before entering on divergence signals.
- Asset class matters. Stocks365's backtested data shows MACD bullish crosses work best in commodities (55.2% win rate) and worst in crypto (39.2%) over a 10-day horizon.
- Multi-timeframe alignment multiplies signal quality. A daily bullish crossover backed by a bullish weekly MACD carries significantly more weight.
- Combine with RSI, EMAs, and Bollinger Bands to filter false signals — especially in choppy or sideways markets.