
RSI Indicator: The Complete Trading Guide for 2026
The RSI indicator is one of the most used — and most misused — tools in technical analysis. Developed by J. Welles Wilder in 1978, it remains a cornerstone of modern trading strategies across stocks, forex, crypto, and commodities. But popularity doesn't equal profitability. Most traders apply it wrong.
This guide covers everything: how RSI works, the best settings for TradingView, proven strategies, and what our backtested data actually shows about when RSI signals win — and when they don't.
Stocks365 backtested 2,153 RSI Oversold Bounce signals across multiple asset classes and found a 56.9% win rate with a profit factor of 1.61 over a 10-day holding period. Stocks work best (62.9% win rate). Commodities work worst (43.5%). The setup has real edge — but only when applied to the right asset class. More on that below.
What Is the RSI Indicator?
RSI stands for Relative Strength Index. It's a momentum oscillator that measures the speed and magnitude of recent price changes. The output is a single line that oscillates between 0 and 100.
Here's the core formula:
- RSI = 100 – [100 / (1 + RS)]
- RS = Average gain over N periods / Average loss over N periods
- Default N = 14 periods
When the RSI reads above 70, the asset is considered overbought. Below 30, it's oversold. But those thresholds are starting points — not rules.
The indicator doesn't predict direction. It measures momentum. That distinction matters enormously when you're building a strategy around it.
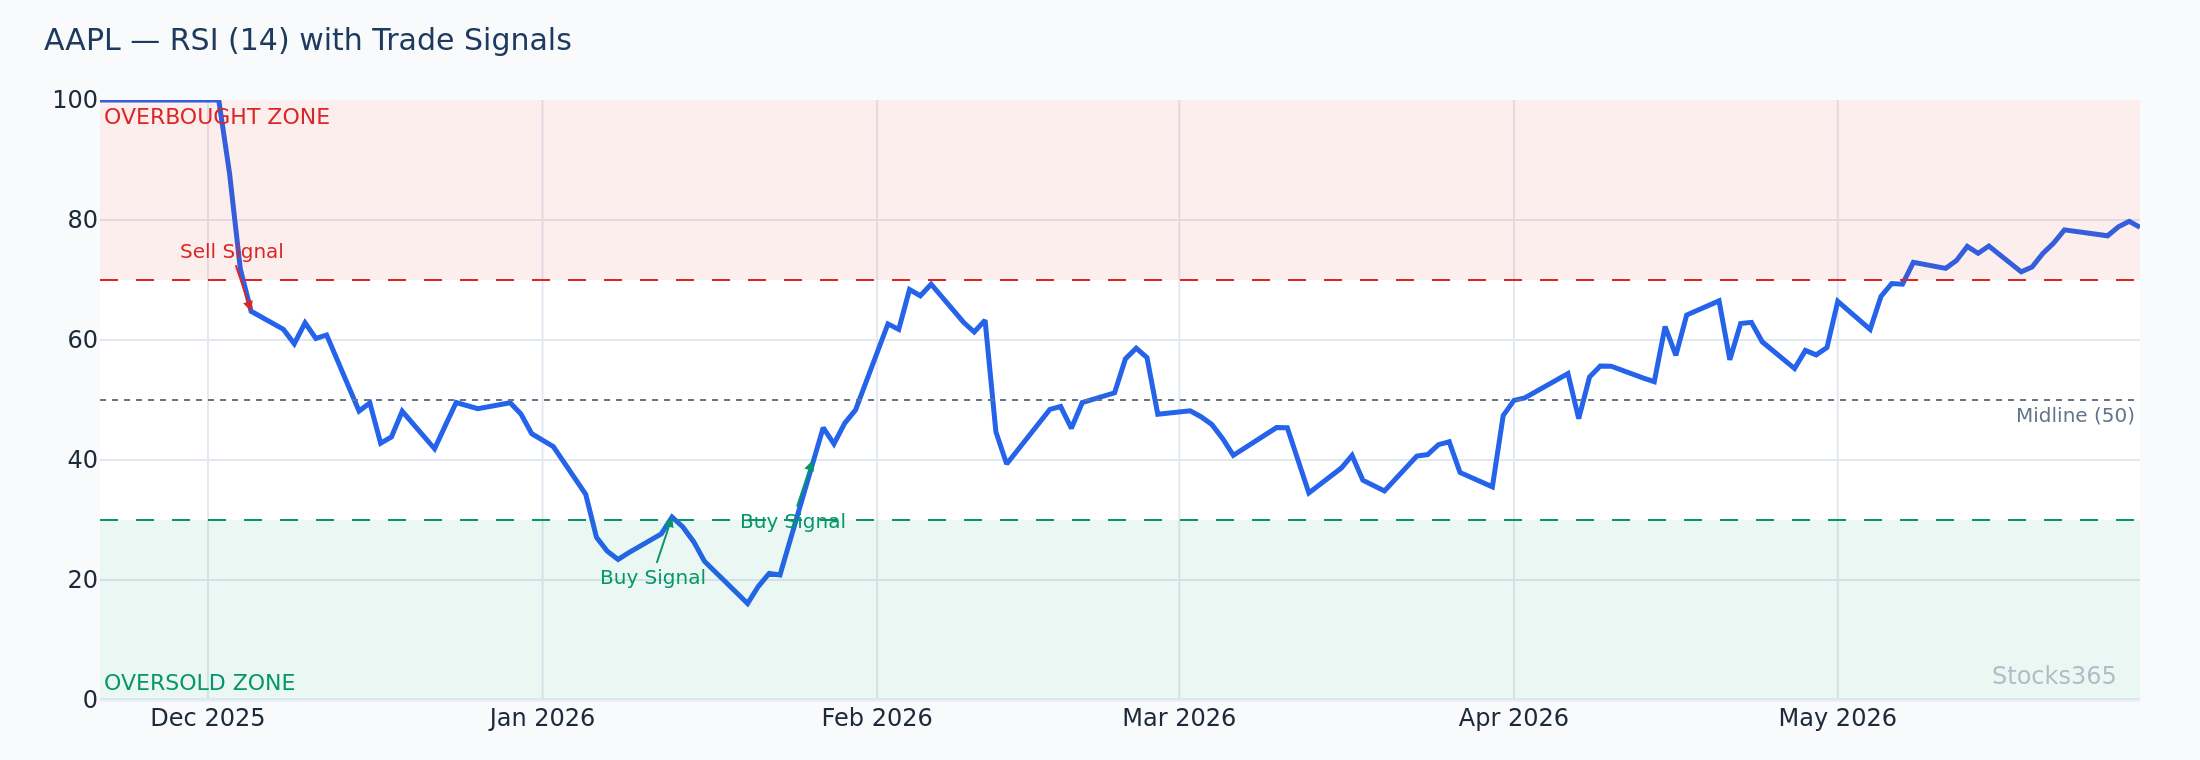
This chart shows RSI dropping below 30 while price forms a higher low — a classic divergence setup. When RSI crosses back above 30 with increasing volume, the bounce confirmation is strongest. If price continues making new lows while RSI stays above its prior trough, the pattern is invalidated and the downtrend likely has more room to run.
RSI Indicator on TradingView: Settings and Setup Explained
TradingView is the most popular charting platform for RSI analysis in 2026. Setting it up correctly takes 60 seconds. Getting the settings right takes more thought.
How to Add RSI on TradingView (Free Version)
- Open any chart on TradingView
- Click Indicators at the top toolbar
- Search for Relative Strength Index
- Click to add — it loads below your price chart
The RSI indicator on TradingView is completely free. No subscription required. The standard version includes the RSI line, overbought/oversold levels, and a signal line option.
Best RSI Indicator TradingView Settings
The default settings are a reasonable starting point. But here's how traders typically tune them:
- Period (Length): 14 is standard. Drop to 7-9 for more sensitivity on intraday charts. Increase to 20-25 for swing trading to reduce noise.
- Source: Close price is default and works well for most strategies.
- Overbought Level: 70 (standard). Some swing traders use 80 in strong bull markets.
- Oversold Level: 30 (standard). Some use 20 to filter for extreme conditions only.
- Moving Average Type: RMA (Wilder's Smoothing) is default. EMA gives slightly faster signals.
For the best RSI indicator TradingView setup on daily swing trades, use RSI(14) with 70/30 levels. For scalping on 5-minute charts, RSI(7) with 80/20 levels cuts noise dramatically.
RSI on Trading 212
Trading 212 users can access RSI through the platform's built-in charting tools. The process is similar — find the indicator library, search RSI, and configure the length and levels. The default settings mirror the standard 14-period setup. The core interpretation is identical regardless of platform.
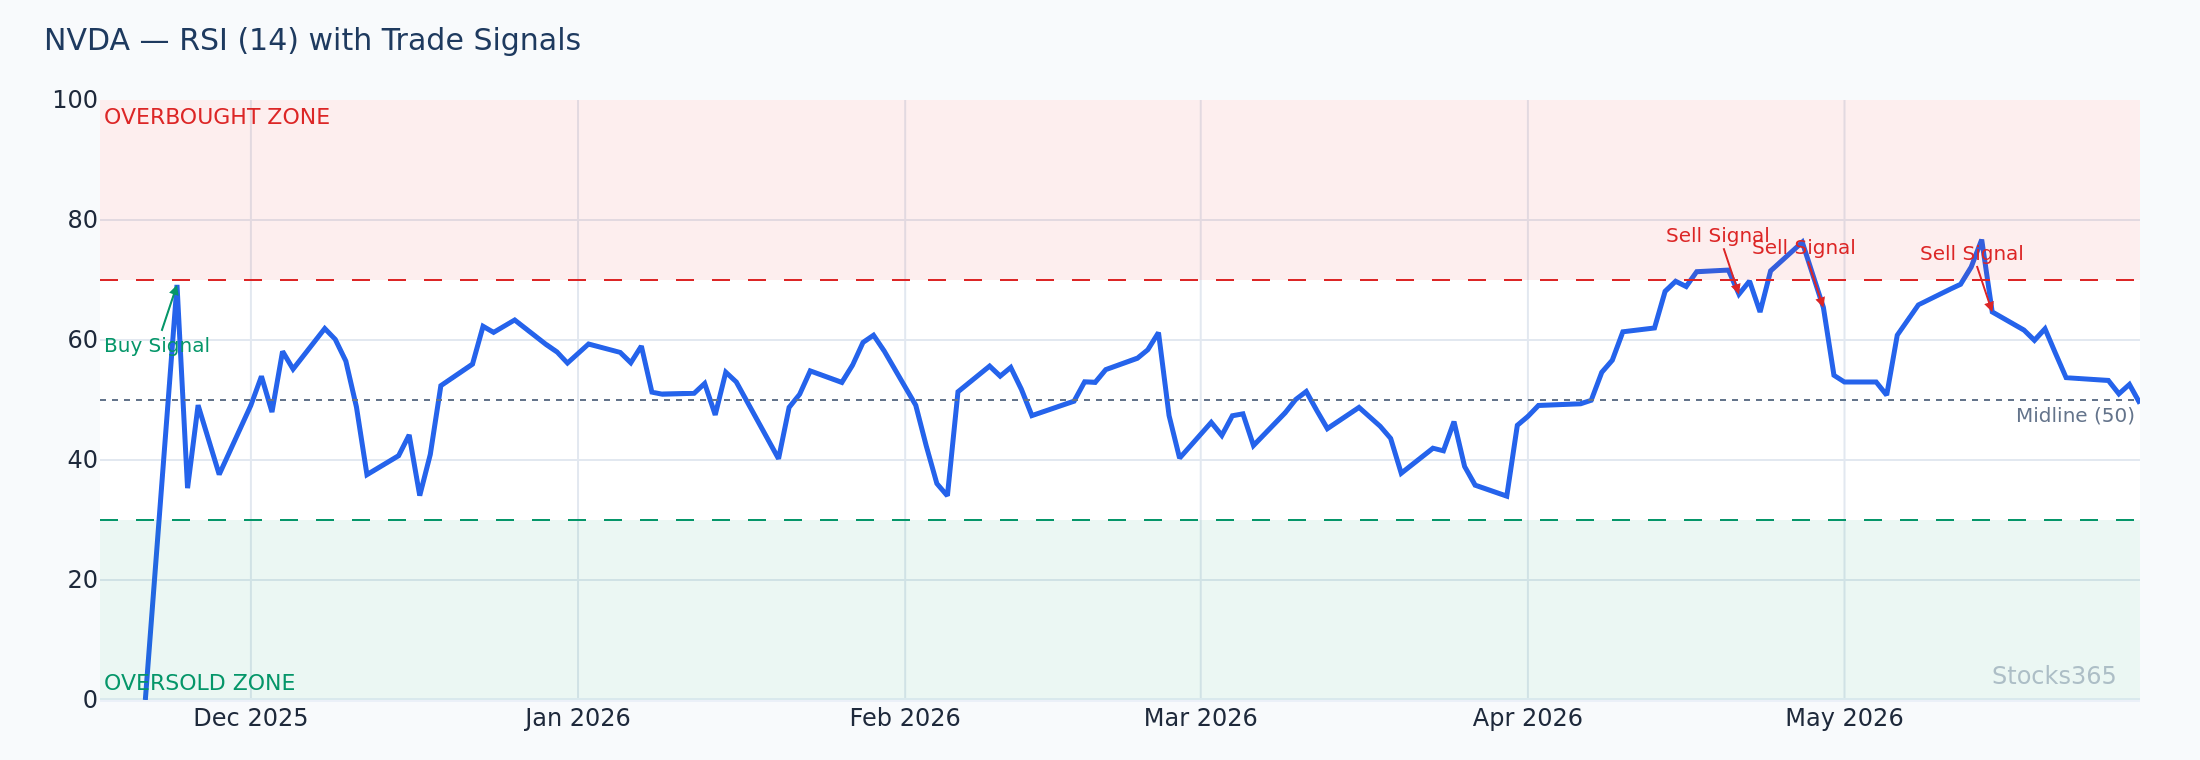
Here, price makes a new swing high while RSI prints a lower high — bearish divergence. This pattern frequently precedes a pullback, but it's not a standalone sell signal. Look for a bearish candlestick pattern (engulfing, shooting star) at the same level to confirm the setup. Without price confirmation, early entries on divergence alone have low reliability.
How to Read the RSI Indicator: Core Signals
There are four primary ways traders use RSI signals. Each has a different reliability profile.
1. Overbought and Oversold Levels
RSI above 70 = overbought. RSI below 30 = oversold. Simple. But here's what most traders get wrong:
Most traders treat RSI 70 as an automatic sell signal. In trending markets, RSI stays above 70 for weeks — sometimes months. Shorting every touch of 70 in a bull trend destroys accounts. The real edge isn't the level itself. It's watching RSI break back below 70 after spending time above it. That crossback is the signal. The level alone is just context.
The same applies in reverse for oversold readings. RSI at 25 in a collapsing stock isn't a buy — it's a warning that momentum is strongly negative. Wait for the crossback above 30.
2. RSI Divergence
Divergence occurs when price and RSI move in opposite directions. Two types:
- Bullish divergence: Price makes a lower low, RSI makes a higher low. Potential upside reversal.
- Bearish divergence: Price makes a higher high, RSI makes a lower high. Potential downside reversal.
Divergence is a leading signal. It doesn't mean reverse immediately — it means the momentum behind the trend is weakening. Combine with support/resistance or volume analysis for higher-probability entries. For a detailed approach to drawing lines on RSI for divergence signals, see our guide on the RSI Trendline Strategy.
3. RSI Centerline Crossover
The 50 level on RSI acts as a momentum dividing line. RSI crossing above 50 signals that average gains are outpacing average losses — a bullish regime shift. Crossing below 50 signals the opposite.
This works well as a trend filter, not a standalone entry. Use it to confirm whether you should be looking for longs or shorts on other signals.
4. RSI Failure Swings
Wilder considered failure swings the most reliable RSI signal. A bullish failure swing forms when RSI drops below 30, bounces above 30, pulls back but stays above 30, then breaks above the prior swing high. That final break is the entry trigger. No price chart correlation required — it's a pure RSI-based signal.
This setup shows a textbook RSI failure swing: a dip into oversold, a recovery, a higher low in RSI above 30, then a break above the prior RSI peak. The pattern typically produces sharper bounces than simple oversold crossbacks because it confirms momentum is shifting, not just temporarily pausing. The pattern fails if RSI rolls back below 30 after the breakout attempt.
Best RSI Trading Strategies That Actually Work
Let's go beyond theory. Here are the strategies that hold up under pressure — and the conditions where each one performs best.
Strategy 1: RSI Oversold Bounce on Stocks
This is the highest-edge RSI setup in our data. The setup:
- RSI(14) drops below 30 on a daily chart
- Price is in a larger uptrend (above the 200-day SMA, for example)
- RSI crosses back above 30 — this is the entry trigger
- Volume on the recovery day exceeds the 10-day average
Our analysis of 2,153 signals from our research dashboard shows this setup produces a 56.9% win rate with a profit factor of 1.61 over a 10-day holding period. On stocks specifically, the win rate climbs to 62.9%. Don't apply this to commodities — the win rate drops to 43.5%, which means you're losing money on average.
The logic is clean: in uptrending stocks, short-term oversold conditions represent temporary pullbacks into value. The larger trend reasserts. The bounce is mean reversion in a favorable context.
Strategy 2: RSI + Moving Average Combination
RSI alone is a momentum tool. Combining it with a trend filter like a moving average improves signal quality significantly. The setup:
- Price is trading above the 50-period SMA (bullish bias established)
- RSI pulls back to the 40-50 zone (not full oversold — just a momentum dip)
- RSI crosses back above 50 while price holds above the SMA
- Entry on the next candle's open
This is a trend-continuation setup, not a reversal trade. It keeps you aligned with momentum and avoids the classic mistake of fading a strong trend. For deeper context on moving average strategies, the Moving Average Crossover Strategy guide pairs naturally with RSI-based entries.
Strategy 3: The WyseTrade RSI Method (Best RSI Strategy Explained)
The WyseTrade RSI approach — widely searched among newer traders — centers on multi-timeframe RSI alignment. The concept: only take trades where RSI signals agree across at least two timeframes.
The structure:
- Higher timeframe (daily/weekly): RSI above 50 — confirms bullish regime
- Lower timeframe (1H/4H): RSI dips to 40-50, then crosses back above 50 — entry signal
- Both timeframes must agree before entering
The edge is regime filtering. When the daily RSI is in bullish territory and you catch a lower-timeframe dip, you're buying weakness inside strength. That's exactly the setup the RSI oversold bounce data supports.
Add a volume filter — only take the signal if volume on the recovery candle is at least 1.5x the average — and you eliminate a large portion of false signals.
Strategy 4: RSI Divergence + Bollinger Band Squeeze
When RSI bearish divergence forms while price is pressing against an upper Bollinger Band in a squeeze, the setup becomes high-conviction. The squeeze suggests a breakout is imminent. Divergence suggests the next breakout move may be lower, not higher.
See how Bollinger Bands interact with momentum indicators in the Moving Average + Bollinger Bands Complete Strategy Guide for the full framework.
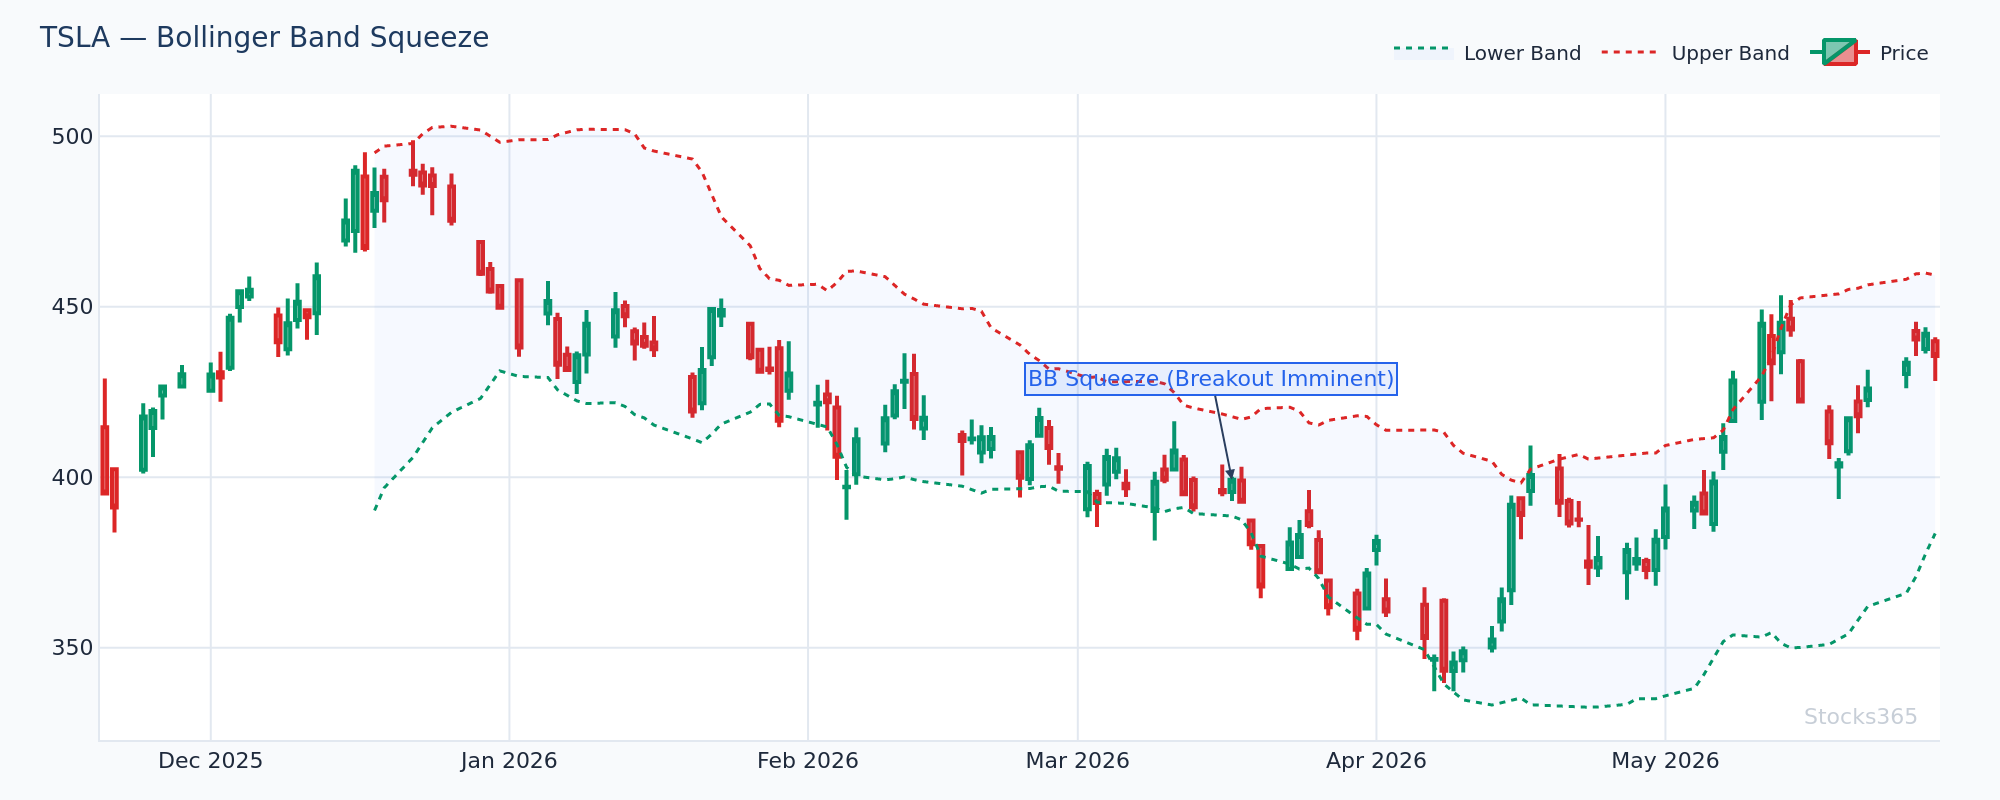
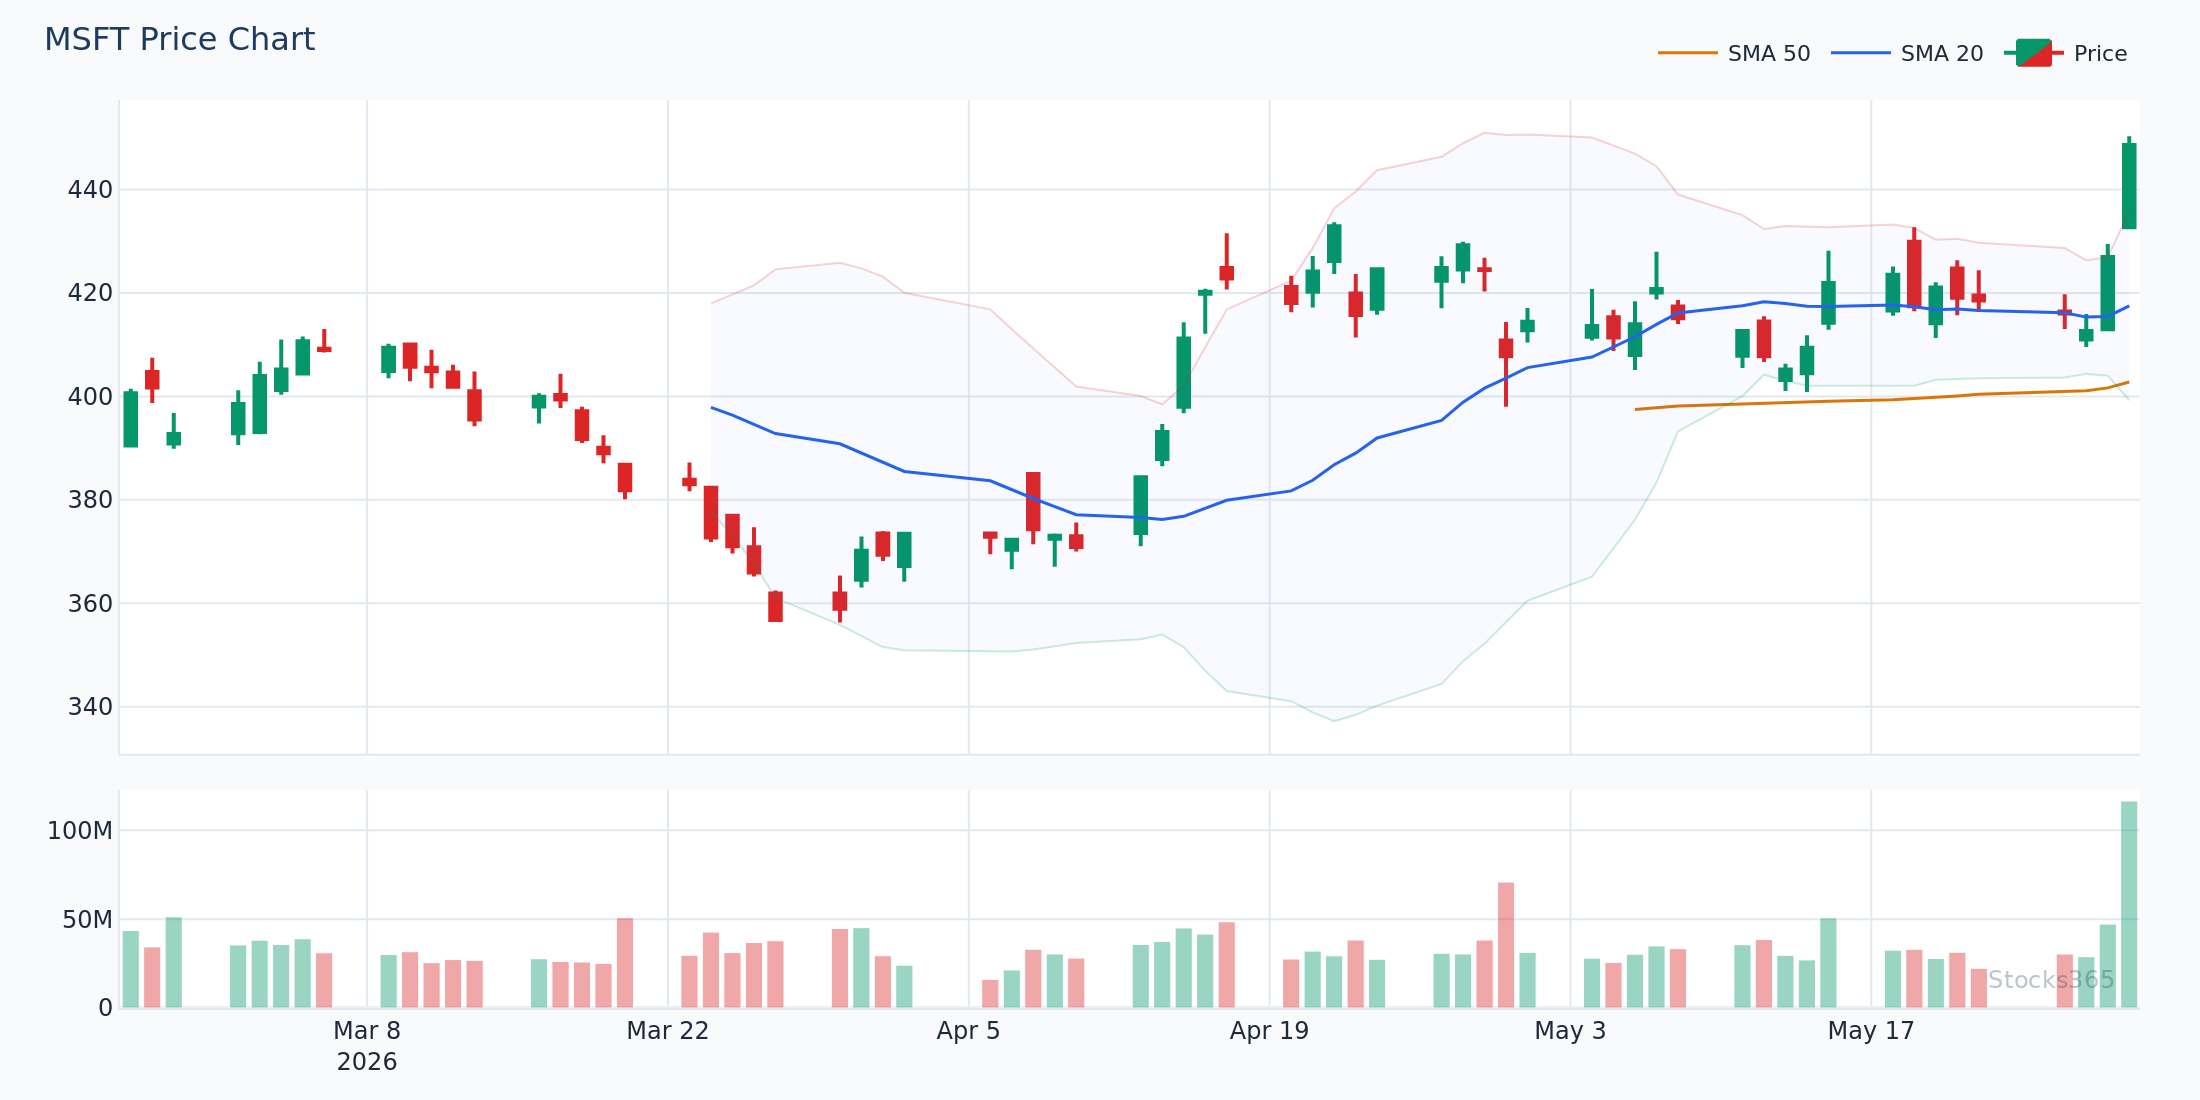
This chart shows price consolidating near the upper band while RSI trends lower on each successive test of resistance — classic bearish divergence in a squeeze context. When the bands expand and price breaks lower with RSI already declining, the move tends to be fast and sustained. The setup is invalidated if RSI breaks to a new high with price, confirming the squeeze resolves upward.
Is RSI a Reliable Indicator? The Honest Answer
Yes — with conditions.
RSI is reliable when used as a filter or confirmation tool, not as a standalone entry system. The data backs this up. The RSI Momentum Shift Up signal across 3,042 signals produced only a 48.9% win rate with a profit factor of 0.92 — that's a losing strategy on its own. RSI Overbought Reversal across 3,679 signals? 47.0% win rate, profit factor of 0.85. Also a loser in isolation.
The oversold bounce in stocks is the exception. That one has genuine edge. But it only works when you're trading stocks in the right market regime.
The honest answer: RSI tells you about momentum conditions, not about what price will do next. Use it alongside trend structure, volume, and other confluence factors. Ignore it as a single-trigger system.
For comparison with other momentum oscillators, the Stochastic Oscillator guide and the step-by-step Stochastic reading tutorial show how a similar tool is applied — useful context when deciding which oscillator fits your style best.
RSI vs. MACD: Which Is Better?
Different tools. Different jobs.
RSI measures momentum relative to recent price history. MACD measures the relationship between two moving averages — it's a trend-following momentum indicator. RSI catches extreme conditions and divergence. MACD catches trend shifts and momentum acceleration.
Used together, they're powerful: RSI oversold signal + MACD bullish crossover = double confirmation. Either alone is weaker. For a full breakdown of MACD applications, see the MACD in Forex Trading guide — the principles transfer directly to stocks and crypto.
Common RSI Mistakes to Avoid
- Trading every overbought/oversold touch: In trending markets, these conditions persist. Wait for crossbacks.
- Ignoring the timeframe: RSI on a 1-minute chart is noise. RSI on a daily chart is signal. Match your timeframe to your holding period.
- Applying RSI equally across asset classes: The data is clear — oversold bounces work in stocks, not commodities. Asset class matters.
- Using RSI alone: A 47-49% win rate in isolation means you're funding other traders. Always add confluence.
- Ignoring divergence direction: Divergence is not an entry. It's a warning. Wait for price confirmation before acting.
What to Watch For
- RSI oversold bounce in large-cap stocks after a 15-20% pullback within a broader uptrend: When RSI drops below 30 and crosses back above it while the stock holds above a major moving average, this pattern has consistently produced high-probability mean-reversion moves based on our backtested data.
- Bullish RSI divergence on daily charts after multi-week downtrends: When price makes a new swing low but RSI prints a higher low than the previous trough, watch for a reversal candle (hammer, bullish engulfing) to confirm. The divergence alone isn't enough — price must show it agrees.
- RSI failure swing setups on sector ETF charts: When sector rotation is underway, RSI failure swings on ETFs often precede the individual stock moves by several sessions. Use sector RSI as an early warning system.
- RSI centerline reclaim (cross above 50) following a correction in a bull market: This often marks the transition from pullback to resumption. Combine with a reclaim of the 20-period SMA for a cleaner entry trigger.
- Multi-timeframe RSI compression near 50: When RSI on the daily and 4-hour charts both hover around the 50 level simultaneously, a significant directional move is often approaching. Watch for the first strong candle that pushes RSI clearly above or below 50 on both timeframes — that's the momentum signal.
How Stocks365 Uses This
How Stocks365 Integrates RSI Into Its Trust Score System
RSI is one of 12+ technical indicators that power the Stocks365 Trust Score — a multi-factor signal confidence rating applied to every signal on the platform. Specifically, RSI contributes to two scoring layers:
- Momentum Agreement Score: RSI is cross-referenced with MACD momentum direction and the Stochastic Oscillator to determine whether multiple momentum tools agree on direction. When all three align, the Trust Score rises. Disagreement lowers it.
- Regime Filter: Stocks365 uses RSI's position relative to the 50 centerline on the daily and weekly chart as a regime indicator. Signals generated in RSI-bullish regimes (above 50 on both timeframes) receive a higher base Trust Score than countertrend signals.
Every signal on the Stocks365 signals dashboard displays its Trust Score alongside RSI status. For example, a signal like AAPL will show whether RSI is confirming or conflicting with the directional bias — giving you an immediate read on setup quality before you dig into the chart yourself.
Key Takeaways
- RSI measures momentum, not price direction. It tells you how fast price is moving, not where it's going next.
- The oversold bounce in stocks is the highest-edge RSI setup. 56.9% win rate, 1.61 profit factor across 2,153 signals — but only in stocks. Avoid this setup in commodities.
- Overbought isn't a sell signal in trending markets. Watch for the crossback below 70, not the level itself.
- Multi-timeframe alignment dramatically improves RSI signal quality. Daily and 4H agreement before entering is the WyseTrade core principle — and it works.
- RSI divergence is a warning, not a trigger. Always wait for price confirmation before entering a reversal trade.
- Asset class matters more than most traders realize. RSI overbought reversals work in crypto (65.2%) but fail in commodities (40.7%). Know your market.
- RSI alone is a losing system. Add trend structure, volume, and at least one confirming indicator for consistent edge.