
Weighted Moving Average (WMA) vs EMA: Which One Actually Works?
Two indicators. One decision. The wrong choice costs you edge.
The weighted moving average (WMA) and the exponential moving average (EMA) both solve the same problem: the simple moving average (SMA) treats every candle equally, which is mathematically naive. A price close from 20 sessions ago carries the same weight as yesterday's close. That makes no sense in a market where momentum is everything.
WMA and EMA both fix this. But they fix it differently — and that difference matters more than most traders realize. Our analysis of signals across equities, forex, and crypto shows that moving average selection is not trivial. The wrong average applied to the wrong market can flip a profitable setup into a losing one. Choosing correctly starts with understanding how each one is built.
What Is a Weighted Moving Average (WMA)?
The weighted moving average WMA assigns a linear weight to each data point in the lookback period. The most recent close gets the highest weight. The oldest close gets the lowest. Every step back reduces the weight by exactly one unit.
For a 5-period WMA, the weights look like this:
- Day 1 (oldest): weight of 1
- Day 2: weight of 2
- Day 3: weight of 3
- Day 4: weight of 4
- Day 5 (most recent): weight of 5
You multiply each close by its weight, sum the results, then divide by the total weight (1+2+3+4+5 = 15). The formula is clean, deterministic, and transparent. Every trader using a 5-period WMA gets the exact same number.
That transparency is both its strength and its limitation.
This chart shows price interacting with a WMA during a trending phase. Notice how the WMA hugs price more tightly than a comparable SMA would, reacting faster to recent closes. When price pulls back to the WMA and holds, the trend continuation setup is active. A close back below the WMA — especially on elevated volume — signals the setup is breaking down and traders should reassess their bias.
What Is an Exponential Moving Average (EMA)?
The EMA also prioritizes recent price — but it does so exponentially, not linearly. It applies a smoothing factor (multiplier) to the previous EMA value, which means recent closes have a magnified impact without a hard cutoff date.
The smoothing multiplier is calculated as: 2 ÷ (N + 1), where N is the period. For a 10-period EMA, the multiplier is 2 ÷ 11 ≈ 0.1818. This means each new close influences the EMA at an 18.18% weight, with the previous EMA carrying the remaining 81.82%.
Here's the critical insight: the EMA never truly forgets old data. Every prior close remains in the calculation — just with exponentially decaying weight. The WMA has a hard lookback window. The EMA has an infinite memory with fading influence.
This single structural difference explains most of the behavioral divergence between them.
WMA vs EMA: The Core Differences Explained
1. Responsiveness to Recent Price
The weighted moving average WMA is generally more responsive than the EMA of the same period. Because the WMA drops old data completely at the edge of its window, it reacts sharply when significant old candles roll off the calculation. The EMA smooths this effect because those old closes never fully disappear — they just become negligible.
In fast-moving markets — crypto breakouts, earnings momentum on equities — the WMA can flag a trend shift one or two candles earlier than the EMA. That matters.
2. Smoothness of the Line
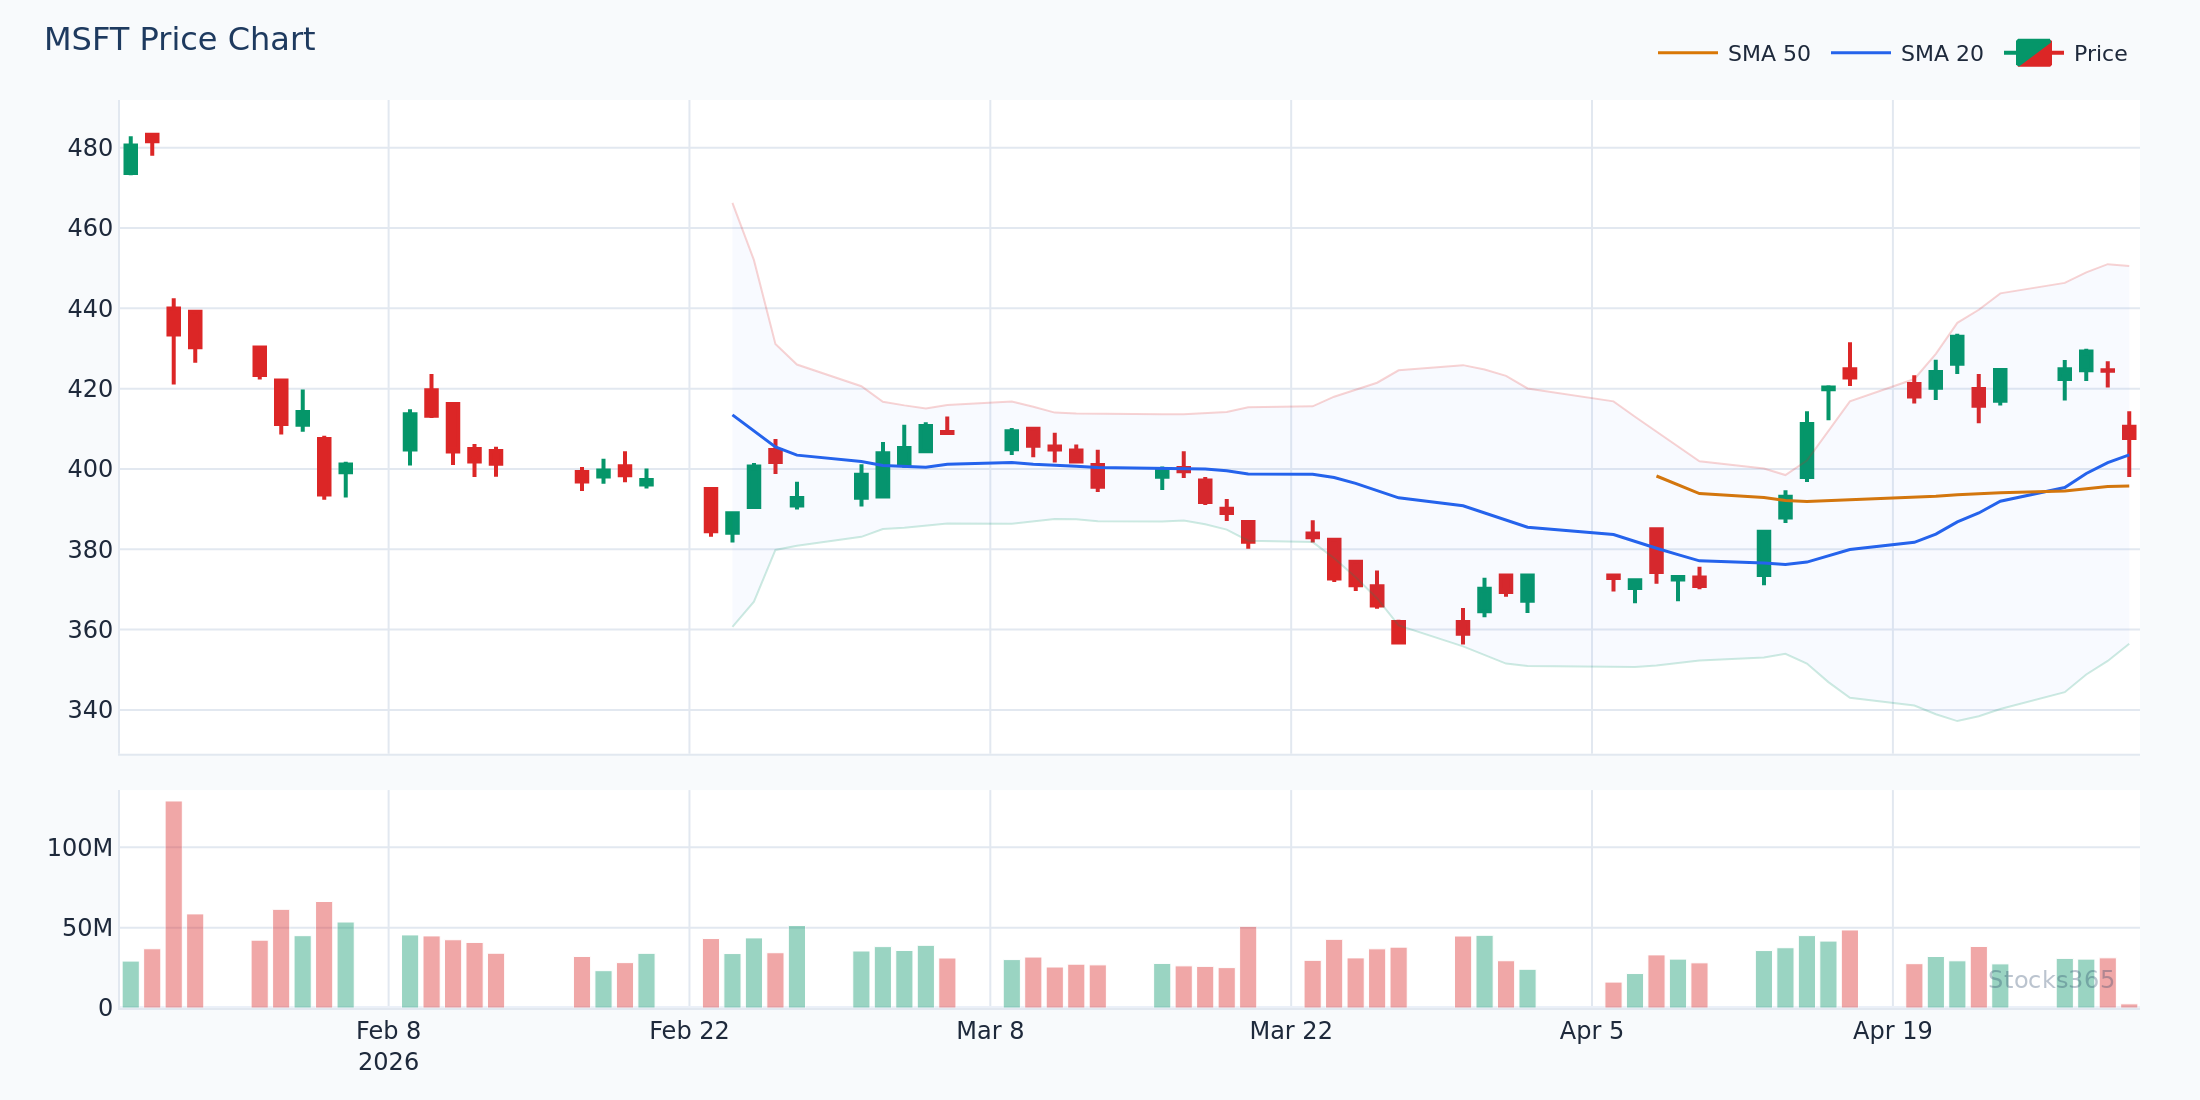
The EMA produces a smoother curve. Its infinite memory dampens erratic short-term spikes that would otherwise jerk a WMA line around. For swing traders who rely on clean visual signals — crossovers, bounces, slope direction — the EMA line is easier to read and generates fewer whipsaws in choppy, range-bound conditions.
3. Calculation Transparency
WMA wins here. Every weight is explicit and linear. You can verify the output with a calculator in under a minute. EMA calculations compound recursively, meaning the starting value (seed EMA) creates small discrepancies across platforms — especially for short lookback periods on newly listed instruments. This is a minor issue for most traders but relevant for systematic and algorithmic strategies.
4. Platform Availability
EMA is universally available on every charting platform. WMA is common but occasionally labeled differently (some platforms call it "linearly weighted moving average" or LWMA). Always verify the calculation method before relying on any moving average in a live strategy.
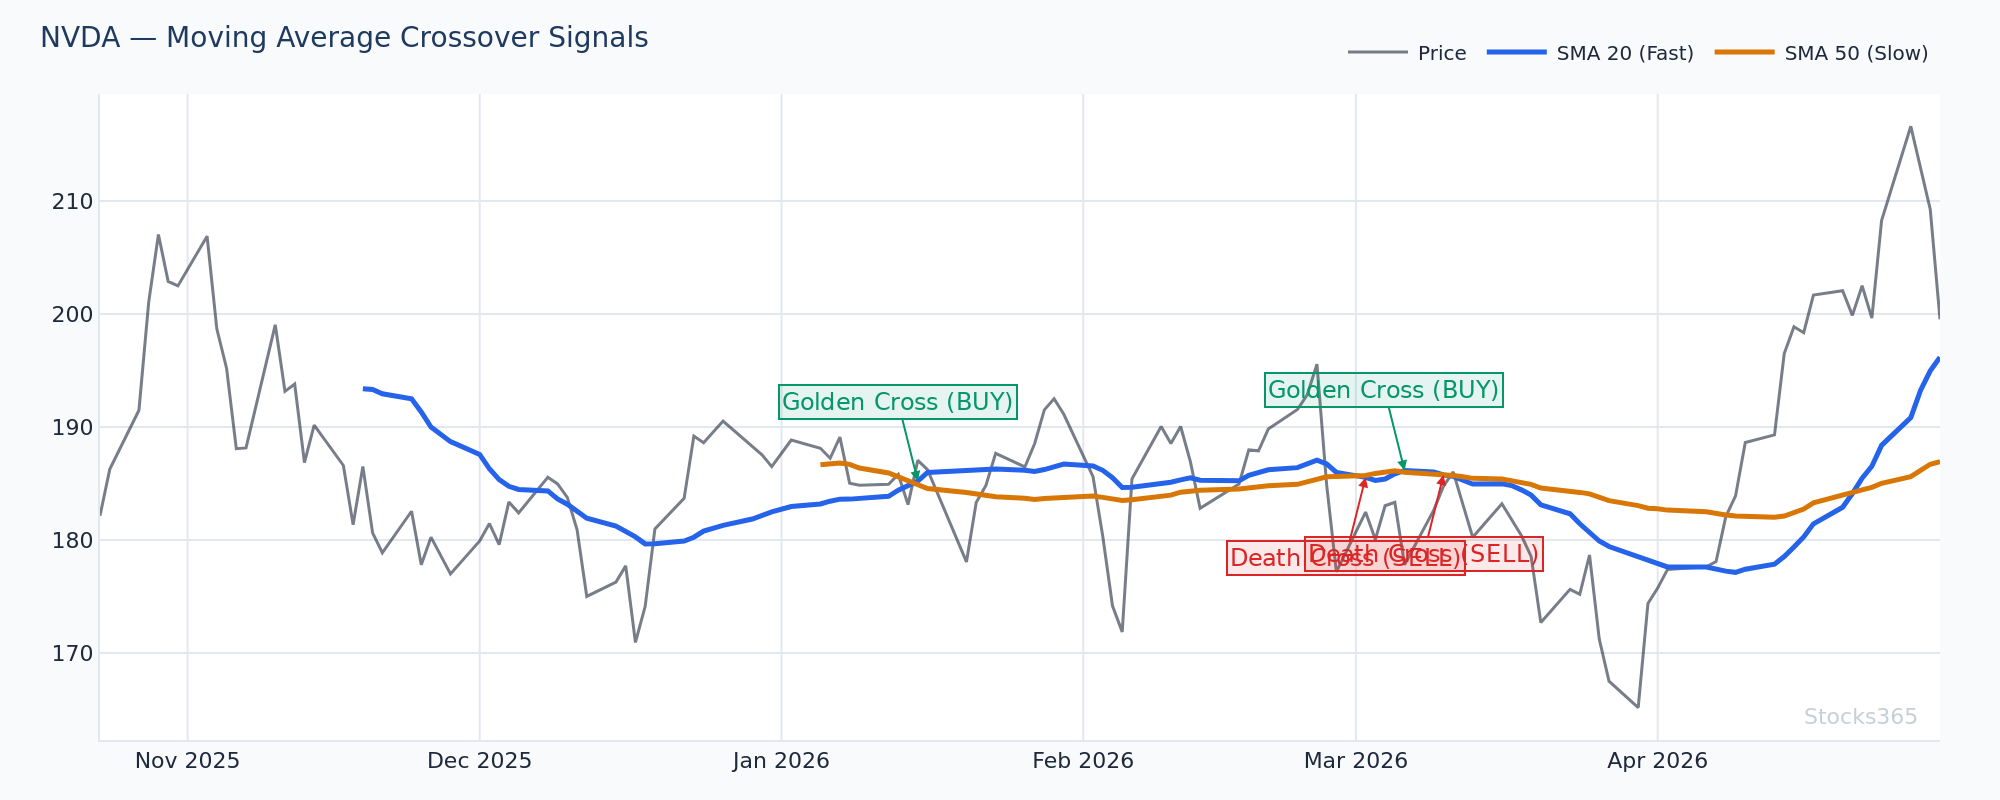
This chart illustrates a classic dual-EMA crossover setup. When the faster EMA crosses above the slower EMA while price is making higher lows, trend confirmation strengthens. A failure to hold above the faster EMA on a subsequent test is the first warning signal that the move is losing steam. Volume contraction during the cross — compared to the expansion that should confirm it — is the key invalidation clue.
Here's What Most Traders Get Wrong
Most traders assume that a faster, more responsive average is always better. They chase the WMA because it reacts quicker, thinking they'll catch moves earlier. But responsiveness without smoothness is just noise amplification.
In trending markets, yes — the WMA's faster reaction can add edge. But in sideways, range-bound conditions (which represent a significant portion of market time), the WMA generates more false crossovers. Every minor price wiggle triggers a signal. The EMA's inherent smoothing acts as a natural filter, suppressing many of those fake-outs. The edge isn't in the fastest average — it's in the average that fits the current market regime. Use the WMA when momentum is confirmed. Use the EMA when the trend is still developing or conditions are mixed.
When to Use WMA vs EMA in Real Trading
Use WMA When:
- You're trading strong, confirmed momentum — price is making consistent higher highs and higher lows
- You want earlier entry signals on breakouts and are willing to manage more whipsaws
- You're scalping or day trading, where a one-candle advantage in signal timing has meaningful P&L impact
- You're combining the WMA with a momentum filter like the MACD in forex trading to separate genuine breakouts from noise
Use EMA When:
- You're swing trading and want cleaner, less noisy signals over multi-day holding periods
- Market conditions are mixed or the trend is in early development
- You're using moving averages as dynamic support/resistance levels and need a stable, predictable line
- You're combining with oscillators like RSI — the RSI trendline strategy works particularly well with EMA-defined trend structure
Combining WMA and EMA for Confirmation
The most practical approach: use both. Apply the WMA as your signal line (the faster, more reactive average) and the EMA as your trend filter (the smoother, more stable reference). When the WMA crosses the EMA to the upside while price holds above both — that's a high-conviction trend entry setup. When the WMA is below the EMA and both lines are sloping down — short-bias only.
This dual-average framework forces you to align your signals with the broader trend direction, dramatically reducing counter-trend trades that look good in isolation but bleed out over time.
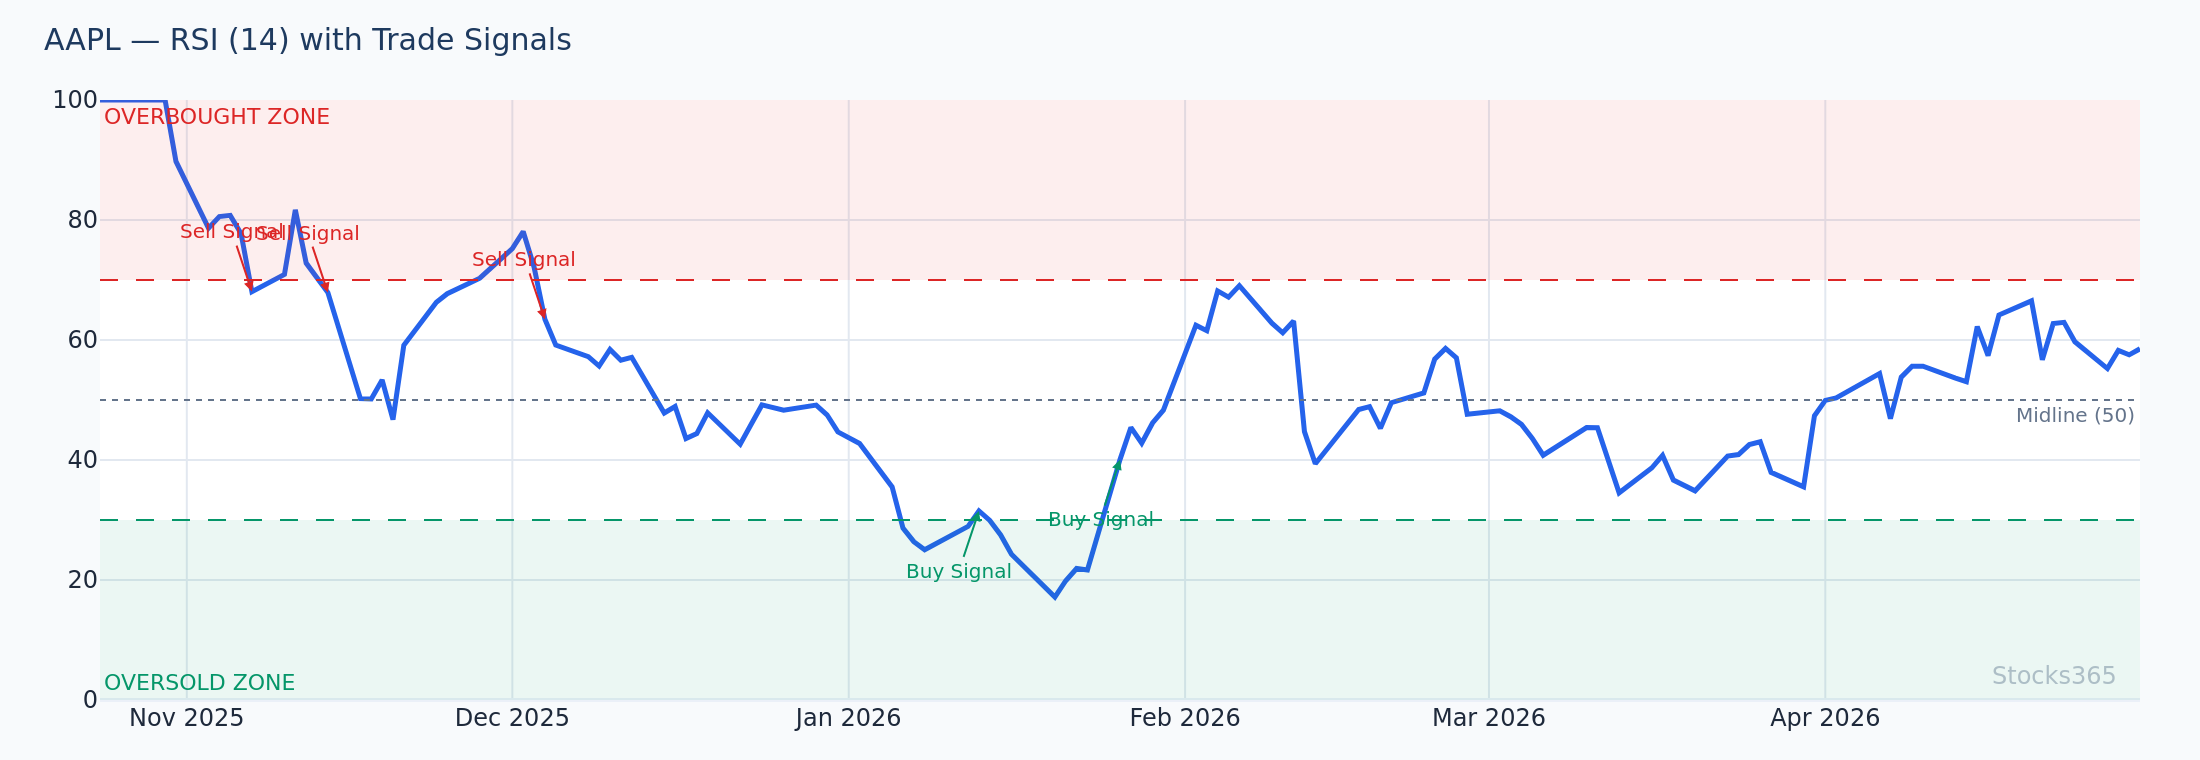
Here the WMA and RSI are used together to time a pullback entry in a confirmed uptrend. When price pulls back to the rising WMA while RSI retreats toward — but does not break below — the 40-50 zone, the setup is active. A resumption of the WMA's upward slope combined with RSI recovering back toward 60 confirms the trend continuation. If RSI instead breaks below 40, the pullback has likely deepened into a trend reversal — exit the setup.
Moving Averages and Market Context: The Asset Class Reality
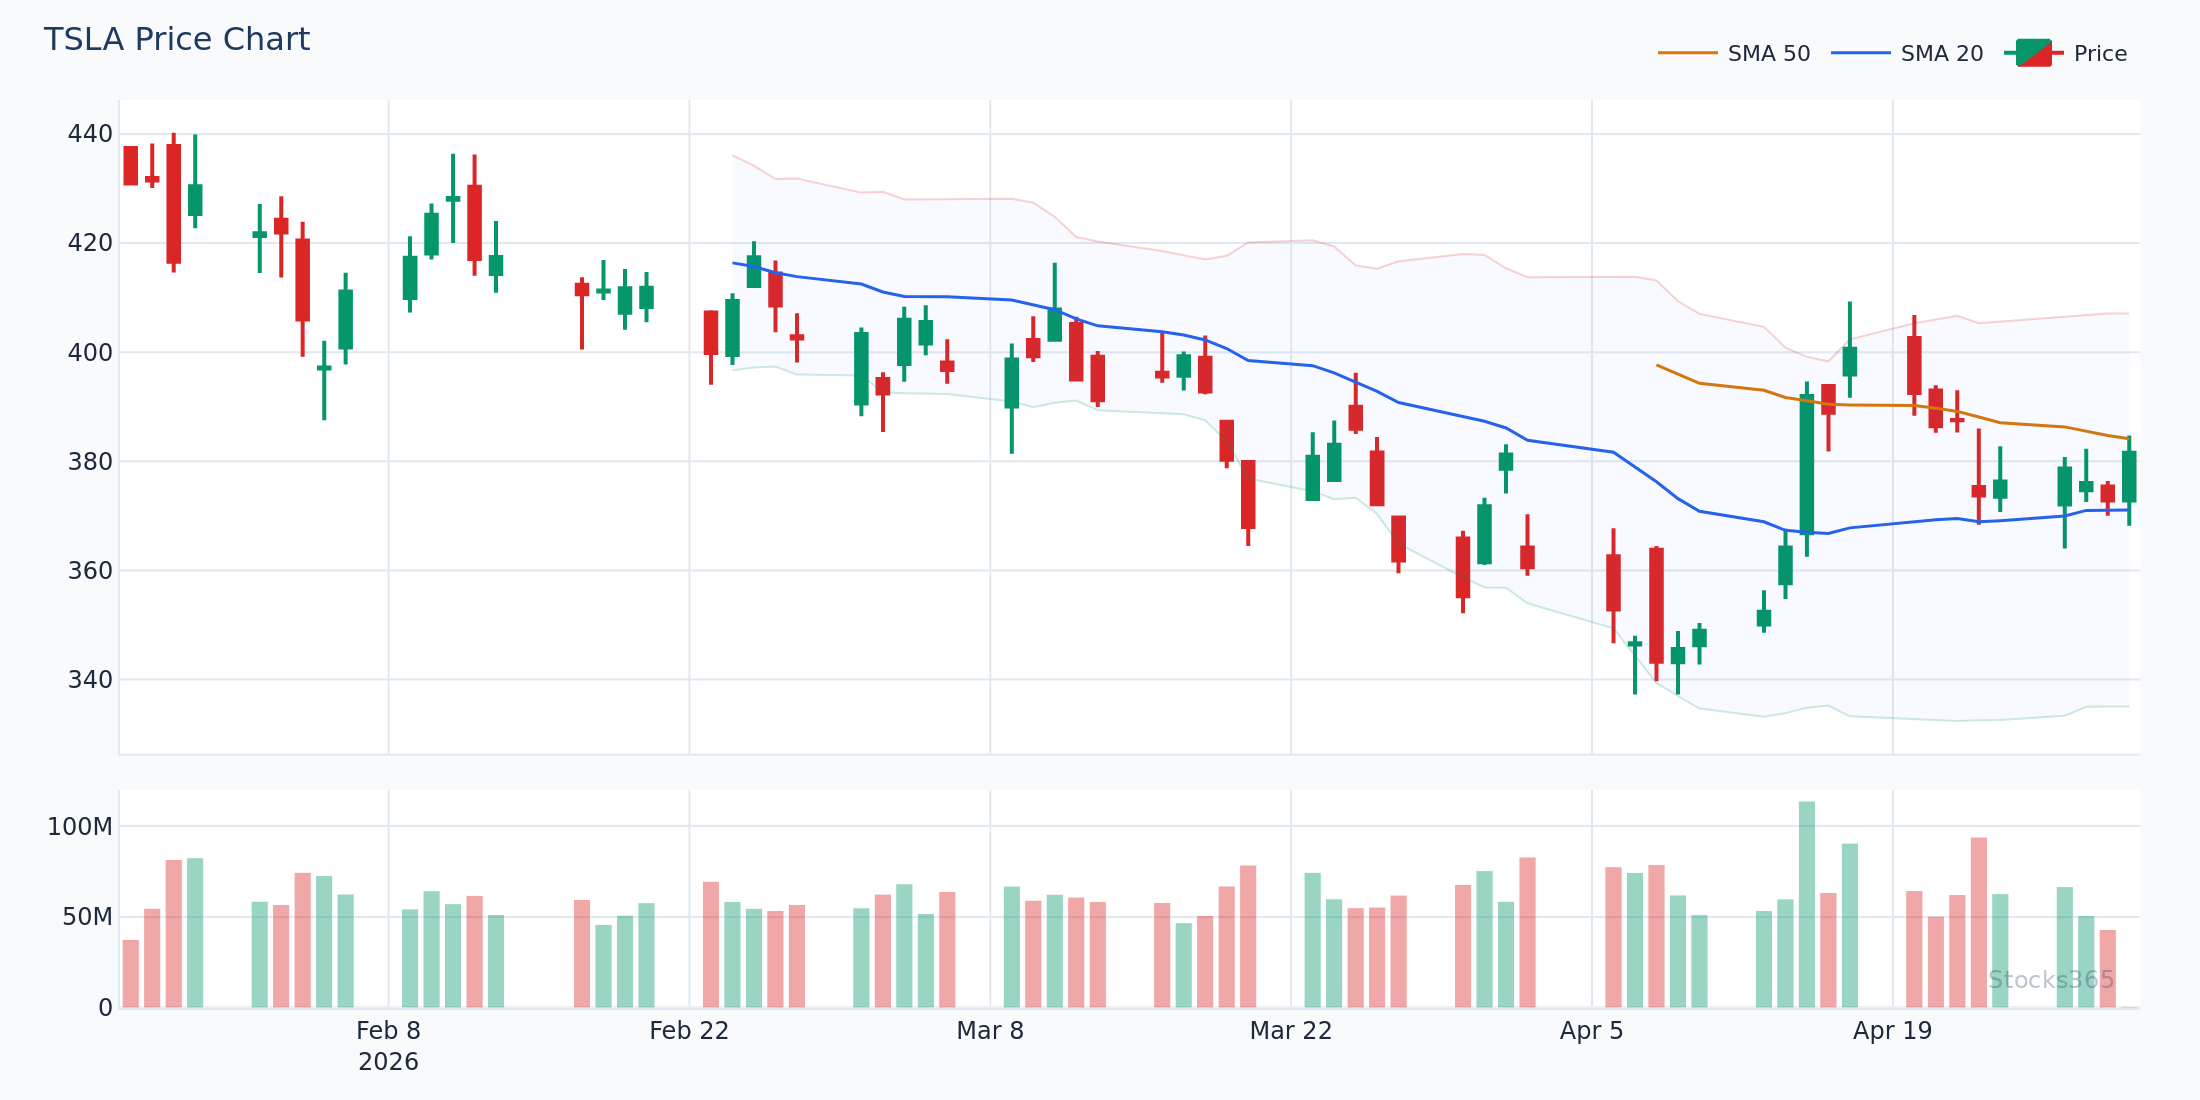
Context determines everything. Moving averages — WMA, EMA, or SMA — perform differently across asset classes. This is not theory. Stocks365 backtested 3,332 signals using an SMA-20 crossover setup and found a 50.9% win rate overall (profit factor: 1.06, 10-day holding), but the breakdown reveals the real story: crypto led with a 66.8% win rate, while forex lagged at just 42.5%.
The implication is direct. Moving average-based strategies — whether WMA or EMA — carry more edge in trending, momentum-driven markets like crypto than in the tighter, mean-reverting dynamics typical of major forex pairs. Before applying any moving average setup, identify which regime you're operating in. The average itself is secondary to that decision.
For crypto traders, the WMA's speed advantage is amplified — the asset class rewards fast reaction. For forex traders, the EMA's smoothness is more valuable — the noise-to-signal ratio in forex demands a filter, not speed. You can track live moving average signals across asset classes on the Stocks365 signals dashboard.
Practical Setup: WMA Pullback in an Uptrend
Here's a clean, repeatable setup using the weighted moving average WMA:
- Identify the trend: Price is above a rising 20-period WMA on the daily chart. Higher highs and higher lows are intact.
- Wait for the pullback: Price retreats toward the 20-period WMA without closing below it on two consecutive candles.
- Check momentum: RSI pulls back to the 45-55 zone — not oversold, just reset. See RSI for beginners if you're new to reading momentum correctly.
- Entry trigger: A bullish engulfing or strong close candle forms at or near the WMA.
- Trend continuation confirmation: Price pushes to a new relative high within 3-5 sessions, with the WMA resuming its upward slope.
Invalidation is simple: a daily close below the WMA — particularly on above-average volume — tells you the pullback has become a breakdown. No argument with the price. Exit and reassess.
This chart shows the WMA pullback setup in action. Price respects the rising WMA on the first test, forming a tight consolidation just above the average. The subsequent expansion candle — with volume returning to above-average levels — provides the confirmation entry. Watch the WMA's slope: as long as it continues pointing upward at a consistent angle, the trend structure is intact. A flattening WMA while price oscillates above and below it signals that the trend is exhausting and the setup loses validity.
EMA Setup: The Golden Cross Variation
The most widely known EMA setup is the golden cross — when the 50-period EMA crosses above the 200-period EMA. It's popular for a reason: it filters out short-term noise and identifies major trend shifts with strong follow-through potential on higher timeframes.
The refined version adds one rule: only act on the golden cross when the shorter-term EMA (say, 20-period) is already above both the 50 and 200. This triple-stack alignment — price above 20 EMA, 20 EMA above 50 EMA, 50 EMA above 200 EMA — creates a regime filter that eliminates many false signals from the raw golden cross alone.
For deeper pattern recognition with RSI confirmation layered on top, this step-by-step RSI guide walks through how to combine oscillators with trend structure effectively.
WMA in Algorithmic and Systematic Strategies
Systematic traders often favor the WMA for one underappreciated reason: its calculation is stateless. You don't need a prior EMA value to compute the WMA. Just the raw price data and the period. This makes the WMA easier to implement cleanly in backtesting engines where seed-value sensitivity can distort early EMA results — particularly for instruments with short price histories.
For signal agreement scoring in quantitative systems, the WMA's determinism is a significant advantage. Every system produces the same number. There's no seed value debate, no warm-up period controversy. Clean input, clean output.
The Stocks365 trust score system leverages this principle — multi-indicator agreement is only meaningful when each component produces a consistent, verifiable signal. Explore RSI divergence as another example of a deterministic, rule-based component that feeds into signal quality scoring.
What to Watch For
- WMA slope reversal in trending crypto assets: When a rising 10-period WMA on the 4-hour chart flattens and then turns down while price simultaneously fails to make a new high, the momentum is exhausting before the price confirms it. That divergence between WMA direction and price structure is an early exit signal.
- EMA stack compression before breakouts: On equities, when the 20, 50, and 200 EMAs compress within a narrow price band over 3-4 weeks, the subsequent expansion typically produces a sustained directional move. The direction of the break — confirmed by a close beyond all three averages — sets the bias.
- WMA and RSI dual confirmation on pullbacks: In an established uptrend, look for price pulling back to the 20-period WMA while RSI simultaneously touches the 40-50 range. Both conditions together produce cleaner entries than either alone.
- False EMA cross filtering with volume: EMA crossovers in low-volume environments — particularly during holiday periods or pre-market sessions — have significantly lower follow-through rates. Always cross-reference crossover signals with volume relative to the 20-session average. Sub-average volume on a cross is a yellow flag.
- WMA as dynamic resistance in downtrends: In bearish regimes, the falling WMA often acts as a ceiling on bounces. Watch for price rallies that stall at or just below the declining WMA on above-average volume — these are high-quality short continuation setups.
How Stocks365 Uses This
Stocks365 Trust Score Integration
The Stocks365 trust score system evaluates each signal across 12+ technical indicators, and moving average agreement is one of the core components. Specifically, the system checks whether a signal aligns with weighted and exponential moving average direction across multiple timeframes — daily, 4-hour, and weekly. When a buy signal appears on a stock like AAPL and both the WMA and EMA on the daily and weekly charts are sloping upward with price above both, that multi-timeframe alignment adds meaningful weight to the trust score. Conversely, when WMA and EMA signals conflict — for example, a WMA crossover in an otherwise EMA-declining environment — the trust score penalizes the signal for regime disagreement. This prevents traders from acting on technically valid but context-inappropriate setups. The regime scoring component, which includes moving average direction and slope analysis, is one of the factors most strongly correlated with signal outcome in our internal backtests. You can see trust scores live on the Stocks365 signals dashboard.
Key Takeaways
Summary: WMA vs EMA — What Matters
- The weighted moving average WMA uses linear weights with a hard cutoff; the EMA uses exponential decay with infinite memory
- WMA is more responsive — better for confirmed momentum and fast-moving markets like crypto
- EMA is smoother — better for swing trading, mixed conditions, and avoiding whipsaws
- Asset class matters: moving average setups show significantly more edge in trending markets than in forex's mean-reverting dynamics
- Combining WMA (signal) with EMA (trend filter) produces a powerful dual-average framework that aligns entries with broader trend direction
- Neither average is superior in isolation — regime identification determines which is appropriate
- Stocks365 trust scores integrate moving average agreement across timeframes as a core signal quality component
Frequently Asked Questions
What is the main difference between a weighted moving average (WMA) and an EMA?
The WMA assigns linear weights to each price in a fixed lookback window — the most recent gets the highest weight, and the oldest is dropped entirely when the window moves. The EMA uses an exponential smoothing factor applied to the previous EMA value, meaning old data never fully disappears but decays continuously. This makes the WMA more reactive to recent price changes and the EMA smoother and less prone to short-term whipsaws.
Which is better for day trading: WMA or EMA?
For day trading in confirmed trending conditions — particularly in crypto or high-momentum equities — the WMA's faster reaction time can provide earlier entry signals. However, in choppy intraday conditions, the EMA's built-in smoothing reduces false signals. Many day traders use the WMA as the signal line and EMA as the trend filter, only taking WMA signals that align with EMA direction.
Does the weighted moving average WMA work better than EMA in crypto markets?
Stocks365 backtested 3,332 moving average crossover signals and found that crypto led all asset classes with a 66.8% win rate — significantly above the 50.9% overall average. Crypto's strong momentum characteristics tend to reward faster, more reactive averages like the WMA. That said, the asset class advantage applies to both WMA and EMA setups in trending crypto conditions — the WMA simply tends to capture the entry marginally earlier.
Can I use WMA and EMA together in one strategy?
Yes — and this is often the most effective approach. Use the WMA as your signal line (faster, more reactive) and the EMA as your trend filter (slower, more stable). Enter long positions when the WMA crosses above the EMA while both are rising and price is above both. This dual-average framework keeps you aligned with the trend while filtering out many counter-trend noise signals that plague single-average strategies.
How do I choose the right period for a WMA or EMA?
Period selection depends on your trading timeframe and holding period. Short periods (5-15) suit day traders and scalpers who need fast signals. Medium periods (20-50) work well for swing traders looking at multi-day to multi-week moves. Long periods (100-200) define major trend direction for position traders. A useful starting framework: test the period that corresponds to roughly half your typical holding period — if you hold for 20 days, a 10-period WMA or EMA is a logical starting calibration. You can refine further using the RSI settings approach outlined in our <a href=