
What Are Bollinger Bands? Understanding the Basics
If you've ever looked at a price chart and wondered about those three lines hugging the candlesticks like an envelope, you've likely been looking at Bollinger Bands. Developed by legendary technical analyst John Bollinger in the 1980s, Bollinger Bands have become one of the most widely used technical indicators in modern trading — and for good reason.
Simply put, Bollinger Bands are a volatility indicator that places two outer bands above and below a central moving average. These bands expand when the market is volatile and contract when it's calm. This dynamic behavior makes them an incredibly versatile tool for traders across all asset classes — from stocks and ETFs to forex and crypto.
In this beginner's guide, we'll break down exactly what Bollinger Bands are, how they're calculated, what their signals mean, and how you can start using them in your own trading strategy today.
How Are Bollinger Bands Calculated?
Understanding how Bollinger Bands are built gives you a much deeper appreciation of what they're telling you. The good news? The math is surprisingly straightforward.
Bollinger Bands consist of three components:
- The Middle Band: A Simple Moving Average (SMA), typically set to 20 periods
- The Upper Band: The middle band plus two standard deviations
- The Lower Band: The middle band minus two standard deviations
The formula looks like this:
Upper Band = SMA(20) + (2 × Standard Deviation)
Middle Band = SMA(20)
Lower Band = SMA(20) − (2 × Standard Deviation)
The key ingredient here is standard deviation — a statistical measure of how spread out prices are from the average. When prices are swinging wildly, standard deviation increases, causing the bands to widen. When prices are moving quietly, standard deviation shrinks, and the bands tighten.
This is why Bollinger Bands are considered a self-adjusting volatility indicator. Unlike a fixed channel drawn by hand, the bands automatically adapt to changing market conditions in real time.
Default Settings and How to Customize Them
The default settings — a 20-period SMA with 2 standard deviations — work well for most trading scenarios. However, like all technical indicators, you can customize them based on your strategy:
- Shorter period (e.g., 10 SMA): More sensitive bands, useful for short-term or day trading
- Longer period (e.g., 50 SMA): Smoother bands, better for swing traders and long-term investors
- 1.5 standard deviations: Tighter bands — more signals, but more false positives
- 2.5 standard deviations: Wider bands — fewer signals, but potentially higher accuracy
Just as traders customize RSI periods to match their timeframe — a topic covered in depth in our guide on RSI Settings: Master the Best Period for Your Strategy — tuning your Bollinger Band settings to your specific style can make a meaningful difference in performance.
What Do Bollinger Bands Tell You? Reading the Signals
Now we get to the practical heart of the matter. Bollinger Bands generate several important types of signals that traders use to inform their decisions. Let's walk through each one.
1. The Bollinger Band Squeeze — Anticipating Big Moves
The Bollinger Band Squeeze is arguably the most powerful signal the indicator generates. It occurs when the upper and lower bands come very close together, indicating an extended period of low volatility. In trading, periods of low volatility are typically followed by explosive moves in either direction.
Think of it like a coiled spring. The longer and tighter the squeeze, the more energy is being stored — and eventually, that energy is released in the form of a sharp price breakout.
How to trade the Squeeze:
- Identify a period where the bands are unusually narrow (you can also use the Bandwidth indicator for precision)
- Watch for a candle that closes decisively outside one of the bands — this often signals the direction of the breakout
- Confirm the signal with volume or a momentum indicator like RSI before entering
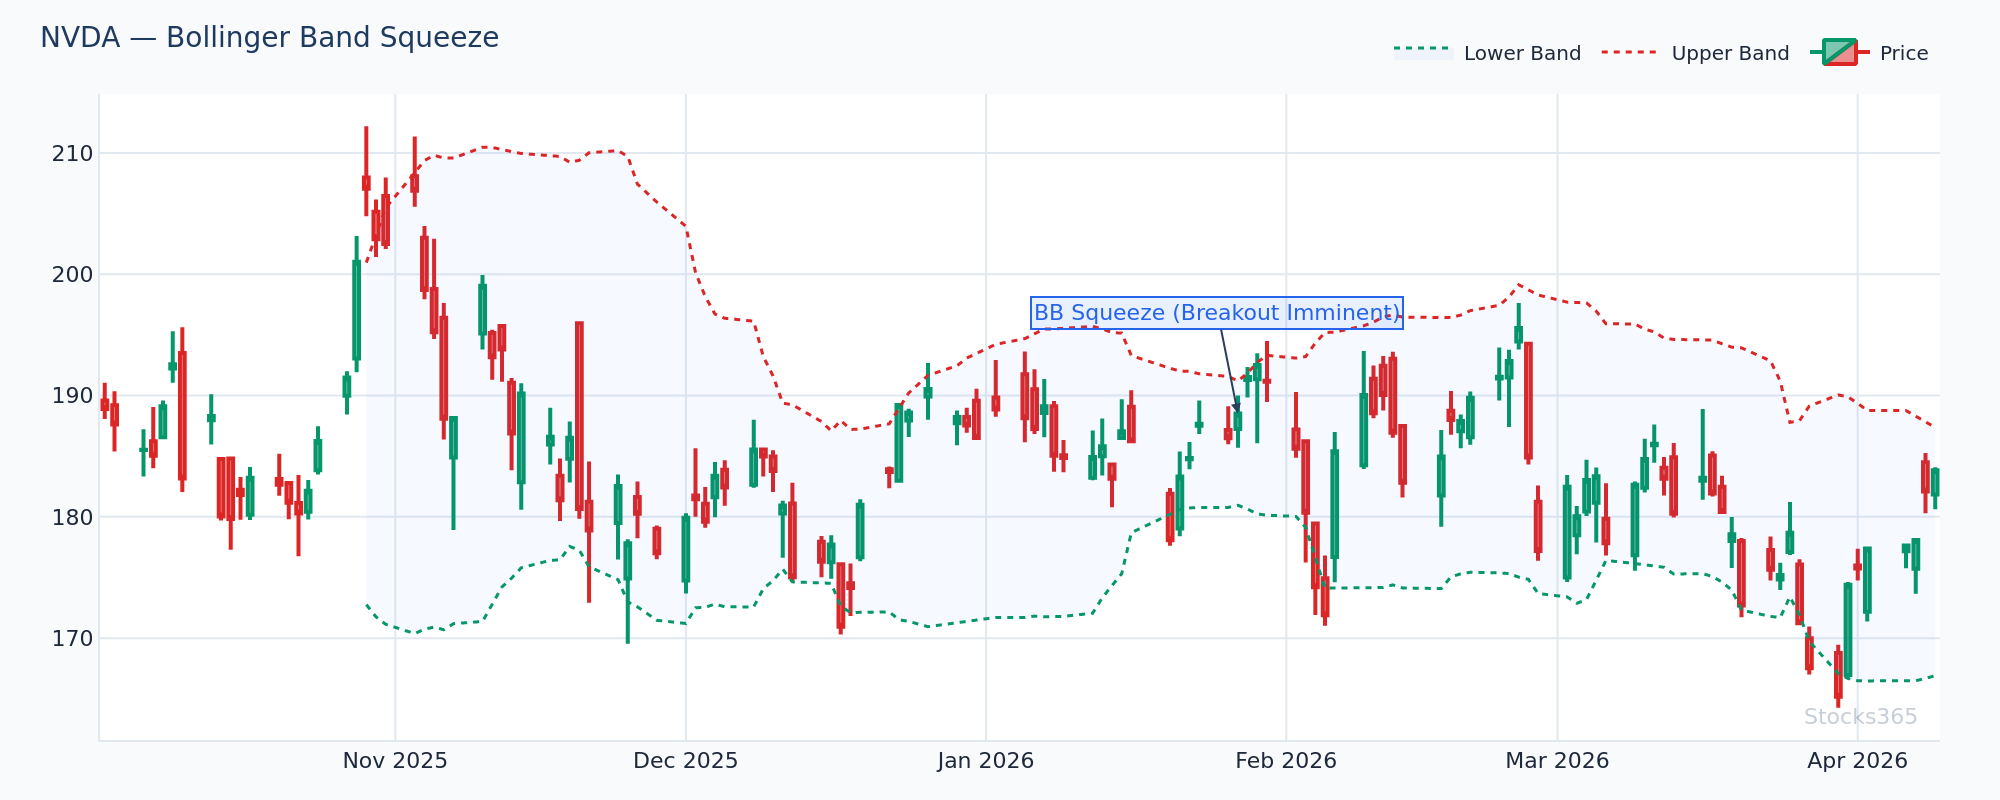
For example, in early 2026, NVDA entered a tight consolidation phase after a strong earnings-driven rally. The Bollinger Bands narrowed dramatically over eight trading sessions. When price finally broke above the upper band on elevated volume, traders who recognized the squeeze were positioned for a significant upward move before the rest of the crowd caught on.
2. Price Touching the Upper Band — Overbought or Bullish?
One of the most common misconceptions among beginners is that when price touches the upper Bollinger Band, it's automatically a sell signal. This is a dangerous oversimplification.
In a strongly trending market, price can "walk the band" — repeatedly touching or even closing above the upper band for an extended period. This is actually a sign of strength, not weakness. In this context, selling every time price touches the upper band would mean exiting profitable trades far too early.
However, in a ranging or sideways market, touching the upper band can legitimately signal that price is extended and due for a pullback. The key is context — always assess whether the market is trending or ranging before interpreting band touches.
3. Price Touching the Lower Band — Oversold or Bearish?
The same logic applies in reverse. When price touches the lower band in a ranging market, it can signal a potential bounce — a buying opportunity. But in a downtrending market, price can walk down the lower band persistently, and buying every lower band touch becomes a costly mistake.
To distinguish between these scenarios, many professional traders pair Bollinger Bands with momentum oscillators. Our comprehensive guide, What Is RSI? The Complete Beginner's Guide, explains how the Relative Strength Index can help you confirm whether a band touch is a true reversal signal or simply a continuation of trend.
4. The W-Bottom and M-Top Patterns
John Bollinger himself identified these as some of the most reliable patterns generated by his indicator:
- W-Bottom (Bullish Reversal): Price makes a low that touches or breaches the lower band, bounces, pulls back to test the low without touching the band again, then rallies. This "W" shape signals accumulation and potential trend reversal upward.
- M-Top (Bearish Reversal): The inverse pattern. Price makes a high near the upper band, pulls back, rallies again but fails to reach the band, then declines. This signals distribution and a potential downtrend beginning.
Bollinger Bands + Other Indicators: Powerful Combinations
Bollinger Bands are most effective when used as part of a broader toolkit. On their own, they provide context about volatility and relative price levels. But paired with the right indicators, they become significantly more powerful.
Bollinger Bands + RSI
This is one of the most popular combinations in technical analysis for a reason — it works. The concept is simple: use Bollinger Bands to identify where price is relative to its range, and use the RSI to confirm whether momentum supports a reversal or continuation.
A high-probability setup looks like this:
- Price touches the lower Bollinger Band
- RSI simultaneously reads below 30 (oversold territory)
- This dual confirmation increases the odds of a meaningful bounce
To understand exactly how to interpret RSI readings in this context, check out our detailed guide: RSI Overbought and Oversold Levels: Master the Signals.
Bollinger Bands + Stochastic Oscillator
Another excellent pairing. The Stochastic Oscillator, like RSI, measures momentum — but it uses a slightly different calculation that can sometimes catch signals RSI misses. When price touches the lower Bollinger Band and the Stochastic Oscillator crosses bullishly from the oversold zone, that's a compelling entry signal. Our article RSI vs Stochastic Oscillator: The Essential Guide explores the nuances between these two momentum tools so you can decide which fits your strategy best.
Bollinger Bands + Volume
Volume is the one ingredient that can validate almost any technical signal. A breakout from a Bollinger Band Squeeze accompanied by surging volume is far more reliable than one occurring on thin volume. Always check volume before committing to a breakout trade.
Practical Bollinger Band Trading Strategies
Strategy 1: The Mean Reversion Trade (Ranging Markets)
This strategy works best when a stock or asset is consolidating in a defined range — think of a stock trading between $150 and $170 for several weeks.
Setup:
- Confirm the market is ranging (no clear uptrend or downtrend)
- Wait for price to touch or slightly exceed the lower band
- Look for a bullish reversal candle (hammer, engulfing, doji)
- Confirm with RSI below 35 or a Stochastic crossover in oversold territory
- Enter long with a stop-loss just below the recent swing low
- Target: the middle band (20 SMA) or the upper band
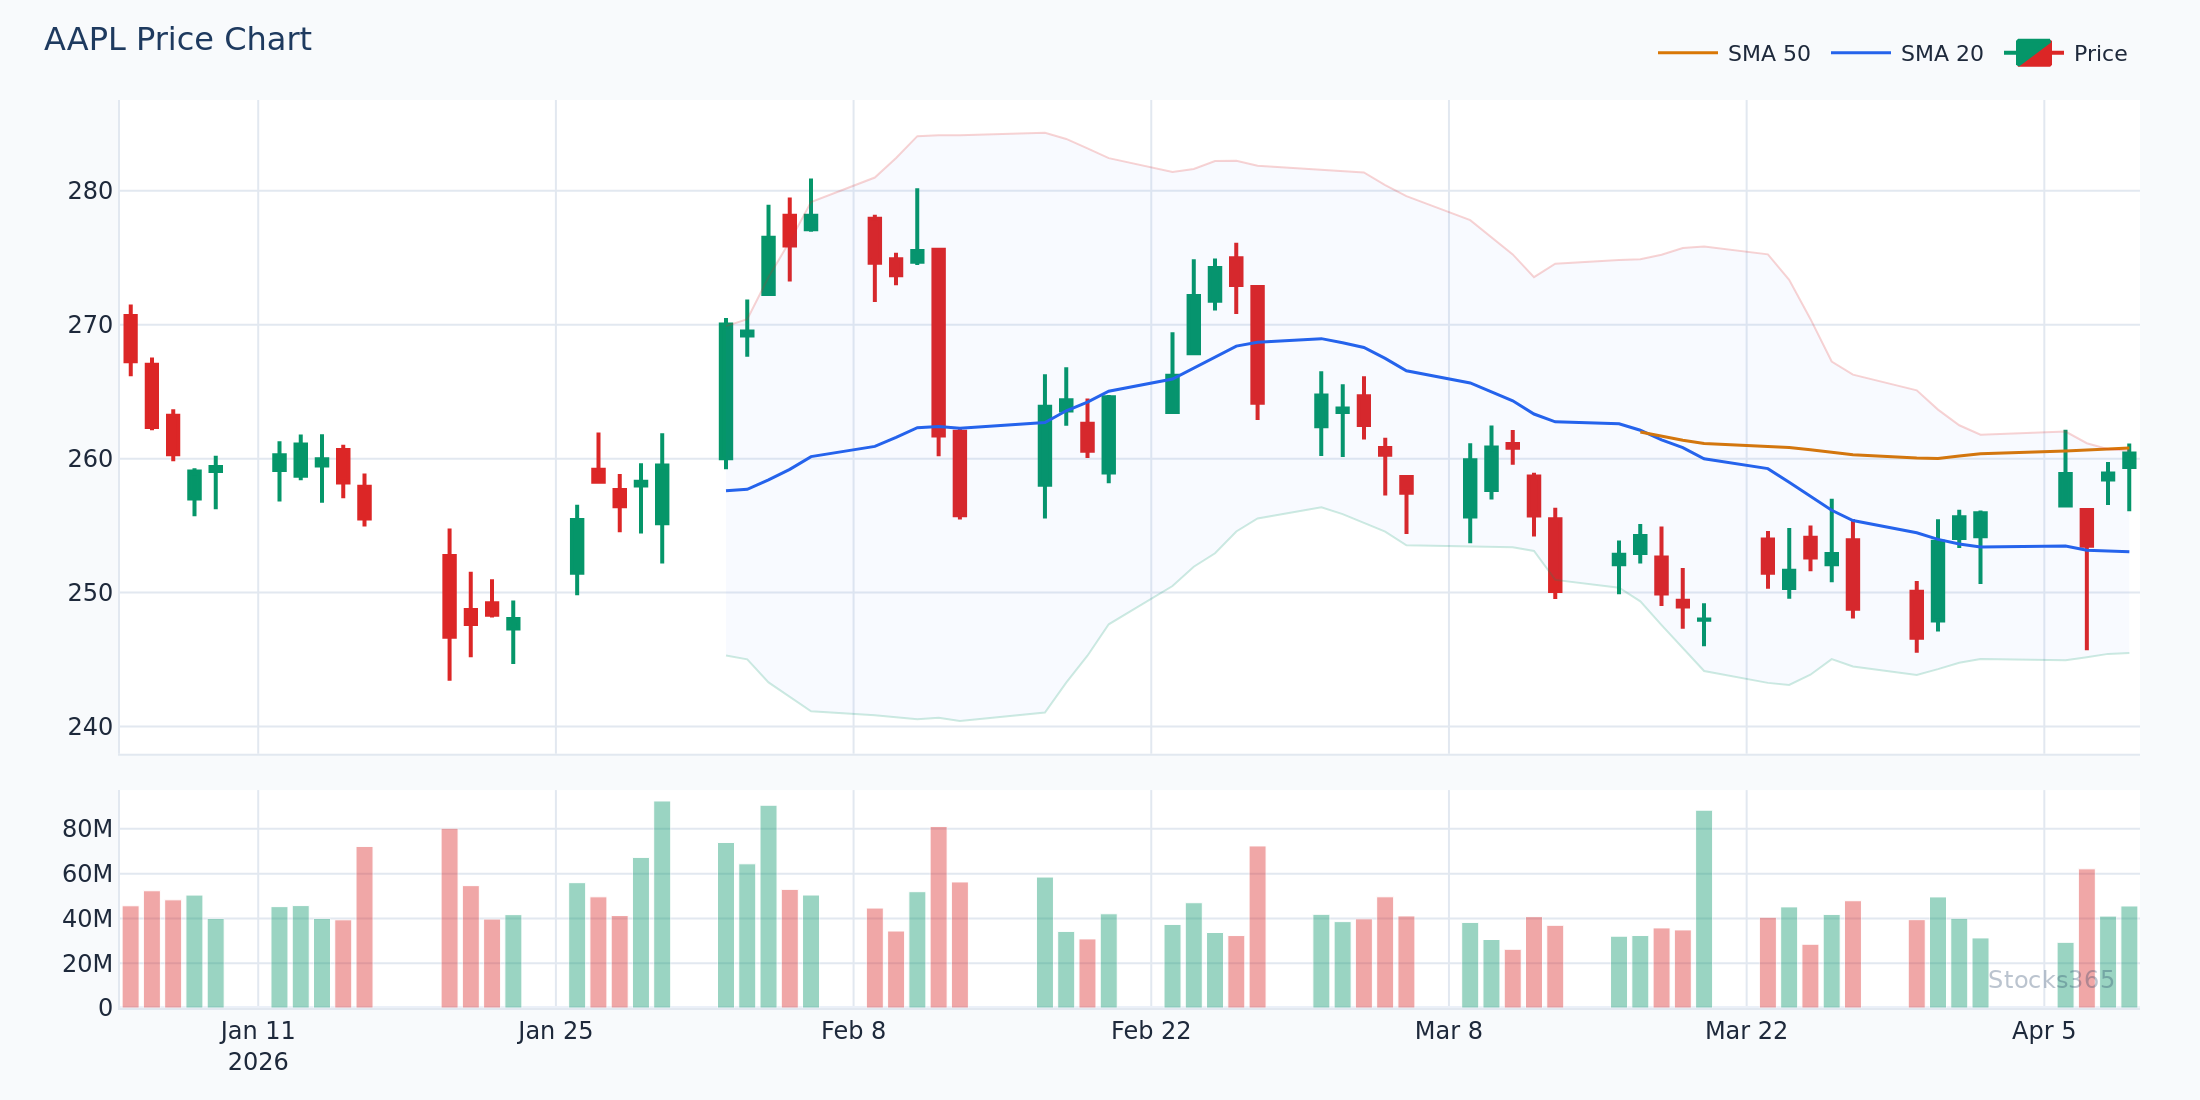
Example: Imagine AAPL is trading in a range between $195 and $215. Price dips to $196, touching the lower band. RSI shows 31. A bullish engulfing candle forms. A trader enters at $198 with a stop at $193, targeting $207 (the 20 SMA). Risk/reward: roughly 1:2.
Strategy 2: The Squeeze Breakout (Trending Markets)
Setup:
- Identify a Bollinger Band Squeeze (bands at multi-week lows in width)
- Wait for a strong candle to close outside either band
- Confirm with increasing volume
- Enter in the direction of the breakout
- Place a stop-loss on the opposite side of the middle band
- Trail your stop as the trade develops
You can monitor emerging squeeze setups across hundreds of stocks in real time using the Stocks365 signals dashboard, which flags volatility compressions and breakout conditions as they develop.
Strategy 3: Band Walking Trend Continuation
In a strong uptrend, use pullbacks to the middle band (20 SMA) as buying opportunities rather than waiting for price to reach the lower band.
- Confirm a strong uptrend (price consistently above the 20 SMA)
- Wait for a pullback to touch or slightly breach the 20 SMA (middle band)
- Look for a bullish bounce candle at the middle band
- Enter long with a stop below the middle band
- Hold for a move back toward or above the upper band
Common Bollinger Band Mistakes to Avoid
Even experienced traders fall into these traps. Being aware of them puts you ahead of the majority:
- Treating band touches as automatic signals: Context is everything. Always assess the broader trend first.
- Ignoring the squeeze: The squeeze is one of the most profitable setups — don't overlook it because it looks "boring" during the compression phase.
- Using Bollinger Bands in isolation: They are a volatility indicator, not a complete system. Combine them with momentum indicators and volume analysis.
- Misinterpreting band width: Wide bands don't mean "sell." They mean volatility is high. Price can continue moving in the same direction even with expanded bands.
- Over-optimizing settings: Endlessly adjusting the period and standard deviation to fit historical data often leads to strategies that perform poorly in live markets.
For traders who also use RSI alongside Bollinger Bands, understanding advanced RSI concepts like divergence can add another powerful layer of confirmation to your analysis. Our guides on RSI Divergence Explained: Master Bullish & Bearish Signals and Hidden RSI Divergence: The Advanced Signal Most Traders Miss are excellent next steps.
How Stocks365 Helps You Apply Bollinger Bands in Real Time
Understanding an indicator conceptually is one thing — applying it consistently across dozens of stocks in real time is another challenge entirely. This is where Stocks365 bridges the gap.
The Stocks365 platform continuously scans markets for high-probability technical setups, including Bollinger Band squeezes, breakouts, and mean reversion opportunities. Each signal comes with a Stocks365 Trust Score — a proprietary confidence rating that evaluates the signal's strength based on multiple confluent factors including band position, momentum readings, volume behavior, and broader market context.
For example, if you're tracking AAPL signals on Stocks365, you'll see not just whether price is at a band extreme, but whether multiple confirming factors align — giving you a data-backed edge rather than relying on gut feel alone.
This multi-factor approach mirrors exactly what professional traders do manually — combining Bollinger Bands with momentum oscillators and volume analysis — but Stocks365 does it automatically across the entire market simultaneously.
📌 Key Takeaways
- Bollinger Bands consist of a 20-period SMA flanked by upper and lower bands set 2 standard deviations apart
- The bands expand in high volatility and contract in low volatility, making them self-adjusting
- The Bollinger Band Squeeze signals a pending breakout — one of the most powerful setups in technical analysis
- Price touching the upper band is not automatically bearish; in a trend, it signals strength
- Bollinger Bands are most effective when combined with RSI, Stochastic, or volume analysis for confirmation
- The W-Bottom and M-Top patterns are John Bollinger's own high-reliability reversal signals
- Always assess market context (trending vs. ranging) before interpreting any Bollinger Band signal
- Tools like the Stocks365 dashboard can identify Bollinger Band setups in real time across the entire market