
Why RSI Fails in Trending Markets: The Problem Every Trader Must Understand
The Relative Strength Index is one of the most widely used technical indicators in trading — and for good reason. It's elegant, intuitive, and remarkably effective in the right conditions. But there's a dangerous trap waiting for traders who rely on RSI in trending markets without understanding its fundamental limitations.
Here's the painful truth: the very mechanism that makes RSI so useful in ranging markets becomes its greatest weakness when price enters a sustained trend. Traders who ignore this dynamic consistently get stopped out, miss major moves, or worse — trade aggressively against a powerful trend because a number on their screen says "overbought."
In this guide, we'll break down exactly why RSI struggles in trending conditions, show you real examples of where it misleads traders, and give you a practical toolkit of strategies to replace or complement it when markets are trending hard.
Key Insight: RSI was designed by J. Welles Wilder to identify overbought and oversold conditions in ranging markets. Using it without context in a strong trend is like using a thermometer to measure wind speed — the tool isn't wrong, it's simply being used for the wrong job.
How RSI Works — and Why That Creates Problems in Trends
Before we diagnose the failure, it helps to understand the mechanics. If you want a deep dive into the math, read our full breakdown at How RSI Is Calculated: Formula Explained Step by Step. But the core idea is this: RSI compares average gains to average losses over a lookback period (typically 14 periods) and outputs a value between 0 and 100.
When RSI climbs above 70, the conventional wisdom — explained thoroughly in RSI Overbought and Oversold Levels: Master the Signals — is that the asset is overbought and due for a pullback. Below 30 signals oversold conditions and a potential bounce.
This logic works beautifully when price oscillates within a range. The problem? In a strong uptrend, RSI can remain above 70 for weeks or even months. Every time it crosses 70 and a trader shorts the position expecting a reversal, the market simply keeps climbing — and the trade bleeds.
The Overbought Trap in Bull Trends
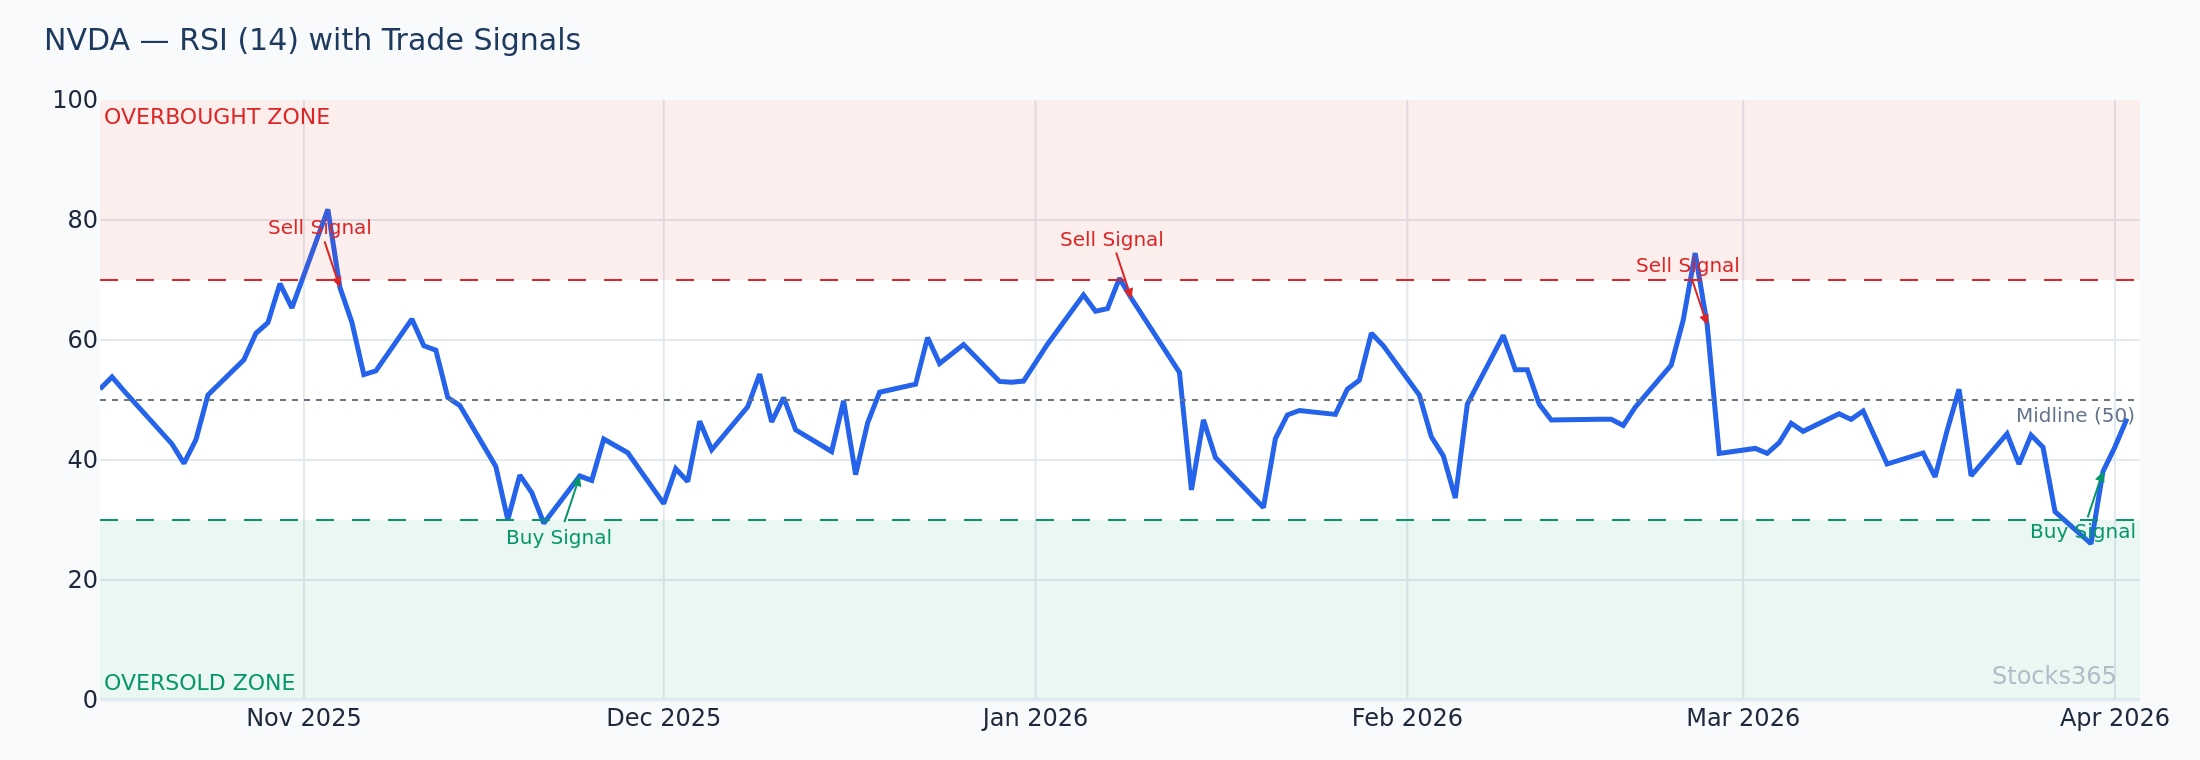
Consider what happens with a stock like NVDA during a major trending phase. Suppose NVDA is trading at $180 and begins a strong institutional-driven uptrend. RSI crosses above 70 at $195. A trader expecting mean reversion shorts the position. But NVDA continues to $220, $250, $280 — with RSI stubbornly parked between 70 and 85 the entire time.
The RSI wasn't lying. It correctly told you that recent gains dominated recent losses. The problem is that in a trending market, that's supposed to be the case — it's the definition of a trend. RSI can't distinguish between "overbought in a range" and "strongly trending upward."
The Oversold Trap in Bear Trends
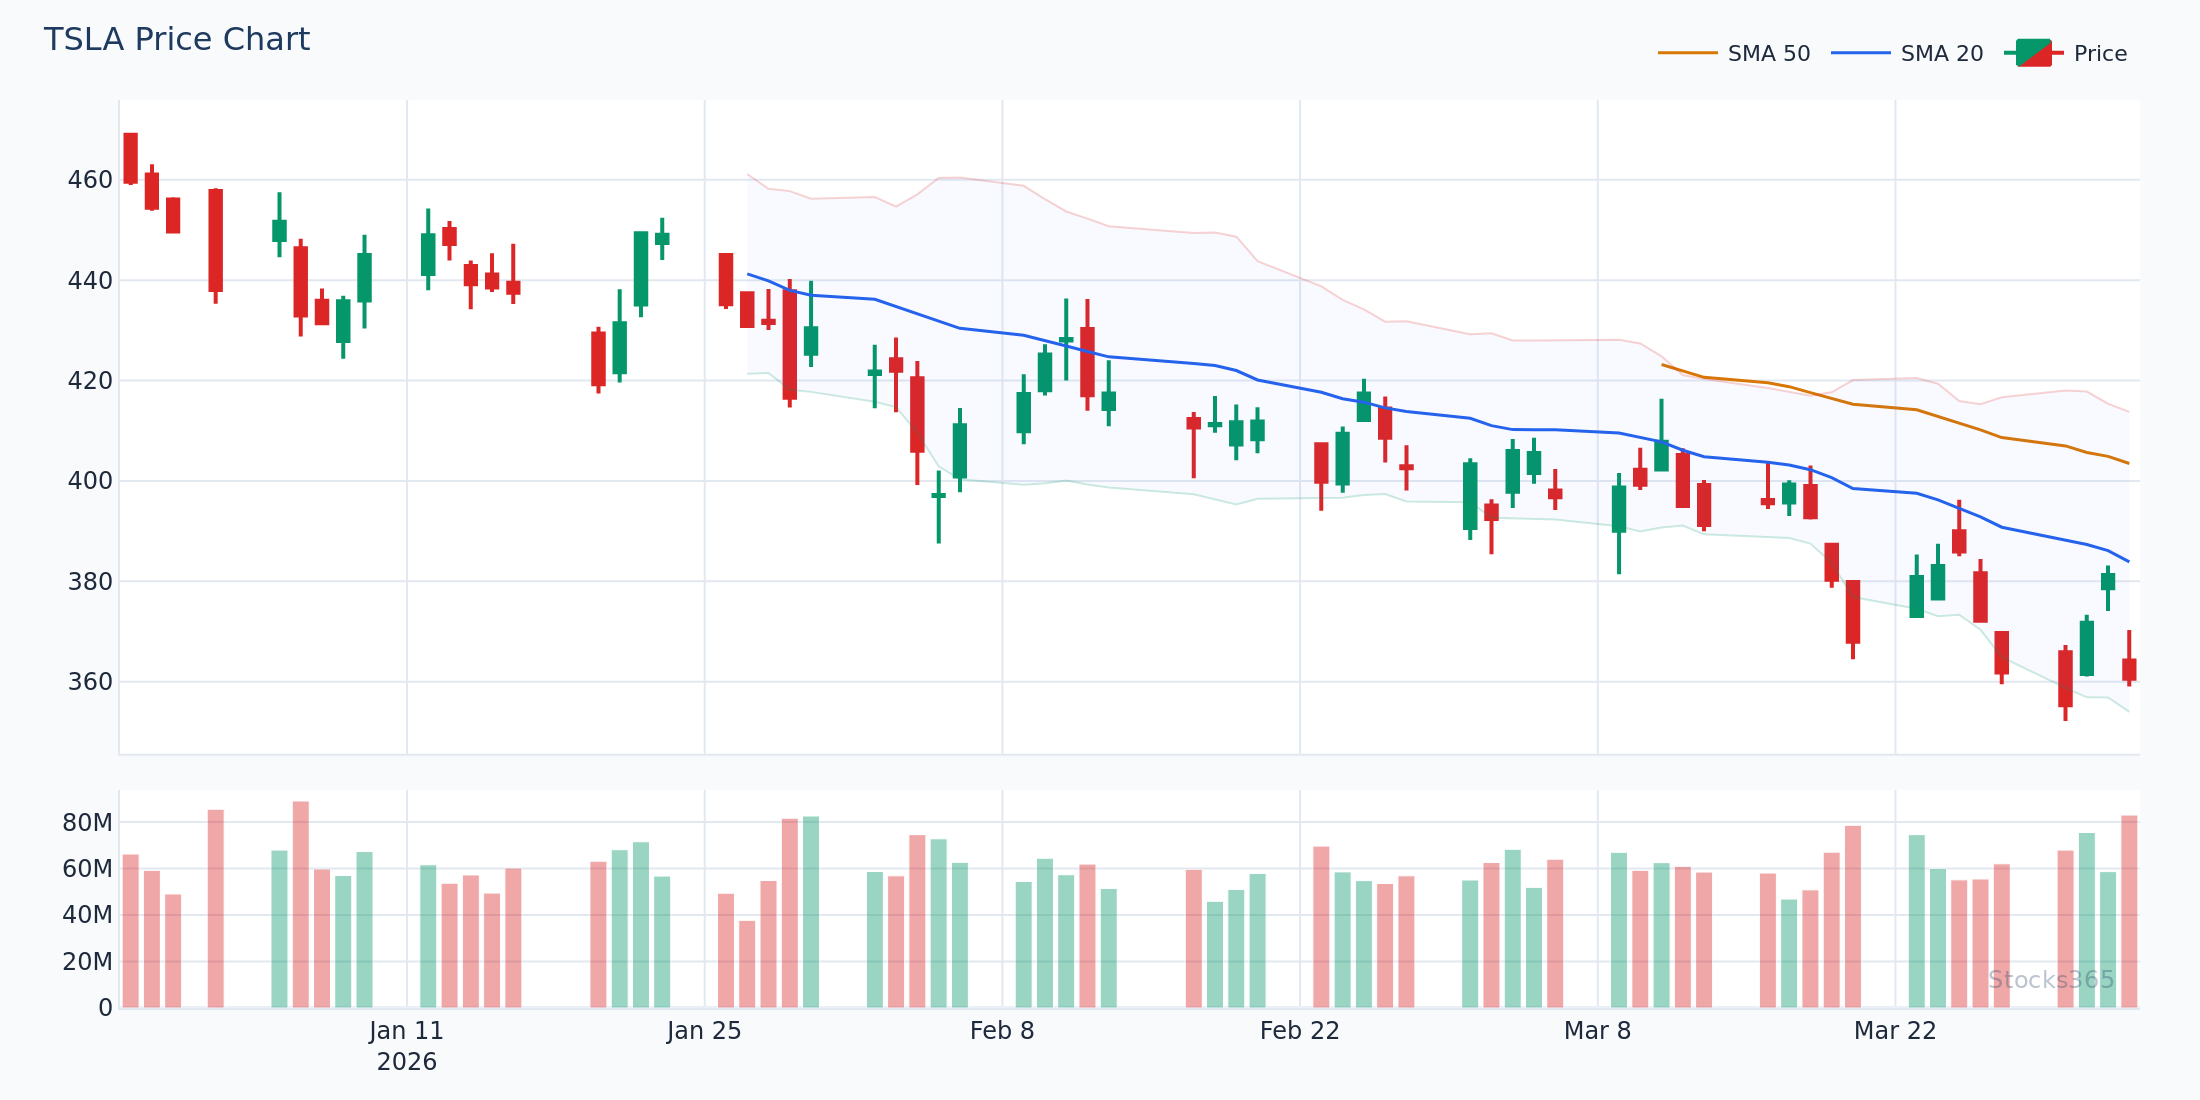
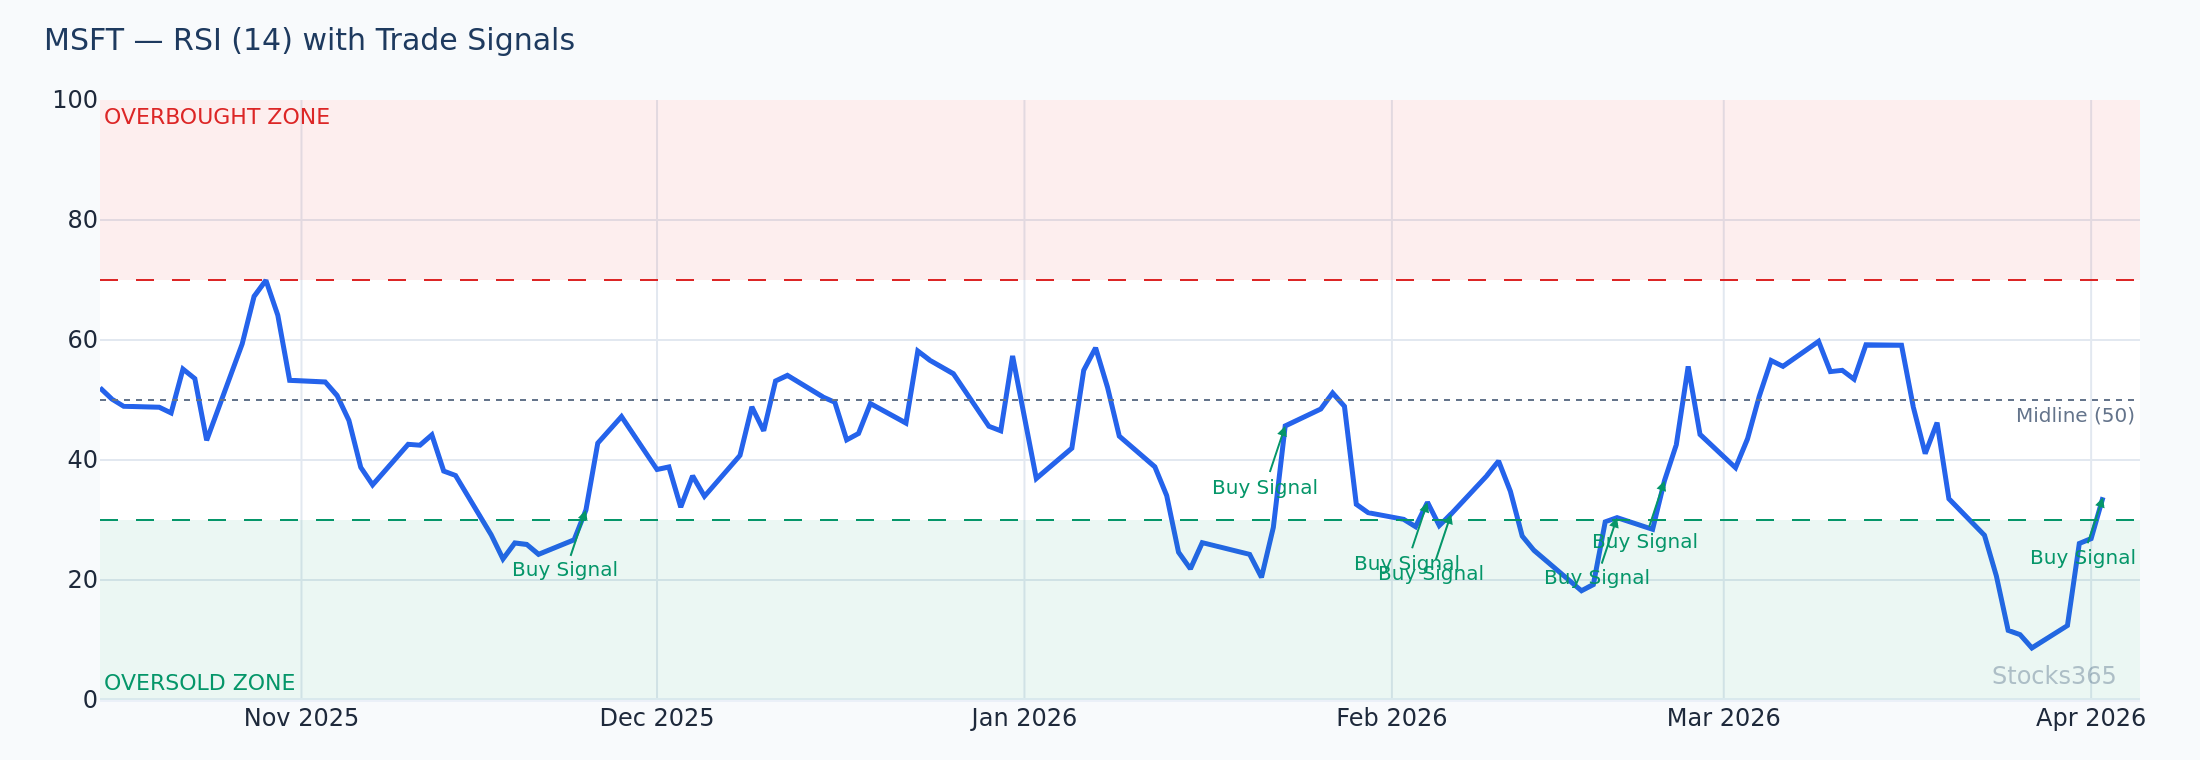
The same failure mode applies in downtrends, just in reverse. A stock in a confirmed downtrend can have RSI drop below 30 and stay there for extended periods. Traders who buy every "oversold" reading get repeatedly crushed as the stock continues lower. What reads as an attractive entry is actually a falling knife.
The Five Ways RSI Specifically Fails in Trending Markets
1. Premature Reversal Signals
RSI's design creates a mathematical ceiling effect. As an asset trends strongly, RSI will frequently hit overbought or oversold territory and generate what appears to be a reversal signal. In reality, the trend has simply overcome the indicator's range. These false signals are particularly costly because they tempt traders to fight the dominant price direction.
2. Persistent Extreme Readings
In strong trends, RSI parks itself at extreme levels for far longer than most traders expect. A 14-period RSI above 70 in a bull trend can remain elevated for 20, 30, or even 50 candles. Traders using this as a sole exit signal stay out of profitable long positions indefinitely.
3. Divergence Signals That Don't Resolve
Bearish RSI divergence — where price makes a higher high but RSI makes a lower high — is a powerful signal in ranging markets. But in a strong uptrend, divergence can persist across multiple price swings before any actual reversal occurs. If you're not familiar with divergence mechanics, our article on RSI Divergence Explained: Master Bullish & Bearish Signals provides essential context. The key takeaway: divergence signals need trend context to be actionable.
4. Wrong Baseline Assumptions
The standard 70/30 thresholds assume a roughly symmetrical market oscillation. Strong trends break this symmetry. In powerful bull markets, the "normal" RSI range might be 50–80 rather than 40–60. Traders using fixed thresholds without adjusting for trend regime will generate a steady stream of bad signals.
5. Timeframe Mismatch Amplification
On shorter timeframes, RSI whipsaws become even more pronounced during trends. A 5-minute RSI in a trending stock will cross overbought and oversold dozens of times in a single session, creating a signal-noise problem that's nearly impossible to trade profitably without additional filters.
What to Use Instead: Proven Alternatives for Trending Markets
The answer isn't to abandon RSI entirely — it's to understand when it works and deploy better tools when it doesn't. Here are the most effective approaches for trading in trending environments.
1. Trend-Following Indicators: Moving Averages
In trending markets, moving averages are your best friend. They don't try to predict reversals — they confirm and follow the trend. The most practical approaches include:
- 20-period EMA as dynamic support: In an uptrend, price consistently bounces off the 20 EMA. Each touch becomes a buy signal rather than a reversal alert.
- 50/200 EMA crossover: When the 50 EMA crosses above the 200 EMA (the "golden cross"), it confirms a long-term trend change and signals a sustained opportunity.
- Moving average alignment: When the 20, 50, and 200 EMAs are all stacked in the same direction, you have a high-confidence trending environment where mean-reversion indicators like RSI should be used cautiously or not at all.
Example: AAPL is trading at $220 with its 20 EMA at $215, 50 EMA at $205, and 200 EMA at $190 — all pointing upward. RSI is at 72. Rather than shorting the "overbought" RSI, a trend-following trader buys the next pullback to the 20 EMA at $215 and rides the trend continuation.
2. ADX (Average Directional Index) for Trend Strength
The ADX is specifically designed to measure trend strength, not direction. When ADX reads above 25, a trend is in force. Above 40 indicates a powerful trend. This single filter can dramatically improve your RSI trading:
- ADX below 20: Range-bound market — RSI signals are reliable
- ADX 20–25: Transitional phase — use RSI cautiously
- ADX above 25: Trending market — suspend RSI reversal signals, switch to trend-following approach
Adding ADX as a regime filter to your RSI strategy can immediately eliminate a large portion of false signals. When ADX is high, ignore overbought/oversold readings and only trade in the direction of the trend.
3. Adjusted RSI Levels for Trending Environments
Rather than abandoning RSI entirely in trends, some experienced traders adjust their overbought/oversold thresholds. In a strong uptrend, they shift the overbought level to 80 and the oversold level to 40. In downtrends, the mirror adjustment applies: 60 becomes overbought and 20 becomes oversold.
This approach — sometimes called "bull market RSI" or "bear market RSI" — acknowledges the asymmetry of trending conditions while keeping RSI in your toolkit. Our guide on RSI Settings: Master the Best Period for Your Strategy covers how to adapt RSI parameters to different market conditions.
4. Using RSI as a Trend Entry Trigger (Not a Reversal Signal)
Here's a powerful reframe: instead of using RSI to identify when a trend might reverse, use it to identify pullback entry points within the trend. In an uptrend, wait for RSI to pull back to the 40–50 zone — not into oversold territory — before entering long. This "RSI dip" approach captures trend continuation trades at better prices without fighting the dominant direction.
Practical Example: AMZN is in a confirmed uptrend, trading at $240. RSI pulls back from 75 to 48 during a brief consolidation. This is the entry signal — not because the stock is oversold, but because the pullback has "reset" RSI to a neutral level, suggesting the corrective move is exhausted. Entry at $238, stop below the most recent swing low at $231, target the next resistance zone at $255.
5. Combining RSI with Momentum Indicators
MACD (Moving Average Convergence Divergence) is far more reliable in trending environments than RSI alone. It measures the relationship between two moving averages, making it inherently trend-sensitive. Using RSI alongside MACD creates a powerful filter:
- Only take RSI buy signals when MACD histogram is positive (uptrend confirmation)
- Only take RSI sell signals when MACD histogram is negative (downtrend confirmation)
- When MACD and RSI disagree, sit on your hands — the conflict signals uncertainty
6. The Stochastic RSI Alternative
Stochastic RSI applies Stochastic oscillator calculations to RSI values, making it more sensitive and better adapted to trending conditions when used correctly. It responds faster to price changes and can help identify micro-pullback entries within a trend. For a full comparison of these tools, see our article on RSI vs Stochastic Oscillator: The Essential Guide.
When RSI Does Work in Trending Markets: Hidden Divergence
Not everything about RSI is useless in trending conditions. There's one specific RSI application that actually performs better in trends than in ranges: hidden divergence.
While regular bearish divergence signals potential reversals (which are unreliable in trends), hidden bullish divergence — where price makes a higher low but RSI makes a lower low — signals trend continuation. This is a professional-level signal that most retail traders overlook. We cover it in depth in our article on Hidden RSI Divergence: The Advanced Signal Most Traders Miss.
Hidden divergence essentially tells you that despite a brief pullback in price, the underlying momentum structure remains intact — the trend is likely to continue. This is exactly the kind of signal that's valuable in a trending market, and it's something RSI can reliably provide when interpreted correctly.
Building a Complete Trending Market Framework
The traders who consistently profit from trending markets don't rely on any single indicator — they build a framework that aligns multiple confluent signals. Here's a practical structure you can implement immediately:
- Step 1 — Identify the trend: Is price above or below the 200 EMA? Are higher highs and higher lows forming (uptrend) or lower highs and lower lows (downtrend)?
- Step 2 — Measure trend strength: Check ADX. Above 25 means trend-following mode. Below 20 means range-trading mode (RSI becomes more reliable).
- Step 3 — Find your entry: Wait for a pullback to a key level — moving average support, prior breakout level, or a Fibonacci retracement zone.
- Step 4 — Confirm with RSI: In an uptrend, look for RSI to pull back to 40–55 before resuming higher. This confirms the pullback is corrective, not a trend reversal.
- Step 5 — Check for hidden divergence: If RSI shows hidden bullish divergence on the pullback, that's additional confirmation to enter long.
- Step 6 — Set your trade plan: Define stop loss (below recent swing low), take profit target (next resistance or measured move), and position size based on risk tolerance.
For traders who want professional-grade signal generation without manually running through all these steps, the Stocks365 signals dashboard aggregates multi-indicator analysis in real time, applying trend regime filters so you're always trading the right strategy for the current market environment.
When assessing individual stocks, Stocks365's trust score system combines trend strength, momentum alignment, and volume confirmation into a single actionable rating — helping you distinguish between a genuine trending opportunity and a false signal. For example, checking AAPL's current signal gives you immediate visibility into whether the stock is in a trending or ranging regime before you apply any RSI interpretation.
Practical Checklist: RSI in Trending Markets
- ✅ Always determine market regime (trending vs. ranging) before interpreting RSI signals
- ✅ Use ADX above 25 as a trigger to switch from RSI reversal mode to trend-following mode
- ✅ In strong trends, adjust RSI thresholds (80/40 in uptrends, 60/20 in downtrends)
- ✅ Use RSI pullbacks to 40–55 as trend-continuation entries in uptrends
- ✅ Watch for hidden divergence as a trend-confirmation signal
- ✅ Never short a stock solely because RSI is overbought in a strong uptrend
- ✅ Combine RSI with MACD, moving averages, and volume for high-confidence trend trades
- ❌ Don't use standard 70/30 RSI levels as hard reversal signals in trending markets
- ❌ Don't ignore the broader trend when interpreting RSI divergence
Key Takeaways
- RSI was designed for ranging markets. In trending markets, overbought/oversold signals are frequently misleading and can cause traders to fight powerful price moves.
- The core problem: In a strong trend, RSI gets "stuck" at extreme levels for extended periods — each crossing of 70 or 30 does not signal a reversal, just trend continuation.
- Use ADX as a regime filter. ADX above 25 signals a trending market where standard RSI reversal logic should be suspended.
- Reframe RSI's role in trends. Instead of using RSI for reversals, use RSI pullbacks to neutral territory (40–55 in uptrends) as trend-continuation entry signals.
- Hidden divergence is the exception. This RSI pattern actually works well in trends as a continuation signal — the opposite of standard divergence logic.
- Combine tools. RSI paired with moving averages, MACD, and ADX creates a multi-confirmation framework that dramatically reduces false signals in trending environments.
- Adjust your thresholds. In bull trends, consider using 80/40 instead of 70/30. In bear trends, use 60/20.
Frequently Asked Questions
Why does RSI give false signals in trending markets?
RSI measures the ratio of recent gains to recent losses. In a strong trend, gains consistently dominate losses, causing RSI to remain elevated for extended periods. The indicator can't distinguish between "overbought in a range" and "strongly trending upward" — both produce high RSI readings. This is why overbought signals in uptrends frequently fail to predict reversals. For a deeper understanding of how RSI generates these readings mathematically, see our guide on How RSI Is Calculated: Formula Explained Step by Step.
Should I stop using RSI altogether in trending markets?
Not necessarily. Rather than abandoning RSI, change how you use it. In trending markets, shift from using RSI as a reversal indicator to using it as a pullback entry tool. Look for RSI to pull back to neutral territory (40–55 in uptrends) as a trigger to enter in the direction of the trend. Also consider using adjusted thresholds (80/40 instead of 70/30) to better reflect trending market dynamics.
What is the best indicator to use instead of RSI in a trending market?
Moving averages (particularly the 20 and 50 EMA) and the ADX are the most effective tools in trending environments. Moving averages identify dynamic support/resistance and trend direction, while ADX quantifies trend strength. MACD is also excellent for trend-following as it's inherently momentum-based. These tools complement rather than conflict with trending price action, unlike the mean-reversion logic embedded in RSI.
How do I know if a market is trending or ranging before applying RSI?
Use ADX as your primary regime filter. An ADX reading below 20 indicates a ranging market where RSI is most reliable. Above 25 signals a trending market where you should modify your RSI approach. Additionally, visually check whether price is making consistent higher highs and higher lows (uptrend) or lower highs and lower lows (downtrend). If price is chopping within a defined horizontal range, standard RSI logic applies.
What RSI setting works best in trending markets?
Many trend traders use a shorter RSI period (such as RSI-7 or RSI-9) combined with modified thresholds (80/40 for uptrends) to better capture pullback entry points within a trend. Others use a longer period (RSI-21) to smooth out noise and reduce false signals. The optimal setting depends on your timeframe and the specific market you're trading. Our comprehensive guide on RSI Settings: Master the Best Period for Your Strategy covers this in detail with examples across different asset classes.