
لماذا يُحدث الاختبار التاريخي لاستراتيجية المتوسط المتحرك فرقًا كبيرًا
يختار أغلب المتداولين متوسطًا متحركًا، يضعونه على الرسم البياني، ثم يعتبرونه استراتيجية. بعد ذلك يخسرون المال ويلومون المؤشر. المشكلة الحقيقية؟ لم يختبروه مطلقًا.
الاختبار التاريخي لاستراتيجية المتوسط المتحرك يعني تطبيق قواعدك على بيانات أسعار تاريخية لترى ما ينجح فعلًا — قبل أن يكون رأس مالك الحقيقي على المحك. إنه يفصل بين اليقين والتخمين. وفي عام 2026، مع المنافسة الخوارزمية على كل مستوى سعري، التخمين مُكلف.
أجرت Stocks365 اختبارًا تاريخيًا على أكثر من 6,600 إشارة تقاطع للمتوسطات المتحركة عبر فئات أصول متعددة ووجدت نتائج ستفاجئ معظم المتداولين الأفراد. الميزة ليست حيث يتوقع المبتدئون — وفئة الأصول التي تختارها أهم من المعاملات المحددة التي تستخدمها. سنستعرض بالضبط ما تكشفه هذه البيانات، وكيف تُبني عملية الاختبار التاريخي الخاصة بك من الأساس.
يُبرز هذا الرسم كيف يتفاعل السعر مع الـ 20-SMA عبر دورات متعددة. لاحظ كيف أن التقاطعات الواضحة خلال مراحل الاتجاه تُنتج استمرارية، بينما التقاطعات خلال التماسك الجانبي تولّد ضوضاء. ما يؤكّد الإعداد: إغلاق فوق الـ SMA مع توسّع في الحجم. ما يُبطله: عودة السعر للإغلاق دون الـ SMA خلال شمعة أو شمعتين.
ما يعنيه الاختبار التاريخي لاستراتيجية المتوسط المتحرك فعليًا
دعنا نُعرّف هذا بدقة. الاختبار التاريخي يعني تطبيق مجموعة ثابتة من القواعد على بيانات تاريخية وقياس كل نتيجة تداول كانت لتحدث. بالنسبة لاستراتيجية المتوسط المتحرك، يعني ذلك عادةً:
- قاعدة الدخول: يتقاطع السعر فوق أو تحت متوسط متحرك (مثلًا، 20-SMA، 50-EMA)
- قاعدة الخروج: فترة احتفاظ ثابتة، تقاطع عكسي، أو وقف خسارة متحرك
- النطاق: أي أصول — الأسهم، الفوركس، الكريبتو، العقود الآجلة
- الإطار الزمني: يومي، ساعي، 15 دقيقة
- المقاييس المستهدفة: نسبة الفوز، عامل الربح، أقصى تراجع، نسبة Sharpe
كل واحد من هذه الخيارات يُغيّر النتائج بشكل كبير. هذا ما يتخطاه المبتدئون. يختبرون مزيجًا واحدًا، يرون نتيجة متوسطة، ويتخلون عن الاستراتيجية بالكامل — أو الأسوأ، يرون نتيجة قوية على سهم واحد ويفترضون أنها تعمل في كل مكان.
المقاييس التي تهم فعلًا
نسبة الفوز مُغرية لكنها مُضللة. استراتيجية بنسبة فوز 40% ونسبة عائد إلى مخاطرة 3:1 تتفوق على استراتيجية نسبة فوزها 70% ونسبتها 0.5:1 في كل مرة. ركّز على هذه المقاييس الأربعة معًا:
- نسبة الفوز: النسبة المئوية للصفقات التي تُغلق برأس مال أعلى
- عامل الربح: إجمالي الربح مقسومًا على إجمالي الخسارة — فوق 1.5 جيد، فوق 2.0 استثنائي
- أقصى تراجع: أكبر انخفاض من القمة إلى القاع في رأس المال — هذا ما يختبر نفسيتك
- القيمة المتوقعة: متوسط الدولار المكتسب أو المفقود لكل صفقة — الخلاصة الحقيقية
تجاهل أيًا من هذه وسيُضللك اختبارك التاريخي.
خطوة بخطوة: كيفية إجراء اختبار تاريخي لاستراتيجية المتوسط المتحرك
الخطوة 1 — حدّد قواعدك بدون أي غموض
القواعد المبهمة تُنتج نتائج عديمة المعنى. "اشترِ عندما يكون السعر فوق المتوسط المتحرك" ليست قاعدة. هذه قاعدة: "ادخل شراءً عند الإغلاق اليومي عندما يتقاطع السعر فوق الـ 20-SMA، بشرط أن يكون الـ 20-SMA نفسه في اتجاه صعودي على مدى الجلسات الخمس الماضية. اخرج بعد 10 أيام تداول أو عندما يُغلق السعر تحت الـ 20-SMA، أيهما أولًا."
اكتب قواعدك بلغة واضحة. ثم حوّلها إلى قائمة مرجعية. إذا لم يستطع إنسان تطبيقها بشكل متسق دون اتخاذ قرارات شخصية، فالخوارزمية بالتأكيد لن تستطيع.
الخطوة 2 — اختر مصدر بياناتك والإطار الزمني
البيانات السيئة تُنتج اختبارات سيئة. استخدم بيانات أسعار معدّلة تأخذ في الحسبان توزيعات الأرباح والتجزئة — وإلا ستُشوّه إشارات التقاطع بسبب فجوات سعرية اصطناعية. للفوركس، استخدم بيانات السبريد بين سعر الشراء والبيع إن توفرت؛ السبريد مهم جدًا في الأطر الزمنية القصيرة.
الإطار الزمني اليومي هو أفضل نقطة انطلاق لمعظم استراتيجيات المتوسط المتحرك. إنه سائل، موثّق جيدًا، ويتجنب ضوضاء البنية الدقيقة التي تُفسد الاختبارات اللحظية. بمجرد أن تتحقق من مفهوم على بيانات يومية، يمكنك استكشاف أطر زمنية أقصر بتوقعات واقعية.
الخطوة 3 — اختر نوع المتوسط المتحرك والفترة
هناك ثلاثة أنواع رئيسية تستحق الاختبار:
- المتوسط المتحرك البسيط (SMA): وزن متساوٍ لجميع الفترات. أبطأ في الاستجابة، إشارات خاطئة أقل في الأسواق الجانبية.
- المتوسط المتحرك الأسّي (EMA): وزن أكبر على الأسعار الأخيرة. إشارات أسرع، تذبذبات أكثر في الظروف المتقلبة.
- المتوسط المتحرك الموزون (WMA): ترجيح خطّي نحو البيانات الأخيرة. يقع بين SMA و EMA في الاستجابة.
للتعمّق في الجمع بين عدة متوسطات متحركة لتصفية الإشارات، يشرح استراتيجية المتوسط المتحرك الثلاثي لتأكيد الاتجاه نهجًا مُنظمًا يُقلل الضوضاء بشكل كبير مقارنةً بأنظمة المتوسط الواحد.
يُظهر هذا العرض المُزدوج كيف يستجيب EMA بشكل أسرع خلال المراحل المبكرة من حركة الاتجاه، مُولدًا دخولات مبكرة. لكن خلال مرحلة التماسك في منتصف الرسم، يُنتج EMA تقاطعين كاذبين حيث يبقى SMA نظيفًا. إشارة التأكيد: شمعة ثانية تُغلق بعد مستوى التقاطع مع حجم أعلى من متوسط الـ 20 يومًا. الإبطال: انعكاس فوري داخل جسم الشمعة السابقة.
الخطوة 4 — أجرِ الاختبار على حجم عينة كافٍ
ثلاثون صفقة ليست اختبارًا تاريخيًا. إنها رمي عملة بخطوات إضافية. تحتاج على الأقل من 200 إلى 300 إشارة لاستخلاص استنتاجات ذات معنى إحصائي — ومثاليًا 1,000 أو أكثر عبر أنظمة سوق متعددة (اتجاه صاعد، اتجاه هابط، جانبي، تقلبات عالية، تقلبات منخفضة).
هذا بالضبط لماذا تُجري لوحة أبحاثنا مسحًا منهجيًا عبر آلاف الإشارات بدلًا من أمثلة منتقاة. الأنماط التي تعمل على 50 صفقة غالبًا ما تنهار على نطاق واسع.
تحليلنا لـ 3,332 إشارة لإعداد انخفاض السعر تحت SMA 20 يُظهر نسبة فوز 50.9% مع عامل ربح 1.06 على فترة احتفاظ 10 أيام. هذه ميزة حقيقية — صغيرة، لكنها حقيقية. التفصيل حسب فئة الأصول هو حيث يصبح الأمر مثيرًا: الكريبتو حققت نسبة فوز 66.8% على نفس الإشارة، بينما الفوركس جاء عند 42.5% فقط. نفس المؤشر، نفس القاعدة، نتائج مختلفة جدًا تبعًا لمكان تطبيقها.
الخطوة 5 — حلّل النتائج وحدد ظروف الفشل
الاختبار التاريخي لا ينتهي عندما تحصل على نسبة فوز. يبدأ من هناك. تعمّق في الصفقات الخاسرة. هل تتجمع في ظروف سوق محددة؟ هل تحدث بشكل رئيسي خلال مواسم الأرباح، فترات حجم منخفض، أو أحداث إخبارية؟ هل الخسائر أكبر من المكاسب في المتوسط؟
التعرّف على الأنماط في خسائرك بنفس قيمة التعرف على الأنماط في رسمك البياني.
ما يُخطئ فيه أغلب المتداولين
يعامل معظم المتداولين تقاطع المتوسط المتحرك كاستراتيجية كاملة. ليس كذلك. التقاطع هو إشارة. الاستراتيجية هي تقاطع بالإضافة إلى سياق محدّد، بالإضافة إلى محفّز دخول، بالإضافة إلى قاعدة تحديد حجم المركز، بالإضافة إلى خطة خروج. عندما يختبر المتداولون التقاطع فقط ويرون عامل ربح متوسط 1.0 أو 1.1، يفترضون أن المتوسطات المتحركة لا تعمل. لكن بياناتنا تروي قصة أكثر تحديدًا: تقاطع SMA 20 للأسفل لديه نسبة فوز 50.9% إجمالًا — و 66.8% نسبة فوز في الكريبتو تحديدًا. الفشل ليس في المؤشر. إنه في غياب تصفية فئة الأصول.
طبّق قواعدك في كل مكان وتذوب الميزة. طبّقها حيث تقول البيانات إنها تعمل، وتتحدد الميزة بشكل كبير.
استراتيجيات المتوسط المتحرك الشائعة التي تستحق الاختبار
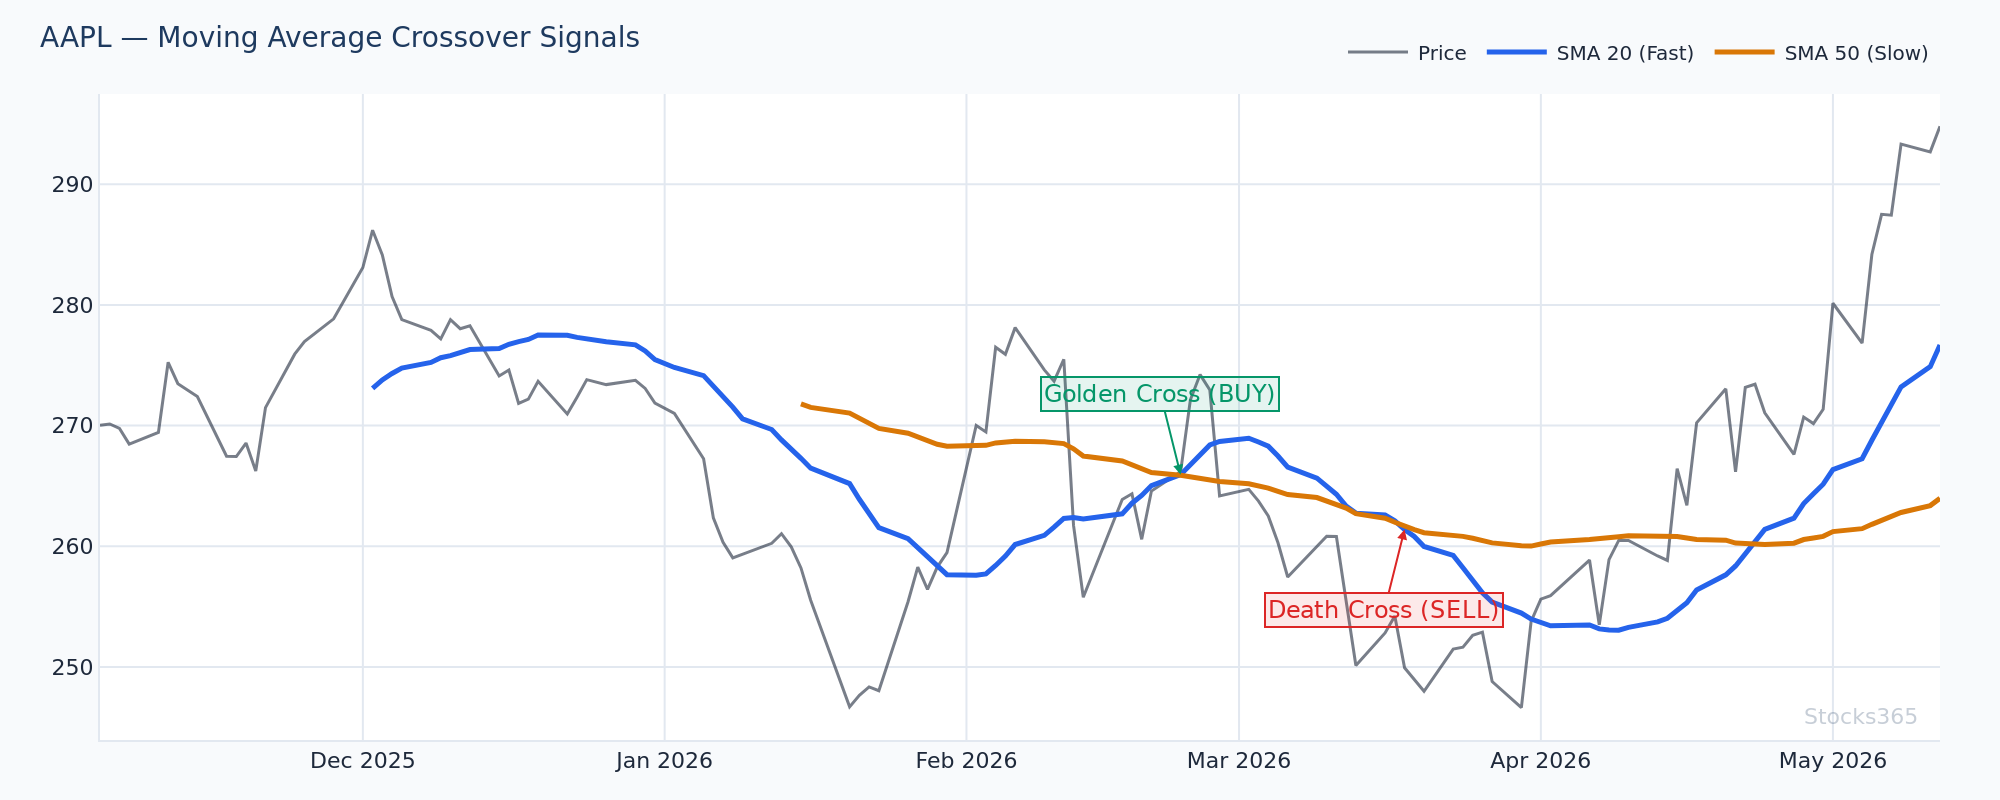
التقاطع الذهبي وتقاطع الموت
تقاطع الـ 50-SMA فوق الـ 200-SMA (التقاطع الذهبي Golden Cross) أو تحته (تقاطع الموت Death Cross) من أكثر الإشارات متابعةً في الأسواق. لأنه مُراقب على نطاق واسع، غالبًا ما يصبح نبوءة محققة ذاتيًا على المؤشرات الرئيسية. على الأسهم الفردية أو أصول كريبتو أصغر، الإشارة تميل للتأخر بشكل كبير — بحلول وقت حدوث التقاطع، يكون جزء كبير من الحركة قد حدث بالفعل.
اختبرها تاريخيًا. لا تفترض أنها تعمل لأن الإعلام المالي يغطيها.
السعر مقابل SMA منفرد كمرشّح اتجاه
من أنظف التطبيقات: استخدم الـ 20-SMA أو 50-SMA حصريًا كمرشّح اتجاه، ليس كإشارة تداول مباشرة. خذ إعدادات شراء فقط من مؤشرات أخرى عندما يكون السعر فوق الـ SMA. خذ إعدادات بيع فقط عندما يكون السعر تحته. هذا يتزاوج جيدًا مع مؤشرات الزخم — دليل RSI الشامل خطوة بخطوة يشرح بالضبط كيفية وضع إشارات RSI طبقات مع متوسطات متحركة محددة للاتجاه لدخولات أعلى احتمالية.
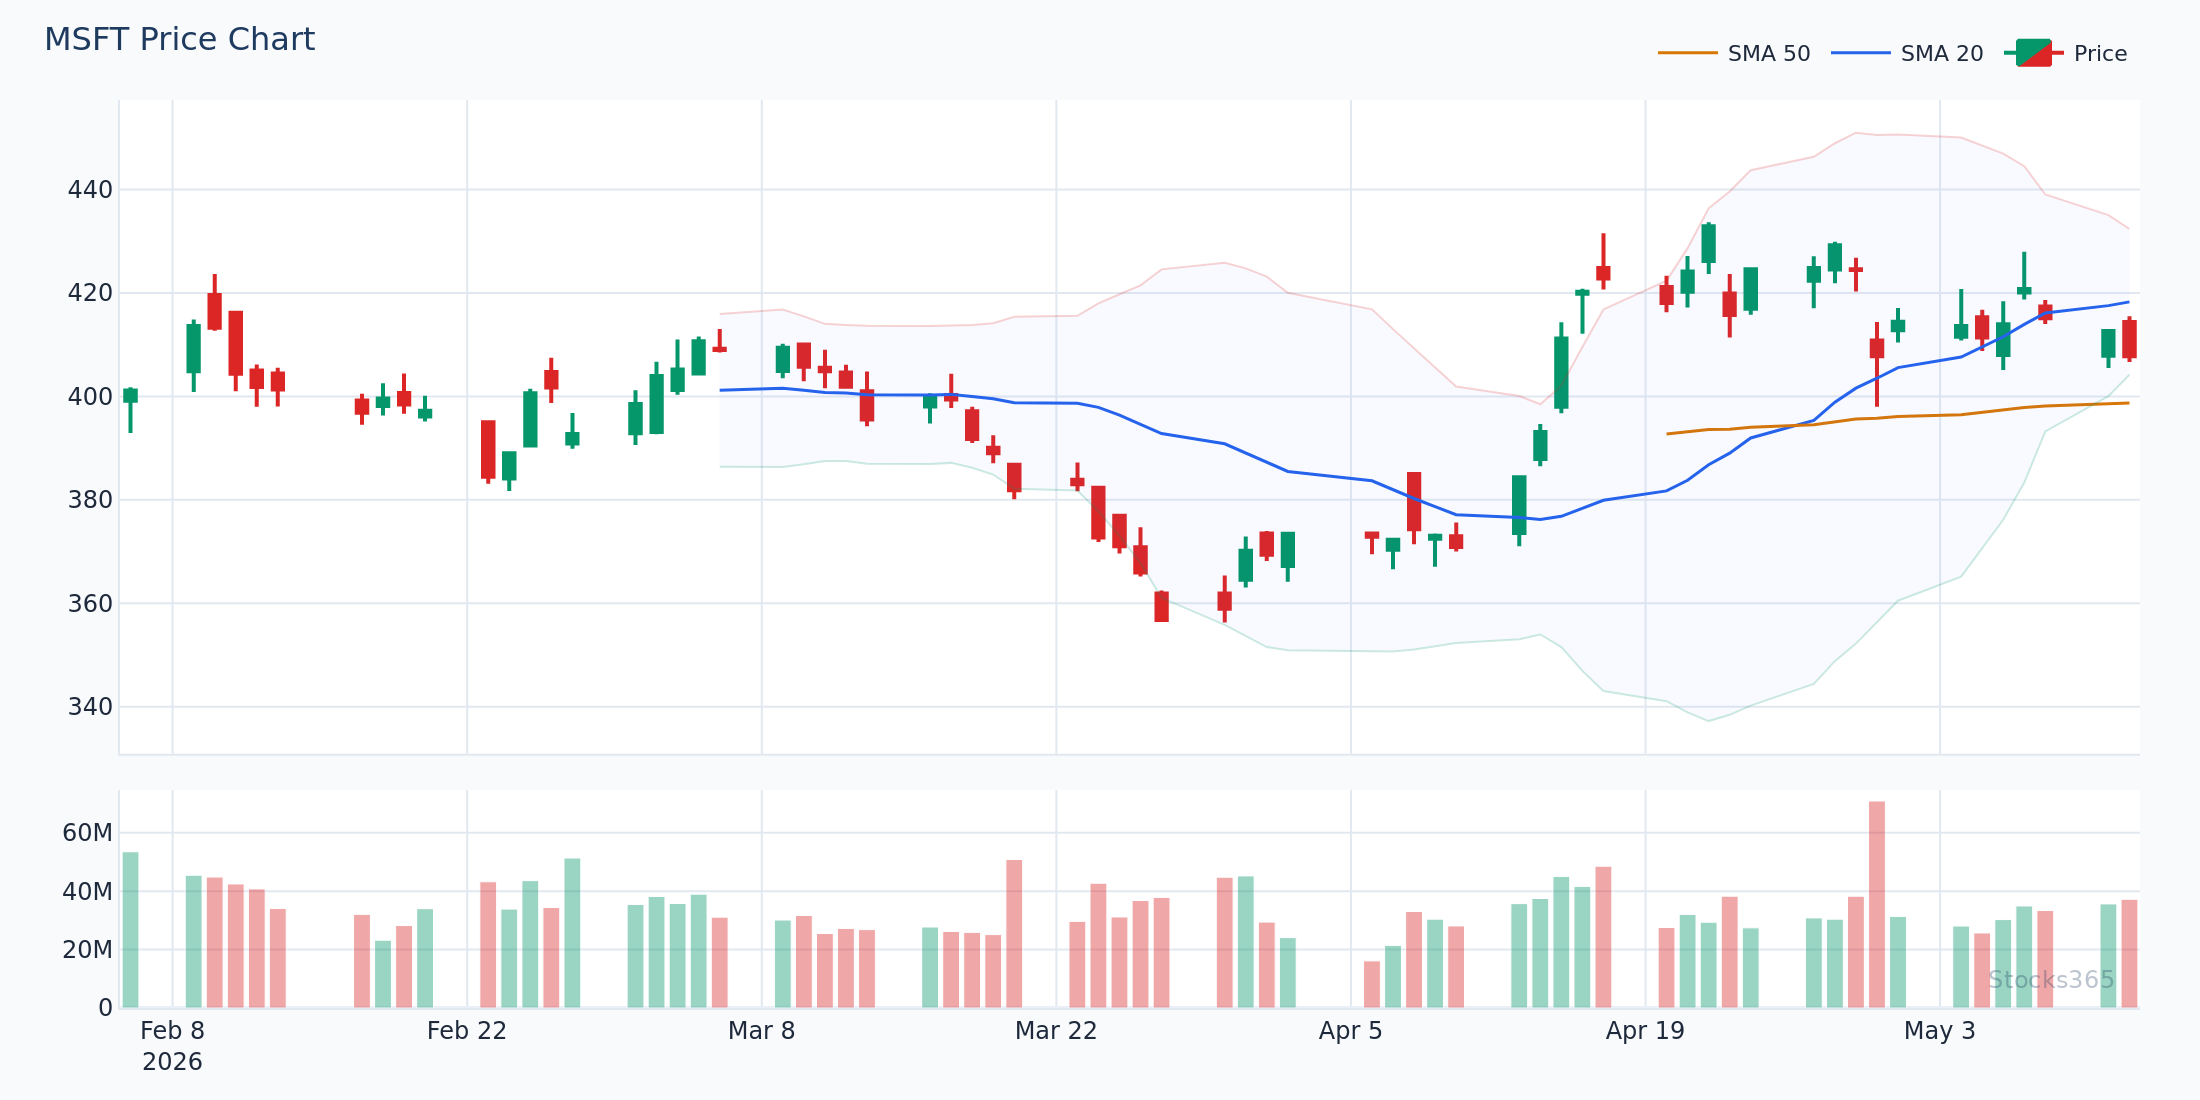
استراتيجيات نطاقات المتوسط المتحرك
النطاقات ترسم حدودًا نسبة مئوية فوق وتحت متوسط متحرك. عندما يصل السعر إلى النطاق العلوي بعد اتجاه ممتد، يمكن أن يُشير إلى مبالغة. عندما يلامس النطاق السفلي خلال اتجاه صاعد، غالبًا ما يُحدد نقطة دخول ارتداد. تعمل هذه بشكل أفضل في الأسواق ذات الاتجاه مع ميل اتجاهي واضح — في البيئات الجانبية، يتذبذب السعر بين النطاقات دون استمرارية.
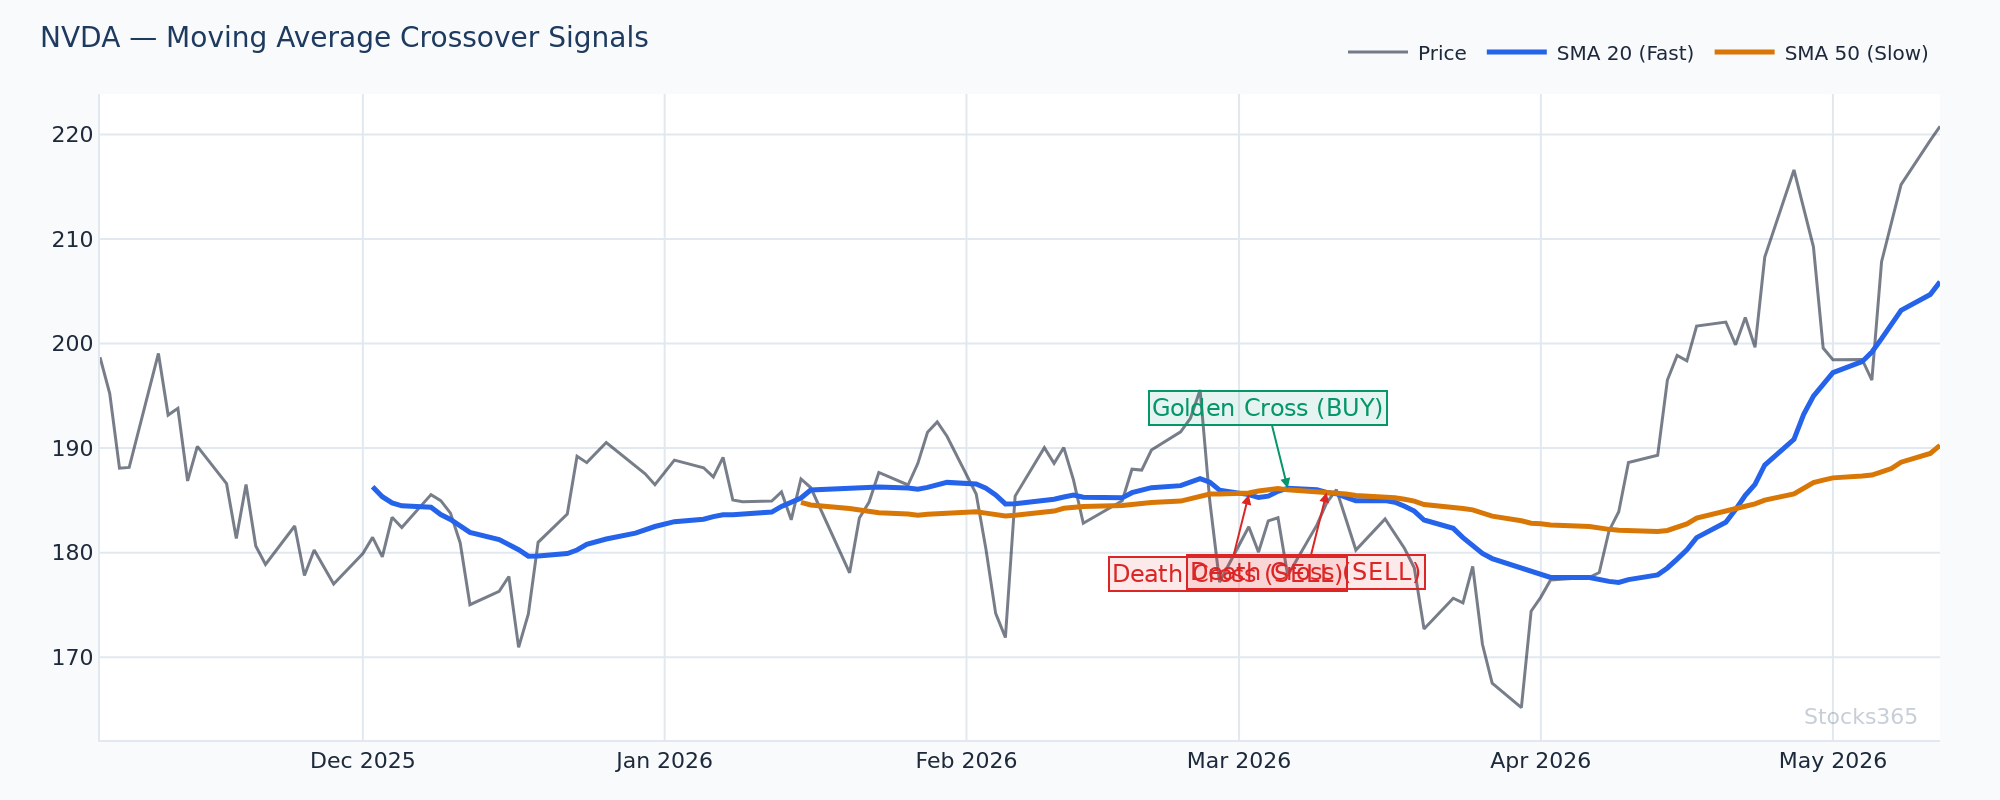
يوضح هذا الرسم كيف يتفاعل NVDA مع كل من 20-SMA و 50-SMA خلال مراحل الاتجاه. عندما ينحدر كلا المتوسطين صعودًا ويرتد السعر ليلامس الـ 20-SMA دون كسر الـ 50-SMA، تلك منطقة إعادة الدخول الطويلة الأعلى احتمالية في بيانات الاختبار. التأكيد: يرتد السعر عن الـ 20-SMA ويُغلق الشمعة التالية فوقه. الإبطال: إغلاق يومي تحت الـ 50-SMA على حجم أعلى من المتوسط.
تقاطع المتوسط المتحرك مع تأكيد الزخم
التقاطعات الخام تولّد ضوضاء. إضافة مُرشّح زخم يقطع الإشارات الخاطئة بشكل كبير. النهج: اطلب أن يكون مدرّج MACD إيجابيًا (أو يتحول إيجابيًا) في وقت تقاطع SMA صعودي قبل الدخول. لمتداولي الفوركس تحديدًا، MACD في تداول الفوركس يُفصّل كيف تؤدي طبقة التأكيد هذه عبر أزواج العملات الرئيسية — النتائج تختلف بشكل ملحوظ عن الأسهم.
التحسين دون الإفراط في التخصيص
هذا الفخ يُدمر اختبارات تاريخية أكثر من أي خطأ آخر. التناسب المُنحني — ضبط المعاملات حتى تبدو النتائج التاريخية مثالية — يُنتج استراتيجيات تفشل فورًا على البيانات المباشرة. الاختبار التاريخي يبدو رائعًا. الحساب الحقيقي ينزف.
تمنع هاتان الانضباطتان هذا:
- الاختبار خارج العينة: اختبر تاريخيًا على 70% من بياناتك. اختبر المعاملات "المُحسّنة" على الـ 30% المتبقية دون لمسها. إذا انهار الأداء، فقد أفرطت في التخصيص.
- التحليل المُتدحرج للأمام: دحرج نافذة التحسين للأمام عبر الزمن، معيدًا التحسين دوريًا. هذا يحاكي كيف تتدهور الاستراتيجية الحقيقية وتتطلب صيانة.
الاستراتيجيات القوية تُظهر نتائج متسقة (وإن كانت غير مثالية) عبر فترات مختلفة وفئات أصول مختلفة. الاستراتيجيات الهشة تبدو مثالية على البيانات التي دُربت عليها وليس في مكان آخر.
دور حالة السوق في أداء المتوسط المتحرك
المتوسطات المتحركة أدوات متابعة اتجاه. مصممة للأداء في الأسواق ذات الاتجاه ومصممة للمعاناة في الأسواق الجانبية. هذا ليس عيبًا — إنه فيزياء. أداة محسّنة لحالة واحدة ستؤدي أقل في حالة أخرى.
التطبيق العملي: حدد حالة السوق الحالية قبل نشر استراتيجية متوسط متحرك. مرشحات الحالة المبنية على التقلب (مثل VIX للأسهم، أو ترتيب النسبة المئوية لـ ATR) تساعد في تحديد ما إذا كانت الظروف تُفضّل نهج متابعة الاتجاه أو العودة للمتوسط. عندما يكون ATR في الربع السفلي من نطاقه التاريخي، تقاطعات المتوسط المتحرك تُنتج إشارات خاطئة أكثر بكثير.
لمنظور حول كيف يساعد تباعد RSI في تحديد تحولات الحالة قبل أن تكون واضحة في السعر، تباعد RSI الخفي يستحق القراءة بجانب عمل الاختبار التاريخي للمتوسط المتحرك.
أدوات الاختبار التاريخي المتاحة في 2026
الأخبار الجيدة: الاختبار التاريخي أكثر إتاحة من أي وقت مضى. الأخبار السيئة: الأدوات السهلة تجعل من السهل الحصول على إجابات خاطئة تبدو مقنعة.
- Python مع pandas/backtrader/vectorbt: سيطرة كاملة، يتطلب معرفة برمجية، يتعامل مع مجموعات بيانات كبيرة بكفاءة
- TradingView Pine Script: تكرار سريع، جيد للاستراتيجيات المبنية على قواعد، تحليل محدود على مستوى المحفظة
- منصات متخصصة (Amibroker, TradeStation, QuantConnect): درجة احترافية، محاكاة تنفيذ واقعية، تحسين متدحرج مدمج
- تتبع إشارات Stocks365: توفر لوحة إشارات Stocks365 بيانات أداء إشارات في الوقت الفعلي تُكمّل اختبارك التاريخي، مُظهرة كيف تؤدي الإشارات عبر ظروف سوق حية — ليس محاكيات تاريخية فقط
اختر أداتك بناءً على ما ستستخدمه فعلًا باستمرار. أفضل أداة اختبار تاريخي هي التي لا تجمع الغبار.
دمج الاختبار التاريخي في عملية تداول كاملة
الاختبار التاريخي هو بداية تطوير الاستراتيجية، ليس النهاية. بعد اختبار تاريخي قوي، العملية تستمر:
- التداول الورقي: التحقق من الاستراتيجية في ظروف الوقت الفعلي دون مخاطرة مالية لعلى الأقل 30 إشارة
- اختبار حي صغير: نشر أحجام مراكز دنيا لتجربة التنفيذ، الانزلاق السعري، والنفسية في ظروف حقيقية
- مراقبة الأداء: تتبع النتائج الحية مقابل توقعات الاختبار التاريخي — الانحراف الكبير يُشير إما لتغيير الحالة أو أخطاء التنفيذ
- إعادة التقييم الدورية: الأسواق تتطور. استراتيجية متوسط متحرك عملت على أصل محدد لثلاث سنوات قد تتوقف عن العمل مع تغير بنية السوق
للمتداولين الذين يبنون عدة أدوات تقنية كاملة حول المتوسطات المتحركة، فهم كيف تُحسب مؤشرات تكميلية مثل RSI من الأساس يُقوي قدرتك على دمجها بذكاء. صيغة RSI مشروحة توفر ذلك الأساس. بالمثل، تحسين إعدادات RSI يعكس نفس انضباط اختيار المعامل الذي تطبقه عند اختيار فترات المتوسط المتحرك.
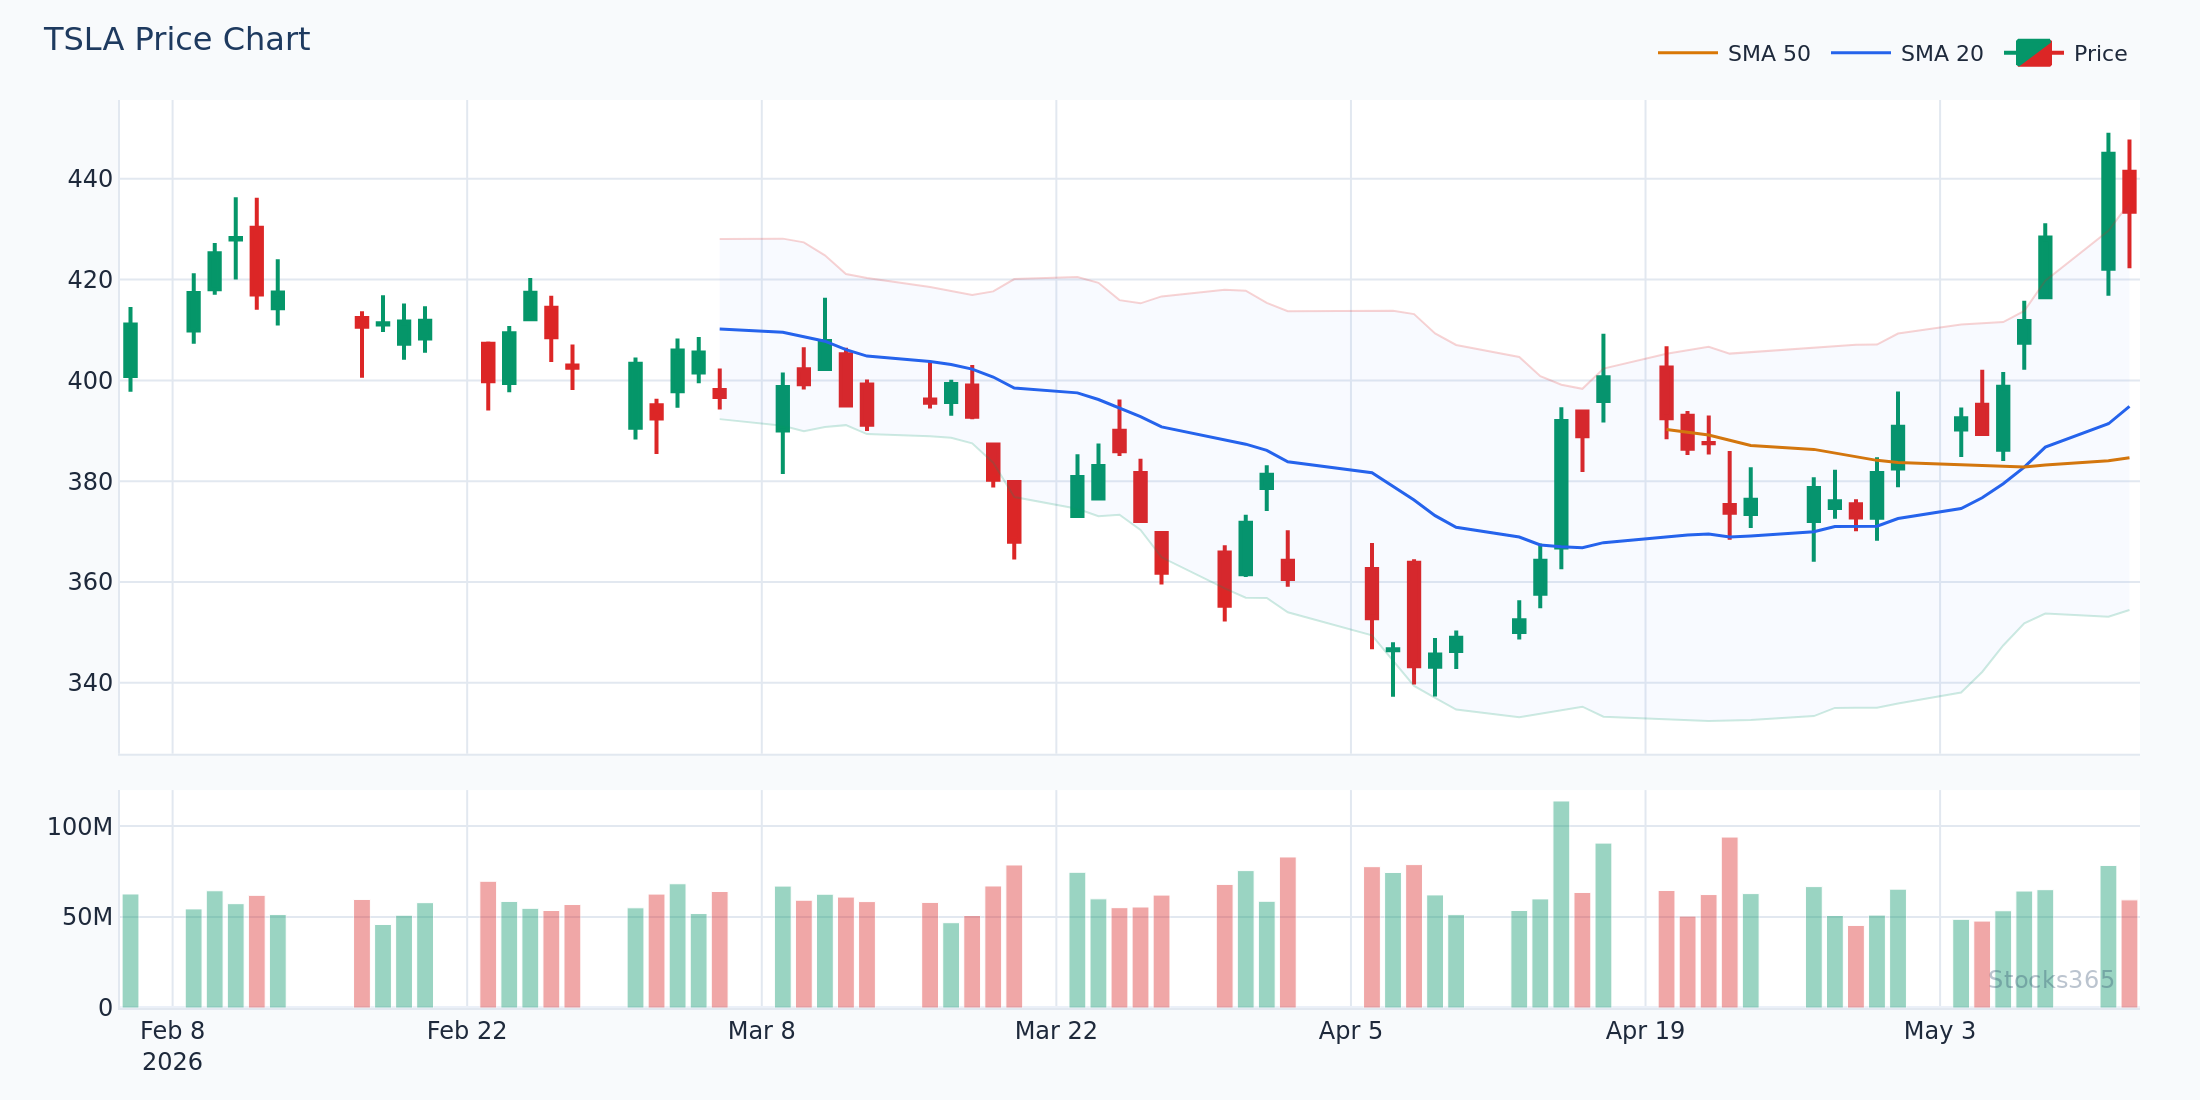
يرسم هذا الرسم سعر TSLA عبر مراحل اتجاه وجانبية مميزة، مع وضع علامات على نقاط دخول تقاطع 20-SMA. تجميع الإشارات المربحة في المراحل ذات الاتجاه الواضح (يمكن تحديدها من خلال ميل SMA المستمر والسعر الذي يبقى باستمرار فوق أو تحت الخط) مقابل الإشارات الخاسرة خلال الفترات المضطربة الوسطى يوضح اعتماد هذا النوع من الاستراتيجيات على الحالة. الاستنتاج: تحديد الحالة قبل الدخول، وليس بعده، هو ما يفصل بين اختبار تاريخي يعمل نظريًا واستراتيجية تعمل عمليًا.
ما يجب مراقبته
- راقب عودة السعر للسيطرة على الـ 20-SMA بعد اتجاه هبوطي متعدد الأسابيع في أصول الكريبتو — بيانات اختبارنا التاريخي تُظهر أن هذا الإعداد يُنتج نسبة فوز 66.8% على أساس مستقبلي 10 أيام، متفوقًا بشكل كبير على نفس الإشارة المطبقة على أزواج الفوركس حيث تنخفض نسبة الفوز إلى 42.5%.
- راقب محاذاة اتجاه ميل SMA عبر أطر زمنية متعددة — عندما ينحدر 20-SMA على اليومي و 50-SMA على الأسبوعي في نفس الاتجاه، أظهرت إشارات تقاطع المتوسط المتحرك على اليومي معدلات استمرارية أعلى تاريخيًا مقارنةً بحالة الأطر الزمنية المتعارضة.
- راقب تقاطعات المتوسط المتحرك التي تحدث مع توسع حجم بمقدار 1.5 ضعفًا أو أكثر من متوسط الـ 20 يومًا — التقاطعات على حجم أقل من المتوسط تُنتج نصيبًا غير متناسب من الاختراقات الكاذبة في الاختبارات التاريخية عبر الأسهم والكريبتو.
- راقب ضغط الـ 20-SMA والـ 50-SMA (تضييق الفجوة بينهما) — نمط الانضغاط هذا غالبًا ما يسبق حركة اتجاهية متسارعة، والتقاطع اللاحق يميل لتوليد استمرارية أقوى من تقاطع خلال فترة انفصال واسع بالفعل بين المتوسطات.
- راقب إشارات تقاطع المتوسط المتحرك التي تتماشى مع كسر خطوط اتجاه RSI — استراتيجية خط اتجاه RSI تُحدد كيف أن الجمع بين هاتين الإشارتين يُقلل الإيجابيات الكاذبة بشكل كبير مقارنةً بأي إشارة تُستخدم بمفردها.
كيف تستخدم Stocks365 هذا
كيف تُدمج Stocks365 تحليل المتوسط المتحرك في نظام درجة الثقة
موضع المتوسط المتحرك هو أحد 12+ عاملًا تقنيًا يُغذي درجة الثقة في Stocks365 لكل إشارة على المنصة. تحديدًا، يساهم مكوّن المتوسط المتحرك في درجة حالة الاتجاه — مؤشر فرعي يُقيّم ما إذا كان أصل معين في حالة اتجاه أو عودة للمتوسط في وقت ظهور الإشارة.
عندما تظهر إشارة على AAPL أو أي أصل آخر متابَع على لوحة الإشارات، تعكس درجة الثقة ما إذا كان السعر فوق أو تحت المتوسطات المتحركة الرئيسية، وما إذا كانت تلك المتوسطات تنحدر في اتجاه الصفقة، وما إذا كانت محاذاة المتوسط المتحرك على أطر زمنية متعددة تدعم أو تتعارض مع اتجاه الإشارة. إشارة تُطلق مع محاذاة متوسط متحرك كاملة عبر الأطر الزمنية تحصل على مساهمة حالة أعلى في درجة الثقة من نفس الإشارة التي تُطلق في بيئة مضطربة ومتعارضة مع المتوسط المتحرك.
اختبرت Stocks365 تاريخيًا 3,332 إعداد انخفاض السعر تحت SMA 20 ووجدت نسبة فوز 50.9% إجمالًا — لكن هذا الرقم الإجمالي يخفي تباين فئة أصول كبيرًا. يستخدم نظام درجة الثقة هذا النوع من بيانات الأداء المشروط لوزن الإشارات بشكل مختلف بناءً على نوع الأصل وحالة السوق الحالية، مانحًا المتداولين مرشحًا أذكى من مجرد عدد الإشارات وحده.
الخلاصة الرئيسية
ملخص: الاختبار التاريخي لاستراتيجيات المتوسط المتحرك
- الاختبار التاريخي يُحوّل المتوسط المتحرك من أداة بصرية إلى ميزة مُثبتة — أو يكشف أنه لا يملك ميزة في سياقك المحدد
- نسبة الفوز وحدها عديمة المعنى؛ عامل الربح وأقصى تراجع والقيمة المتوقعة معًا تروي القصة الحقيقية
- اختيار فئة الأصول أهم من تحسين المعاملات: نفس تقاطع SMA 20 يُنتج نسبة فوز 66.8% في الكريبتو و 42.5% في الفوركس في بيانات Stocks365 المُختبرة
- الإفراط في التخصيص هو القاتل الصامت للاختبارات التاريخية — تحقق دائمًا على بيانات خارج العينة قبل الثقة بأي نتيجة
- حالة السوق تُحدد ما إذا كانت استراتيجية المتوسط المتحرك ستزدهر أم تعاني؛ حدد الحالة أولًا
- الاختبار التاريخي نقطة البداية، ليس خط النهاية — التداول الورقي والاختبار الحي الصغير يُكمل عملية التحقق
- الجمع بين إشارات المتوسط المتحرك مع مؤشرات الزخم مثل RSI أو MACD يُقلل الإشارات الخاطئة باستمرار في البيانات المُختبرة