
What Is a Bollinger Band Breakout — and Why Does It Matter?
Every serious trader knows the frustration of missing a massive move. Price consolidates for days, volume dries up, and then — out of nowhere — a stock explodes 15% in a single session. The Bollinger Band breakout strategy exists specifically to help you identify these moments before they happen, not after.
Developed by legendary technical analyst John Bollinger in the 1980s, Bollinger Bands have stood the test of time precisely because they adapt to market conditions. Unlike fixed-range indicators, the bands dynamically expand and contract based on volatility — making them one of the most powerful tools available for detecting high-probability breakout setups.
In this comprehensive guide, you'll learn exactly how the Bollinger Band breakout strategy works, how to filter signals to avoid false breakouts, and how to structure entries, stops, and targets like a professional trader.
Understanding Bollinger Bands: The Foundation of the Strategy
Before you can trade breakouts effectively, you need to understand what Bollinger Bands are actually measuring. The indicator consists of three lines plotted around a price chart:
- Middle Band: A 20-period simple moving average (SMA) of closing prices
- Upper Band: Middle band + 2 standard deviations
- Lower Band: Middle band − 2 standard deviations
The standard deviation calculation is what makes Bollinger Bands dynamic. When volatility increases, the bands widen. When volatility decreases, the bands narrow. Statistically, approximately 95% of all price action occurs within the bands under normal conditions — which means when price breaks decisively outside them, something significant is happening.
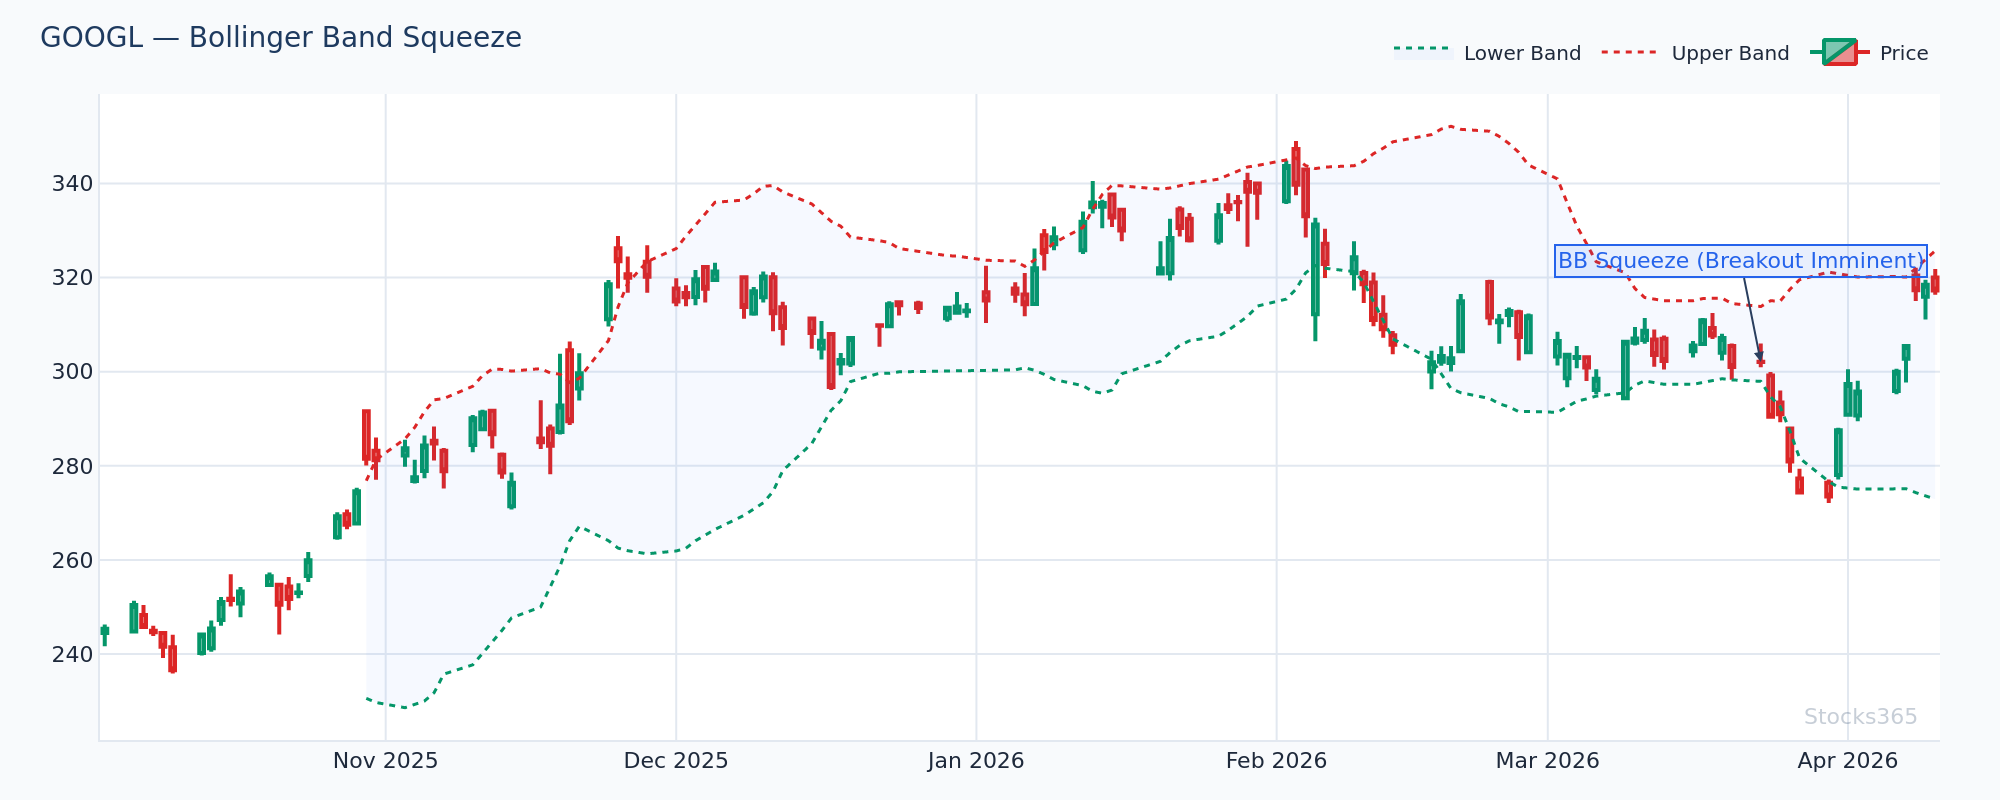
The Squeeze: Where Breakouts Are Born
The most powerful Bollinger Band breakout setups begin with what traders call a Bollinger Band squeeze. A squeeze occurs when the upper and lower bands converge unusually close together, indicating that volatility has compressed to abnormally low levels.
Think of it like a coiled spring. The longer price consolidates within a narrow range, the more energy builds up — and the more explosive the eventual breakout tends to be. John Bollinger himself described the squeeze as "the calm before the storm," and decades of market data support this characterization.
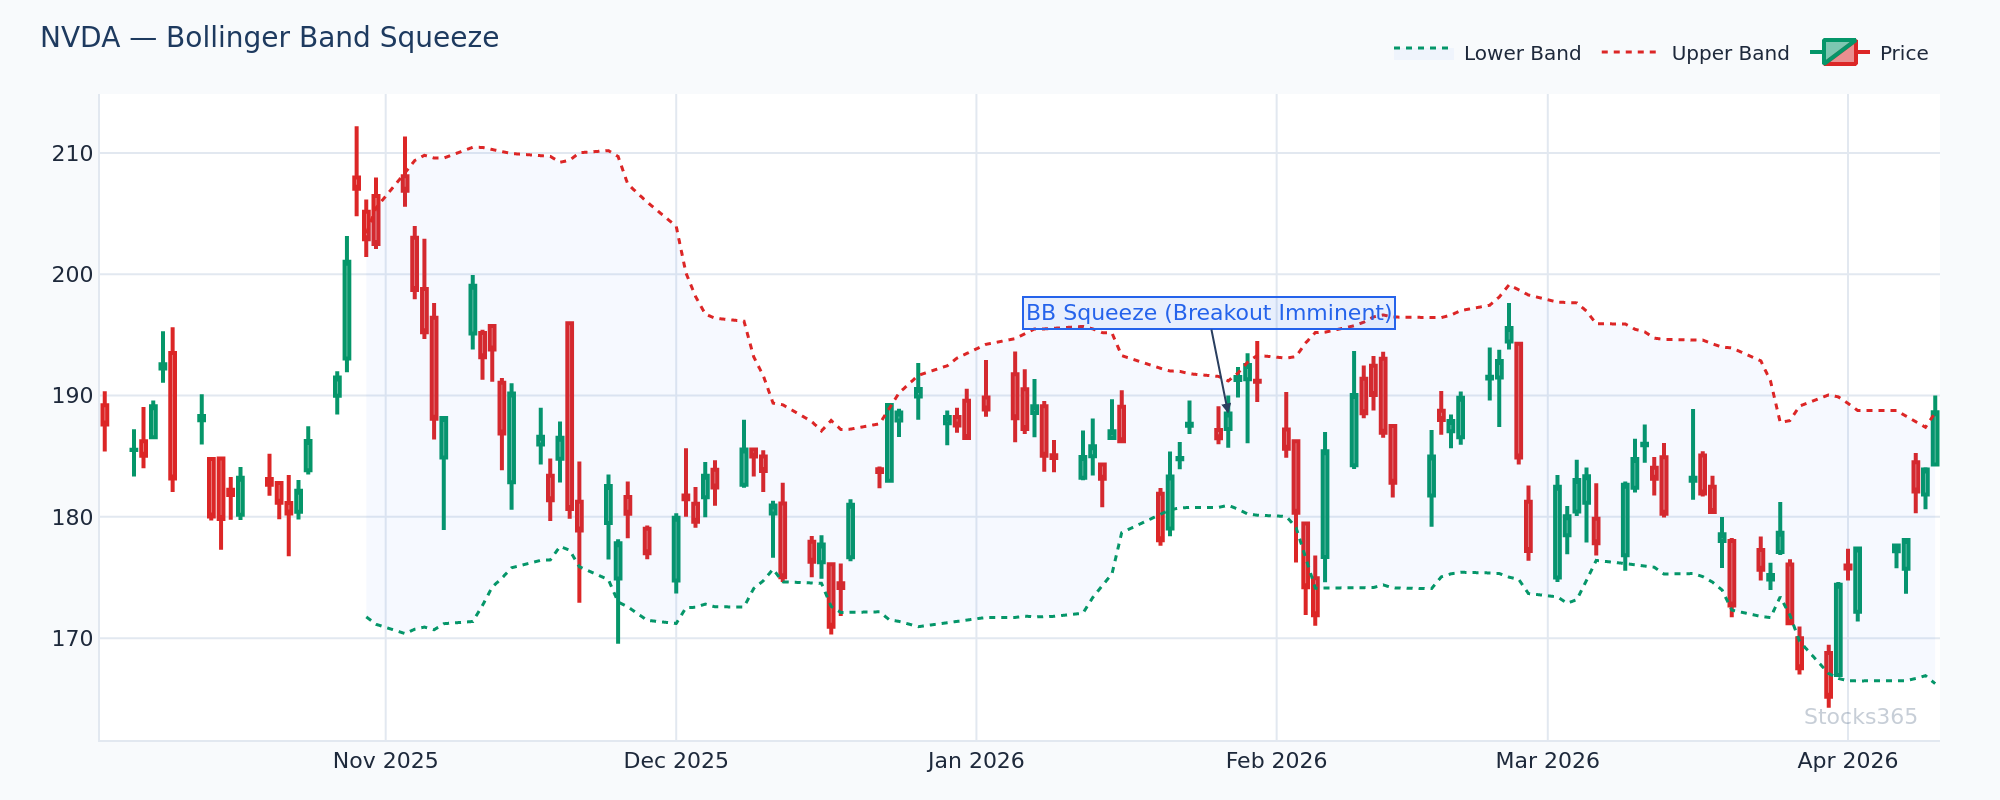
The Bollinger Band Width indicator (calculated as (Upper Band − Lower Band) / Middle Band) can help you quantify squeezes objectively. When bandwidth drops to its lowest reading in 6 months or more, you're looking at prime breakout territory.
The Core Bollinger Band Breakout Strategy: Step-by-Step Rules
There are two primary breakout scenarios to trade: the upper band breakout (bullish) and the lower band breakout (bearish). Here's how to approach each systematically.
Bullish Bollinger Band Breakout Setup
A high-quality bullish breakout setup requires several conditions to align:
- Step 1 — Identify a squeeze: The bands must have been contracting for at least 10-15 candles (sessions). The tighter and longer the compression, the better.
- Step 2 — Watch for the breakout candle: Price closes above the upper Bollinger Band on a strong, full-bodied candle — not a wick. Wicks touching the upper band are not breakouts.
- Step 3 — Confirm with volume: Breakout volume should be at least 150% of the 20-period average volume. No volume confirmation = high false-breakout risk.
- Step 4 — Check the middle band slope: The 20-period SMA should be turning upward or already rising. A flat or declining middle band during an apparent breakout is a warning sign.
- Step 5 — Enter on confirmation: Enter on the close of the breakout candle or on the open of the next session if you're risk-averse.
Setting Stops and Profit Targets
Risk management is where most retail traders fail on breakout strategies. Here's a professional framework:
- Stop Loss: Place your stop below the low of the breakout candle, or below the middle band (20-period SMA) — whichever gives you a tighter logical level. Never risk more than 1-2% of capital on any single trade.
- Profit Target 1 (Conservative): The width of the Bollinger Bands at the time of breakout, projected from the entry point. If the bands are $8 wide when you enter at $150, your first target is $158.
- Profit Target 2 (Aggressive): Measure the height of the prior consolidation range and project it from the breakout level — the classic measured move.
- Trailing Stop: Once price reaches Target 1, trail your stop to breakeven and let the position run toward Target 2.
Real Trading Examples with Specific Price Levels
Example 1: NVDA Squeeze and Breakout
Consider a scenario common in early 2026 AI-driven momentum stocks. Imagine NVDA trading between $890 and $920 for 18 sessions. The Bollinger Bands compress to a width of just $22 — the narrowest in six months. Then, on a Tuesday session with volume running at 210% of average, NVDA closes at $934, decisively above the upper band at $928.
A trader applying the Bollinger Band breakout strategy would:
- Enter at the close: $934
- Set stop below breakout candle low: $918 (risk: $16 per share)
- Target 1 (band width projection): $956 ($934 + $22)
- Target 2 (measured move from $890 consolidation base): $964
The risk-to-reward ratio on this trade is approximately 1:1.4 to Target 1 and 1:1.9 to Target 2 — both acceptable for a momentum breakout setup.
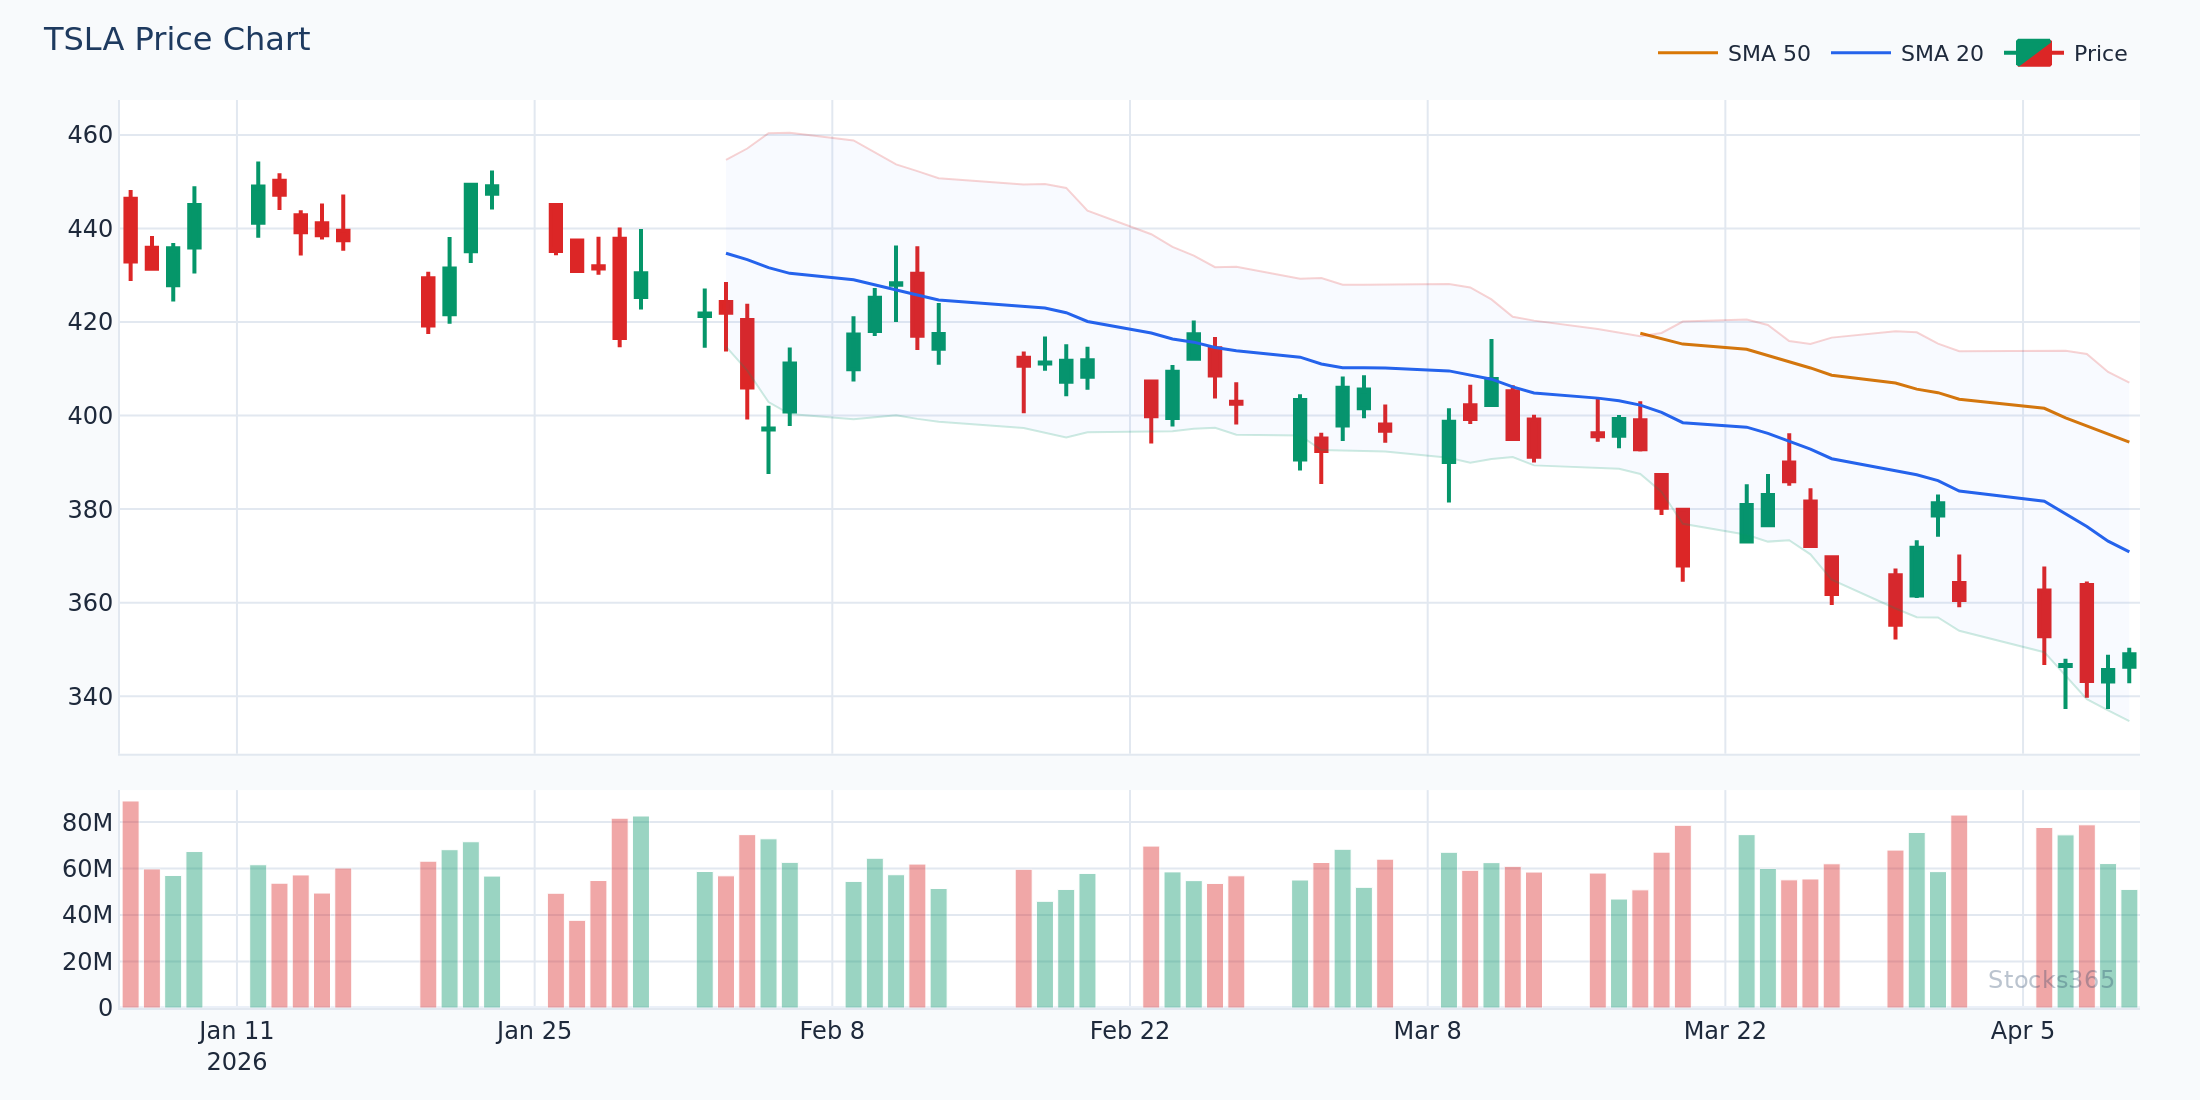
Example 2: TSLA Bearish Breakdown
Bollinger Band breakouts work equally well to the downside. Picture TSLA consolidating between $310 and $325 for 14 sessions with declining volume. The bands have compressed to a width of $18. Then TSLA gaps down on earnings guidance, closing at $304 — below the lower band at $308 — on 3x average volume.
A bearish breakdown trade would look like:
- Short entry: $304
- Stop above breakout candle high: $312 (risk: $8 per share)
- Target 1: $286 ($304 − $18 band width)
- Target 2 (measured move): $279
Filtering False Breakouts: The Most Critical Skill
The biggest weakness of any Bollinger Band breakout strategy is false breakouts — situations where price briefly closes outside the band, sucks in breakout traders, then reverses sharply. Here's how professional traders filter the noise:
Use RSI to Confirm Momentum
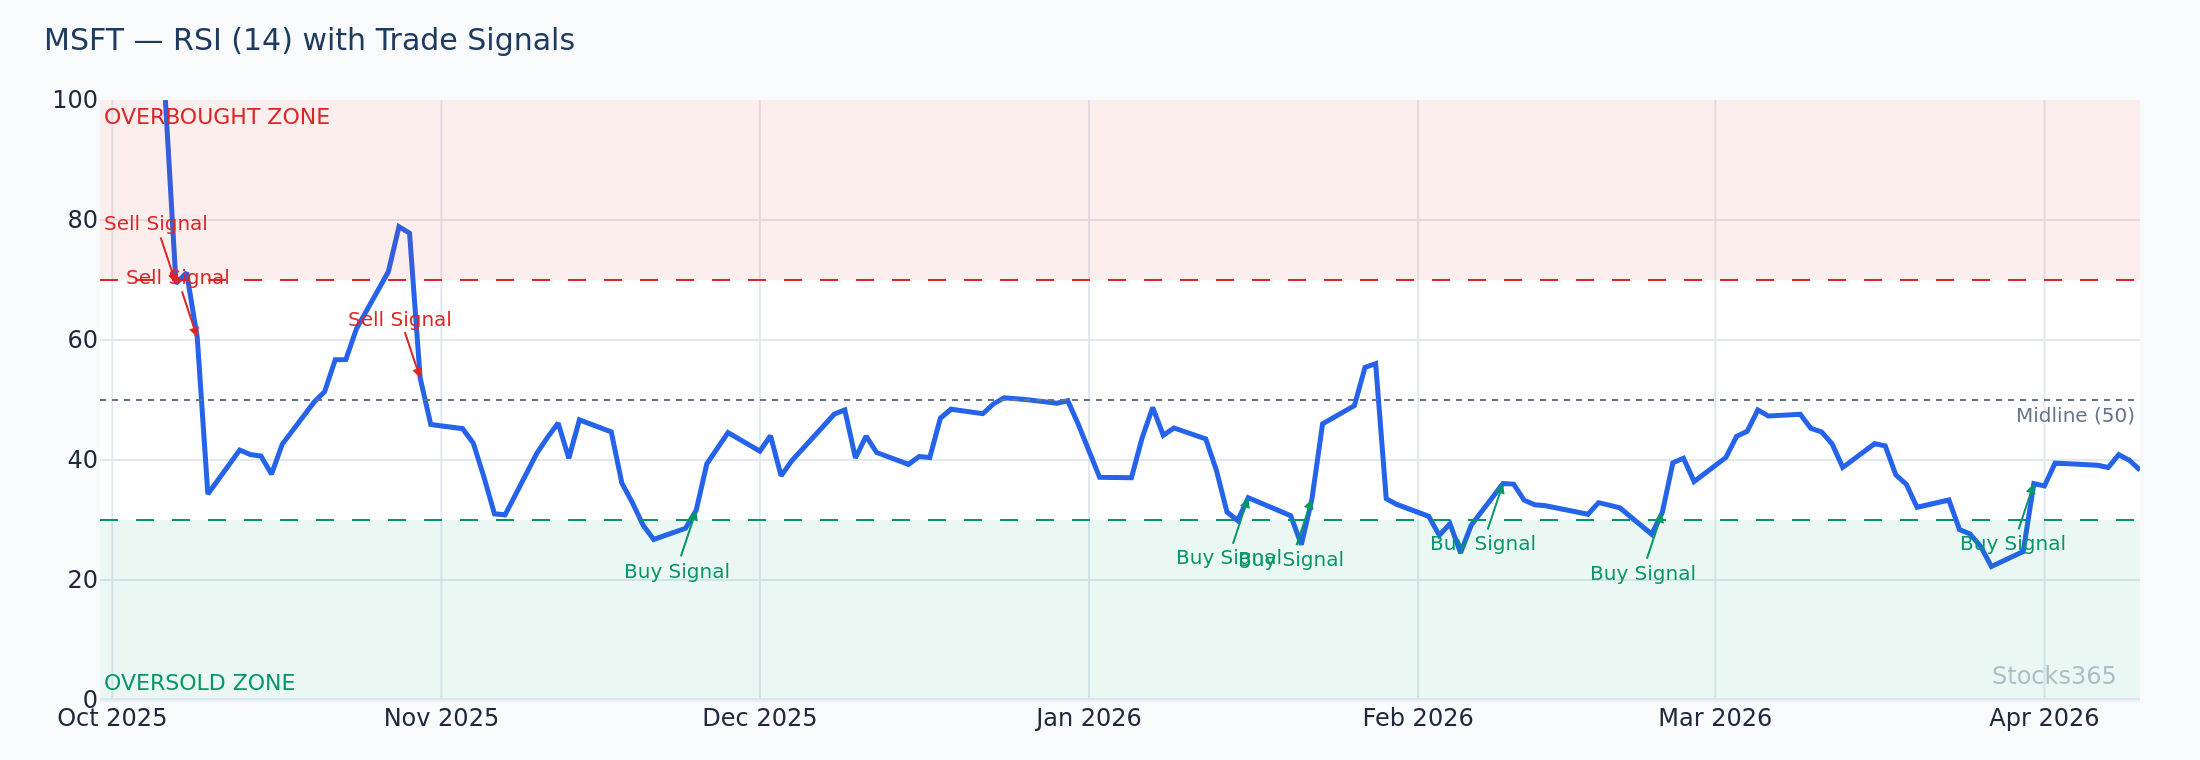
Pairing Bollinger Band breakouts with the Relative Strength Index (RSI) dramatically improves signal quality. For a valid bullish breakout, RSI should be above 50 and ideally trending toward 60-70 at the time of the breakout — not already overbought above 80. For bearish breakdowns, RSI should be below 50 and falling.
If you're not already familiar with RSI mechanics, our guide on how to use RSI in trading covers everything from basic interpretation to advanced applications. Understanding the right RSI settings is equally important — our article on RSI settings and optimal periods will help you calibrate the indicator for your specific timeframe.
One advanced technique: look for RSI making a new high alongside the Bollinger Band breakout. This confirms that momentum is expanding — the hallmark of a genuine breakout rather than a fakeout. Our resource on RSI divergence signals explains the inverse scenario (divergence) that often precedes false breakouts.
Require a Volume Surge
We cannot overstate this: volume is the single most reliable filter for Bollinger Band breakouts. A breakout on average or below-average volume has a dramatically higher failure rate. Many professional traders won't take a breakout trade unless volume is at least 2x the 20-period average on the breakout candle itself.
Check the Broader Market Context
Even the cleanest individual stock breakout has lower odds of success if the broader market (S&P 500, NASDAQ) is in a downtrend or experiencing elevated volatility. Always assess the macro environment. A Bollinger Band breakout on MSFT has higher probability on a day when the S&P 500 is trending upward than on a day of broad market weakness.
Avoid Breakouts Into Overhead Resistance
Before entering any breakout, scroll back on your chart to identify major resistance levels — prior highs, gap fills, and round numbers. A breakout that runs directly into a wall of resistance is far more likely to fail. The cleanest setups occur when the breakout launches into clear air above with no nearby resistance for at least 3-5% higher.
Advanced Bollinger Band Breakout Techniques
The "Band Walk" — Riding Extended Trends
In strongly trending markets, price can "walk" along the upper or lower Bollinger Band for extended periods — closing above the upper band session after session. This is not a sign of overbought conditions; it's actually a sign of extraordinary strength. The correct response to a band walk is to hold your breakout position and trail your stop along the middle band (20-period SMA).
Many traders prematurely exit breakout trades because price appears "too extended" above the upper band. In reality, stocks that walk the band during strong uptrends often continue that behavior for weeks. Patience and a proper trailing stop methodology are essential.
Multi-Timeframe Bollinger Band Breakout Analysis
Professional traders don't rely on a single timeframe. A high-conviction Bollinger Band breakout setup ideally aligns across multiple timeframes:
- Weekly chart: Confirms the broader trend direction and major squeeze
- Daily chart: Primary timeframe for entry signals
- 4-hour or 1-hour chart: Used for precise entry timing and tighter stop placement
When a squeeze and breakout appear simultaneously on both the weekly and daily chart, the probability of a sustained, significant move increases substantially. These multi-timeframe confluences are the setups worth allocating larger position sizes to.
Combining Bollinger Bands with Stochastic Oscillator
Another powerful combination is Bollinger Bands paired with the Stochastic Oscillator. When a breakout occurs and the Stochastic is rising from oversold territory (below 20) toward overbought levels, it adds a compelling momentum confirmation layer. For a detailed comparison of momentum oscillators, see our guide on RSI vs Stochastic Oscillator.
Common Mistakes Traders Make with Bollinger Band Breakouts
Even experienced traders make these errors when applying the Bollinger Band breakout strategy. Understanding them now can save you significant capital:
- Chasing breakouts: Entering long after the breakout candle has already moved 3-5% dramatically worsens your risk-to-reward ratio. Wait for pullbacks to the upper band (now acting as support) if you miss the initial entry.
- Ignoring context: Trading every band touch or close outside the band regardless of the broader setup. Not every upper band close is a breakout — require the squeeze setup first.
- Misidentifying squeezes: A "squeeze" that has only lasted 3-4 candles is too short. Require at least 10 candles of compression for meaningful energy buildup.
- Oversizing positions: Breakout trades inherently carry higher volatility. Size positions conservatively — 1-2% risk per trade maximum — because even valid setups fail 30-40% of the time.
- Ignoring divergence warnings: If RSI is making lower highs while price consolidates before an apparent breakout, that hidden divergence is a serious warning sign. Learn more about hidden RSI divergence signals to avoid this trap.
Using Stocks365 to Find Bollinger Band Breakout Setups
Manually scanning hundreds of stocks for Bollinger Band squeeze and breakout conditions is time-consuming and inconsistent. Stocks365's signals dashboard automates this process, continuously scanning the market for technically significant setups — including Bollinger Band breakout conditions — and ranking them by the platform's proprietary Trust Score system.
The Trust Score evaluates each signal across multiple technical dimensions simultaneously: momentum quality, volume confirmation, trend alignment, and historical pattern reliability. A high Trust Score on a Bollinger Band breakout signal indicates that multiple confirmation factors are aligned — not just that price happened to close outside a band.
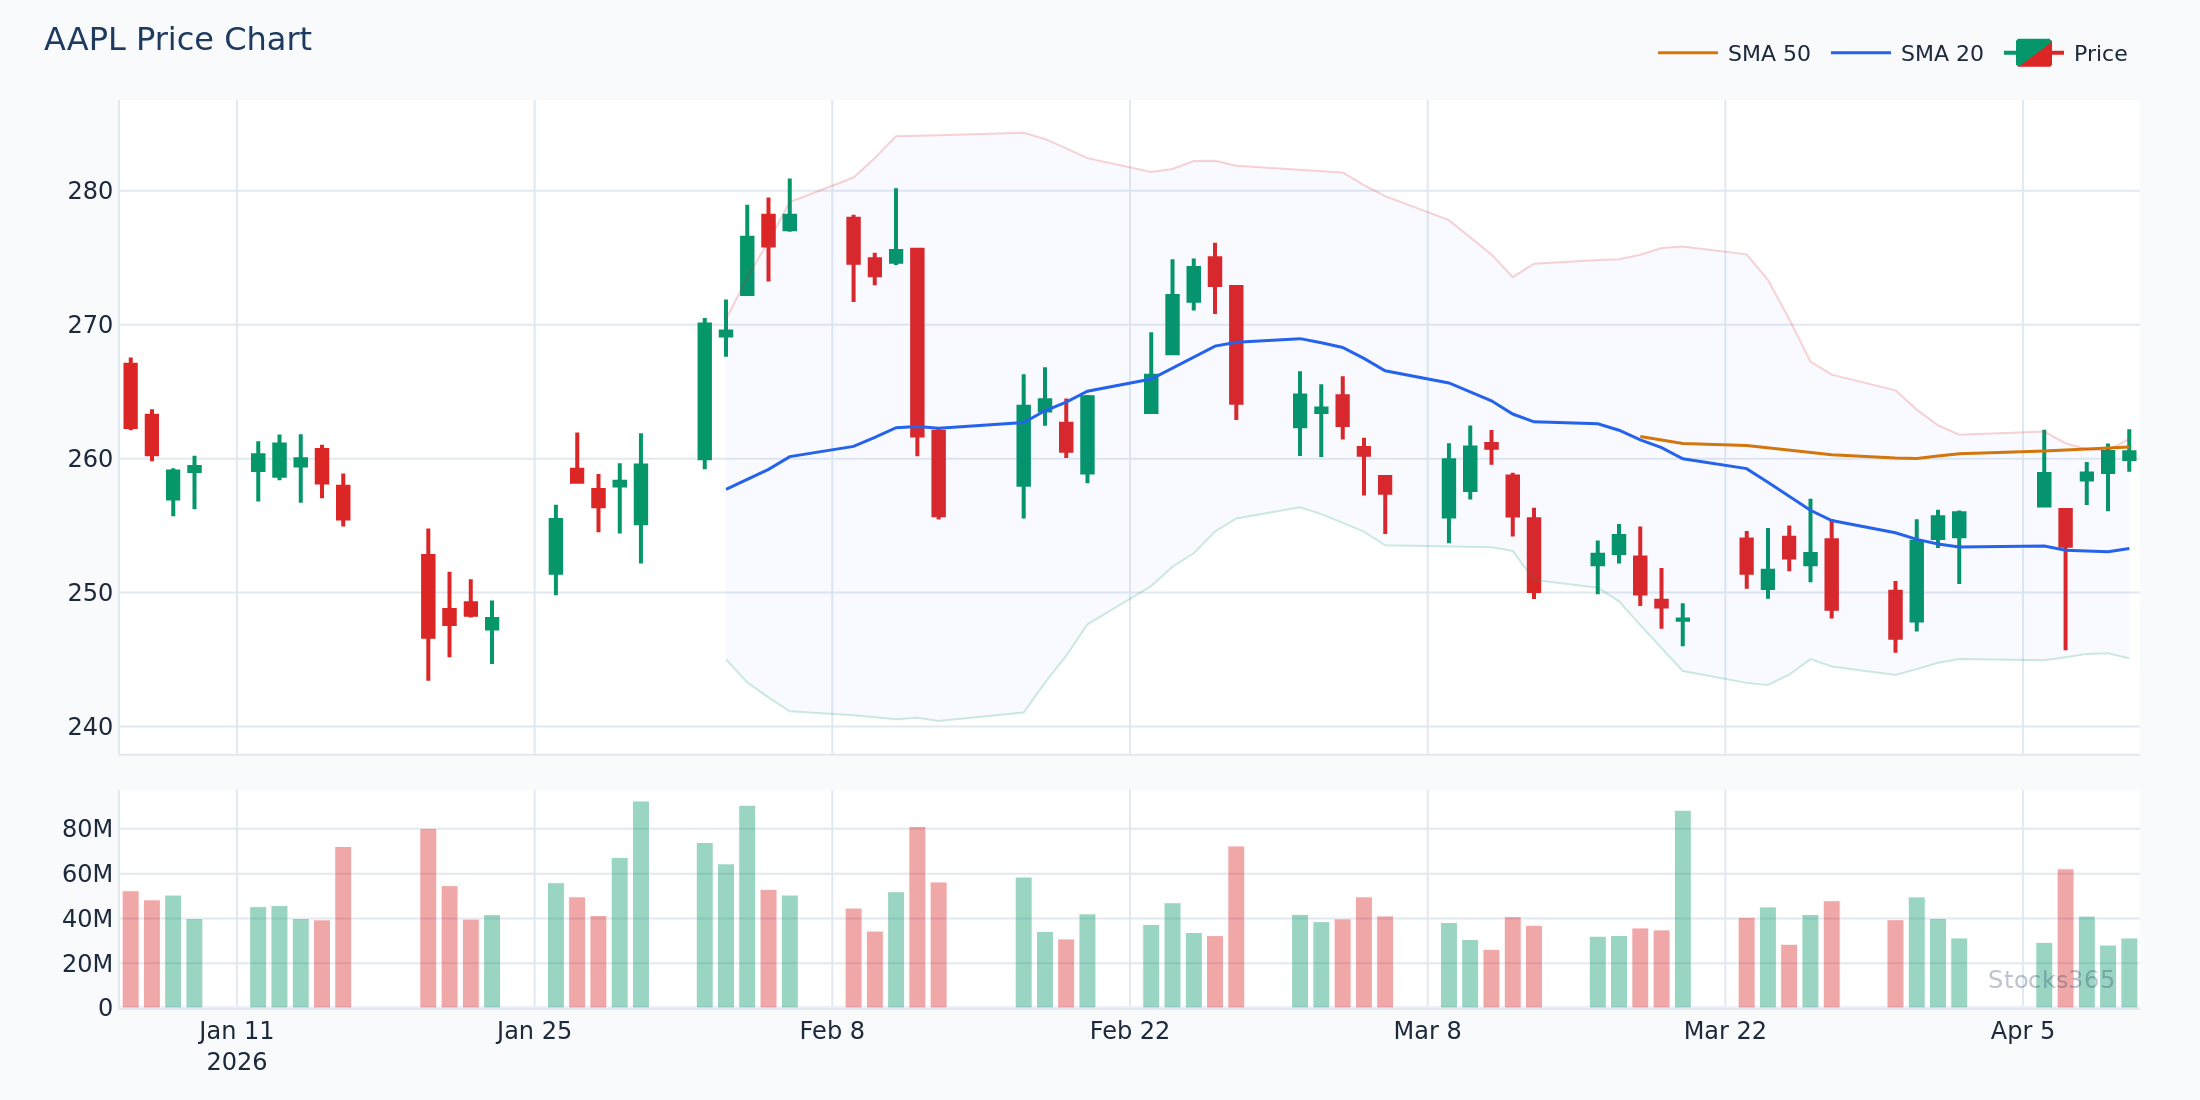
For example, checking a signal like AAPL's live signal page gives you an instant technical snapshot including band position, RSI reading, and volume trend — everything you need to evaluate a breakout setup in seconds rather than hours. For traders who also want to understand RSI overbought and oversold dynamics within their breakout analysis, our guide on RSI overbought and oversold levels is essential reading.
Bollinger Band Breakout Strategy: Risk Management Summary
No strategy discussion is complete without a dedicated risk management framework. Here's the professional approach in concise form:
- Position sizing: Risk no more than 1-2% of total account capital per breakout trade
- Stop loss: Always defined before entry — below the breakout candle low or the 20-period SMA
- Partial profits: Take 50% off at Target 1, let the remainder run with a trailing stop
- Daily loss limit: If you take two consecutive losing breakout trades in a day, stop trading for that session
- Win rate expectations: A well-filtered Bollinger Band breakout strategy typically achieves 45-60% win rates — the edge comes from asymmetric risk-to-reward, not from being right most of the time
"The goal of a breakout strategy isn't to be right 80% of the time — it's to ensure that when you're right, you make 3x what you lose when you're wrong. Bollinger Bands, properly applied, give you the structure to achieve exactly that."
Key Takeaways
- Bollinger Band breakouts are most powerful when preceded by a squeeze — a period of extended, abnormally low volatility
- Require a strong closing candle beyond the band (not just a wick) on volume at least 150-200% of the 20-period average
- Use RSI above 50 (bullish) or below 50 (bearish) to confirm momentum direction — learn more in our RSI beginner's guide
- Set stops logically below the breakout candle low or the middle band — never arbitrary dollar amounts
- Project profit targets using band width or the measured move from the prior consolidation range
- Multi-timeframe alignment (weekly + daily breakout) significantly increases probability of success
- The "band walk" phenomenon means staying in strong breakout trades longer than feels comfortable — use a trailing stop rather than a fixed target
- Stocks365's Trust Score system helps identify the highest-quality breakout setups by confirming multiple technical factors simultaneously