
Bollinger Band Breakout Strategy: How to Catch Big Market Moves
Most traders wait for a move to happen, then chase it. The Bollinger Band breakout strategy does the opposite — it positions you before the explosion, using compression and expansion as your guide. When the market coils, it eventually unloads. Bollinger Bands tell you when that moment is near.
This guide breaks down the full strategy: how it works, when it fails, and how to combine it with confirmation signals that actually matter.
What Is a Bollinger Band Breakout?
A Bollinger Band breakout occurs when price moves decisively beyond the upper or lower band after a period of compression — known as a Bollinger Squeeze. The bands themselves consist of three components: a 20-period simple moving average (the middle band), and two outer bands set two standard deviations above and below that average.
When volatility contracts, the bands narrow. When volatility expands, the bands widen. A breakout happens at the transition point — the moment price escapes the narrow range with force.
The core idea: tight bands don't stay tight forever. Something always breaks the compression.
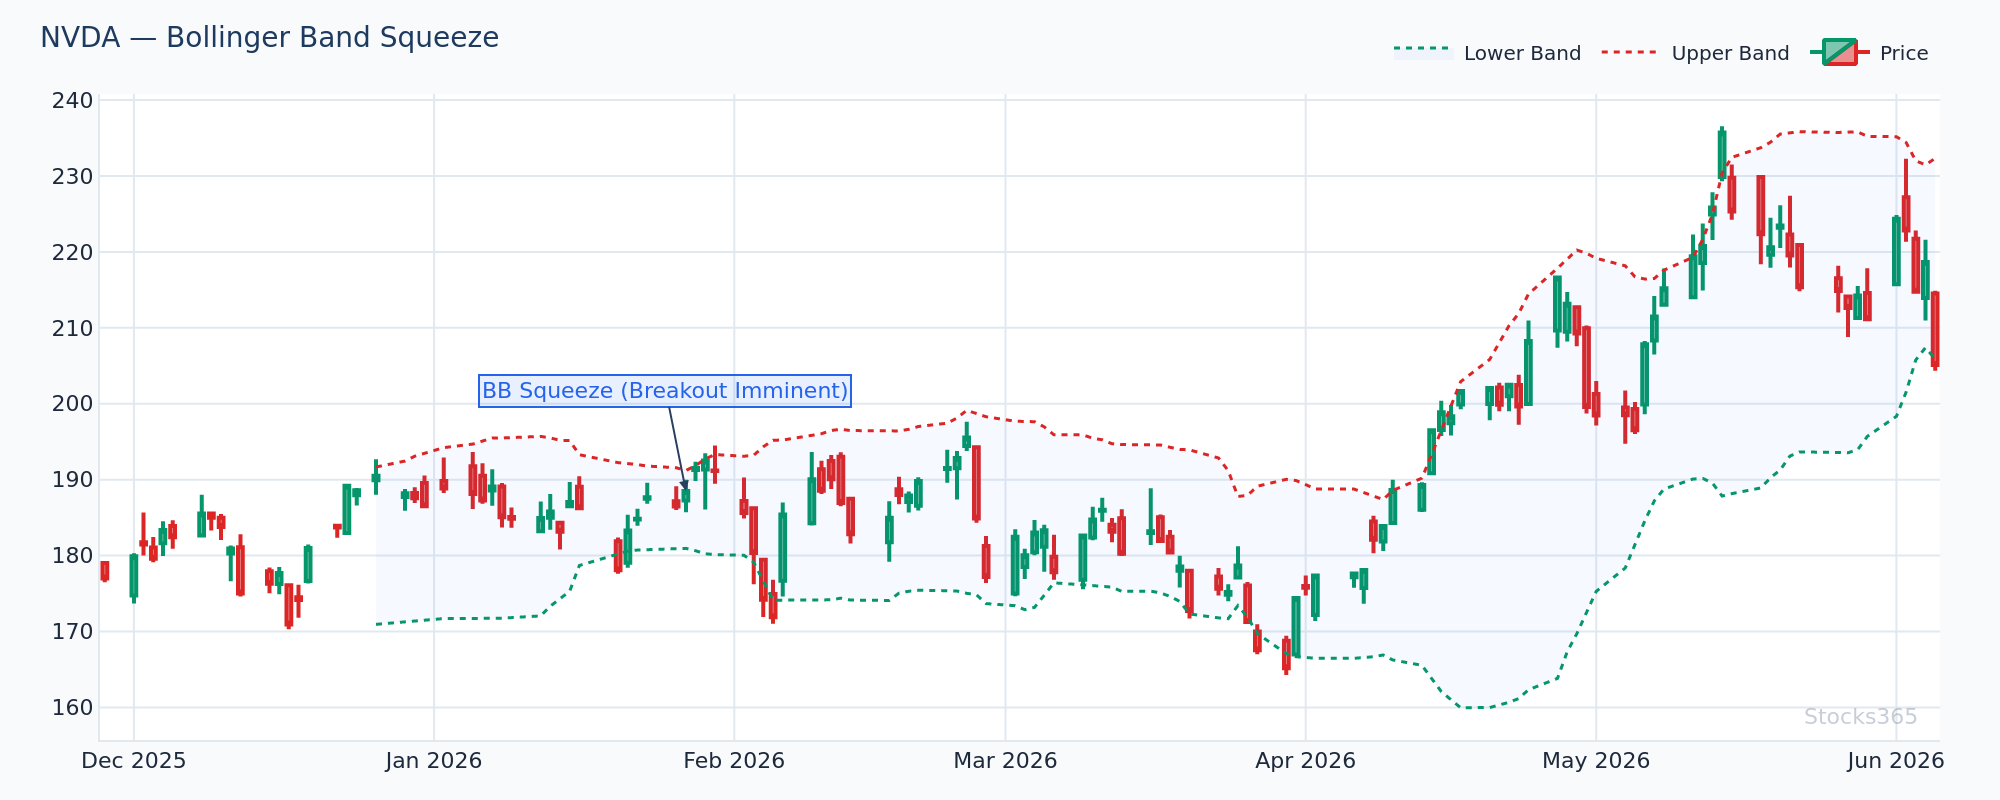
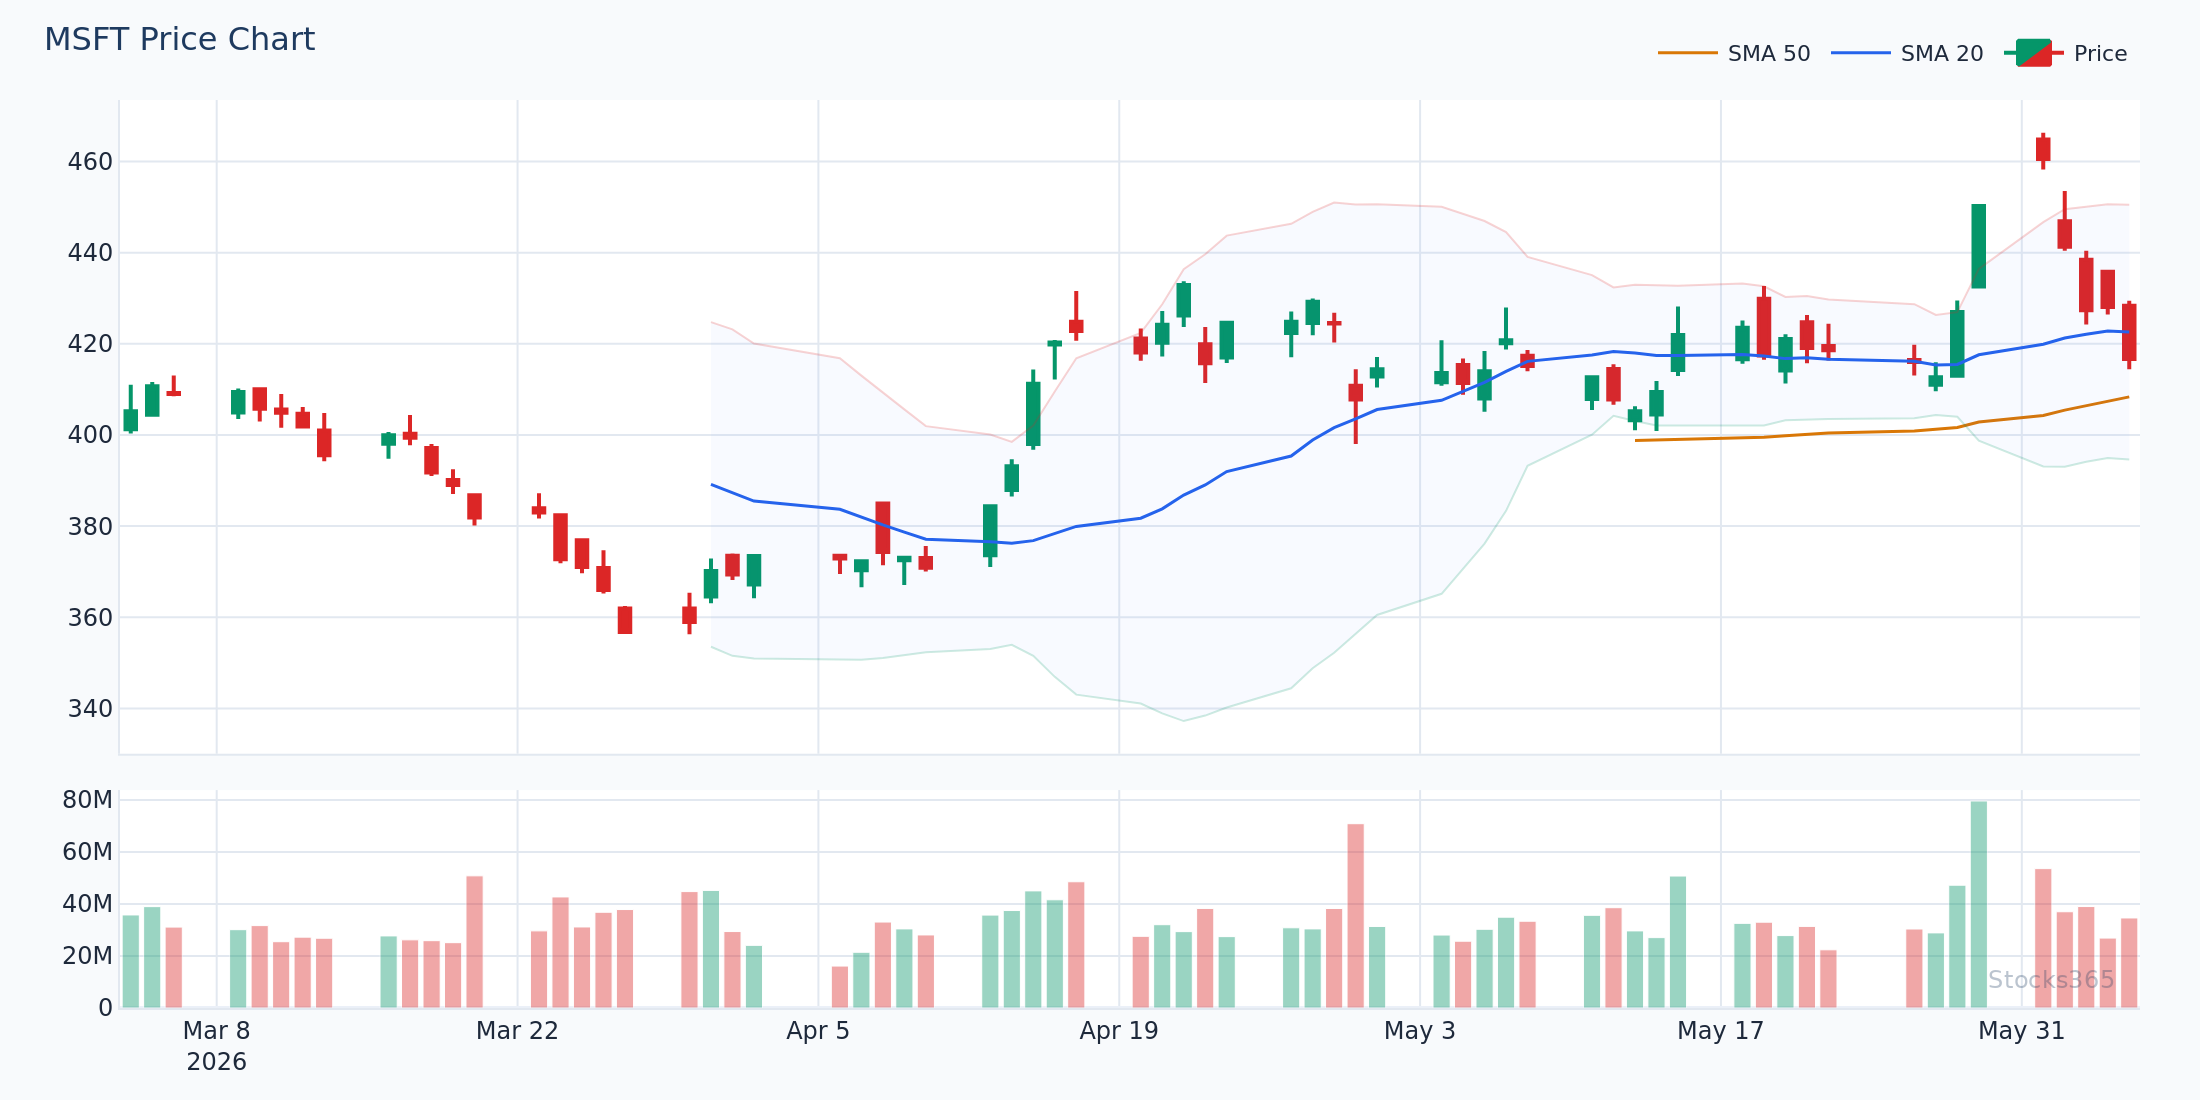
This chart shows the characteristic squeeze pattern before a major move — bandwidth at a multi-week low, price coiling near the midline. When the outer band is breached with a strong candle, that's your signal. What typically follows is an expansion phase lasting several sessions. The pattern is invalidated if price closes back inside the bands within 1-2 candles of the initial break.
The Squeeze: Your Pre-Breakout Setup
Before any breakout, there's always a squeeze. Bandwidth — the distance between the upper and lower bands — drops to its lowest level in weeks or months. Price moves sideways. Volume dries up. The market is loading the spring.
Stocks365 backtested 14,266 Bollinger Squeeze Breakout signals across multiple asset classes and found a profit factor of 1.03 over a 10-day holding period — meaning the strategy edges into profitable territory when applied systematically. The win rate sits at 49.5%, but the key is that winners outpace losers in magnitude, not frequency. Crypto was the strongest performing asset class at 51.8%, while forex lagged at 47.1%. You can explore the full methodology through our research dashboard.
How to Identify a Valid Squeeze
- Bandwidth percentile: Band width drops below the 20th percentile of its 52-week range
- Duration: Compression lasts at least 5-10 sessions — brief squeezes produce weaker breakouts
- Volume decline: Average volume drops noticeably during the squeeze phase, signaling reduced participation
- Price positioning: Price oscillates near the midline (20-SMA), not pinned to one band
Not every squeeze becomes a big move. But nearly every big move starts with a squeeze.
Bollinger Band Breakout: The Core Setup
Once a squeeze forms, you're watching for the breakout trigger. Here's the precise setup:
Upper Band Breakout (Bullish)
- Price closes above the upper Bollinger Band on above-average volume
- The candle closing above the band should show real body, not a long wick rejection
- The 20-SMA is trending upward or flattening from a base
- RSI moves above 55 — confirming momentum, not just a noise spike
Lower Band Breakout (Bearish)
- Price closes below the lower Bollinger Band on elevated volume
- Candle body dominates — not a wick touching the band
- The 20-SMA is trending downward
- RSI drops below 45, confirming bearish momentum
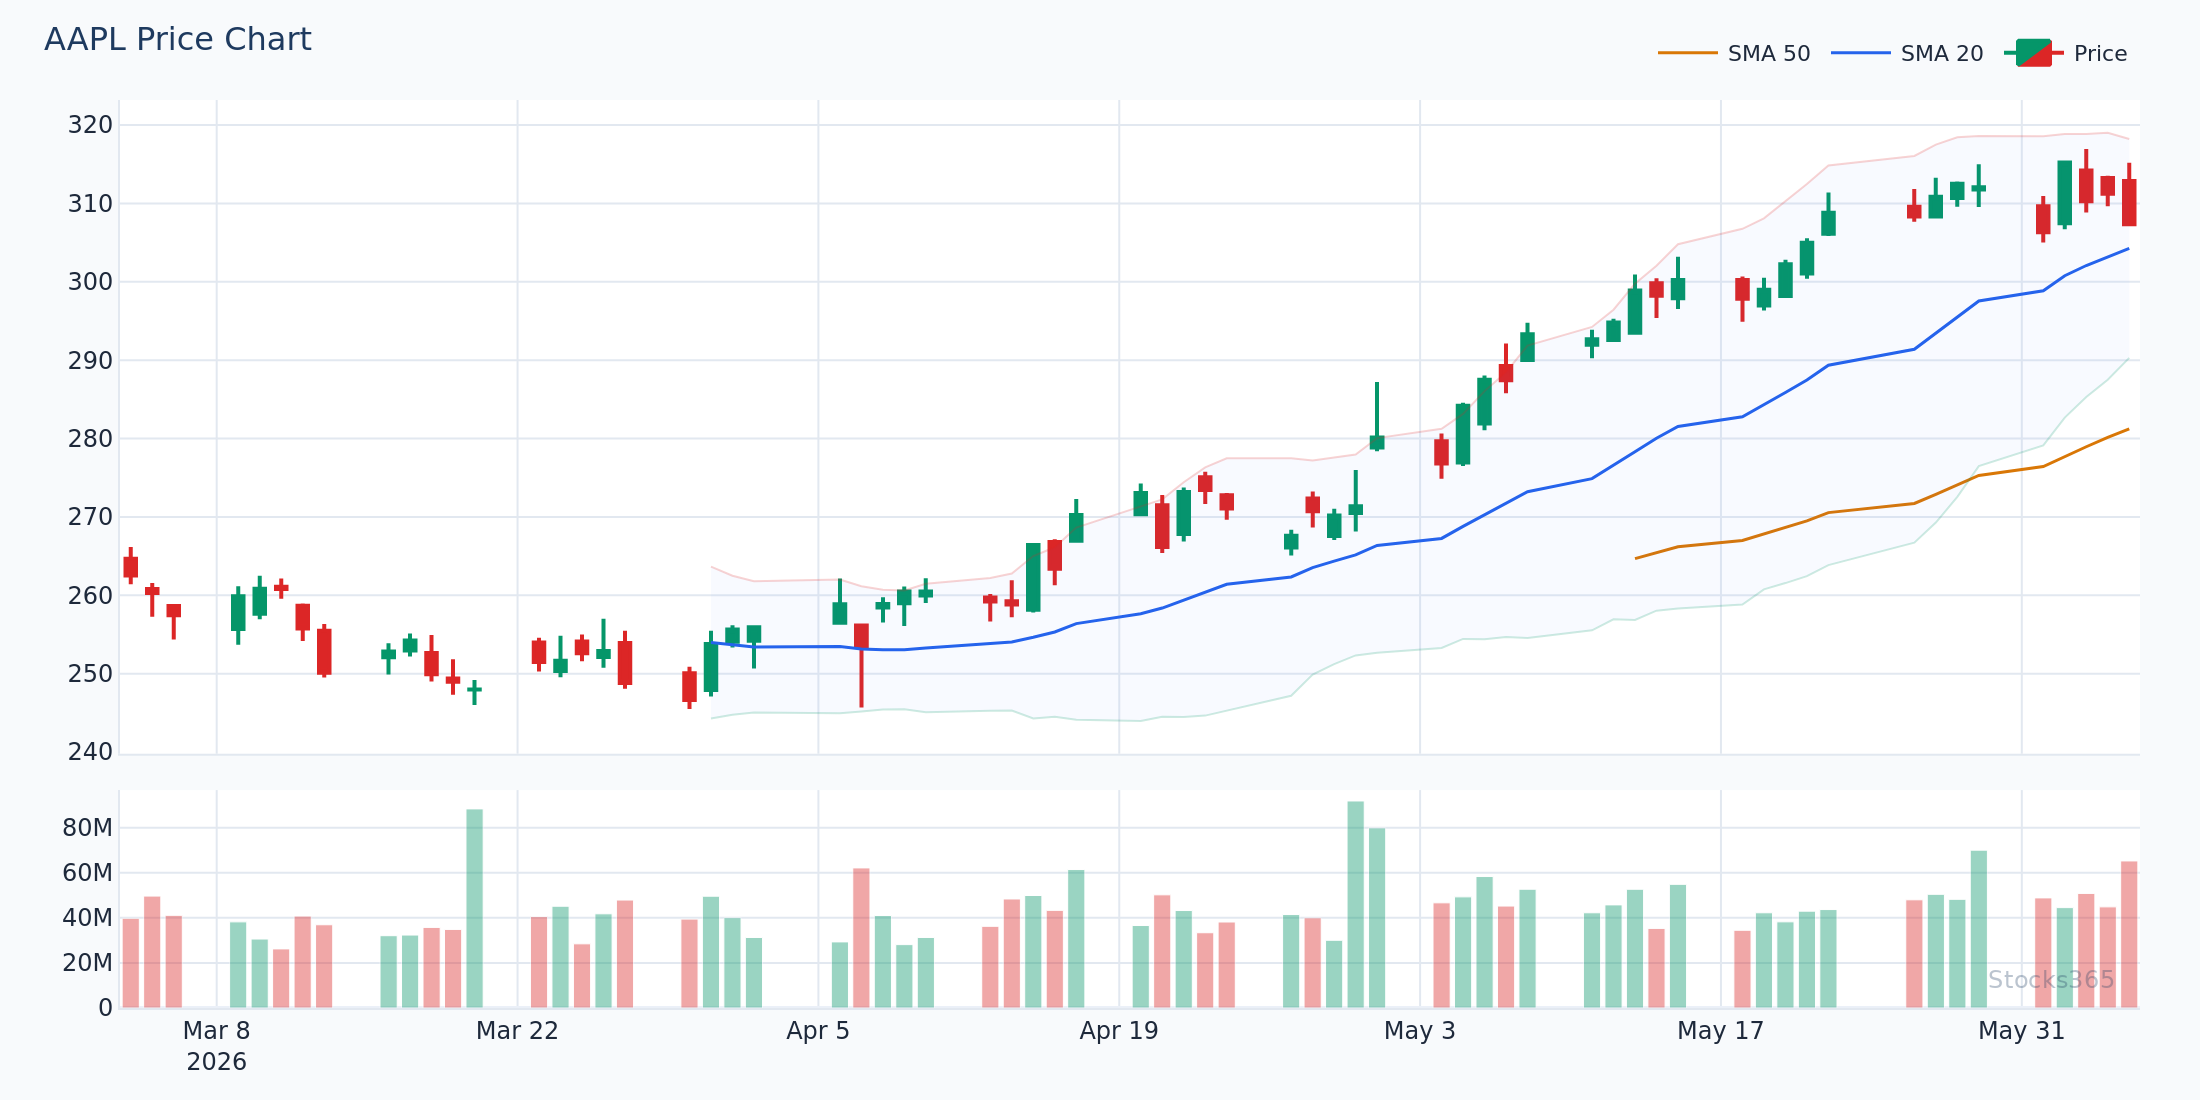
This setup shows price punching through the upper band with conviction — the candle body is clean, volume surges above the 20-day average, and the 20-SMA is clearly pointing higher. When all three align, the probability of continuation over the next several sessions rises significantly. The setup fails if the next candle immediately reverses and closes back below the upper band — treat that as a false breakout signal.
Here's What Most Traders Get Wrong
Most traders see a price touch or cross the upper Bollinger Band and immediately think "overbought — time to sell." That's backwards. In strong trending markets, price can ride the upper band for weeks, with every touch representing continuation, not reversal. The band touch alone tells you nothing directional.
Our analysis of 3,255 Bollinger Upper Band Touch signals confirms this: a 49.6% win rate with a profit factor of 0.88 over 10 days. Fading the upper band touch — treating it as a sell signal — is a negative expectancy trade across most asset classes. The real edge isn't in the touch. It's in what happens after the squeeze when momentum is already established.
Don't fight the band. Read the context around it.
For a deeper dive into how band touches translate into actual buy and sell signals, see our Bollinger Bands Buy and Sell Signals master guide.
Confirmation Indicators That Strengthen the Signal
A Bollinger Band breakout alone isn't enough. Confirmation is what separates high-probability setups from noise. Layer these tools to filter weak signals.
Volume Confirmation
Volume is the most critical confirmation. A breakout without volume is a warning sign, not an entry signal. Look for volume surging at least 1.5x to 2x the 20-day average on the breakout candle. Volume-weighted analysis can add another layer — the VWMA (Volume-Weighted Moving Average) reveals whether buyers are actually committing capital at the breakout price, or whether the move is thinly traded and suspect.
RSI Momentum Alignment
RSI above 55 on an upper band breakout confirms bullish momentum. RSI below 45 on a lower band breakout confirms bearish pressure. What you don't want: RSI diverging from price — price breaks to new highs but RSI makes a lower high. That divergence signals exhaustion, not momentum. The RSI trendline strategy is particularly useful here — a break of an RSI downtrend line coinciding with a band breakout is a powerful confluence signal.
Stochastic Oscillator
The stochastic adds a short-term timing layer. On bullish breakouts, a stochastic crossover from below 80 (not yet overbought) into the 80+ zone confirms accelerating momentum. On bearish breakouts, a stochastic cross below 20 from above adds conviction. Avoid entering a bullish breakout when stochastic is already pegged above 90 — you're buying into short-term exhaustion. Learn how to apply this precisely in our guide on how to read the stochastic oscillator step-by-step.
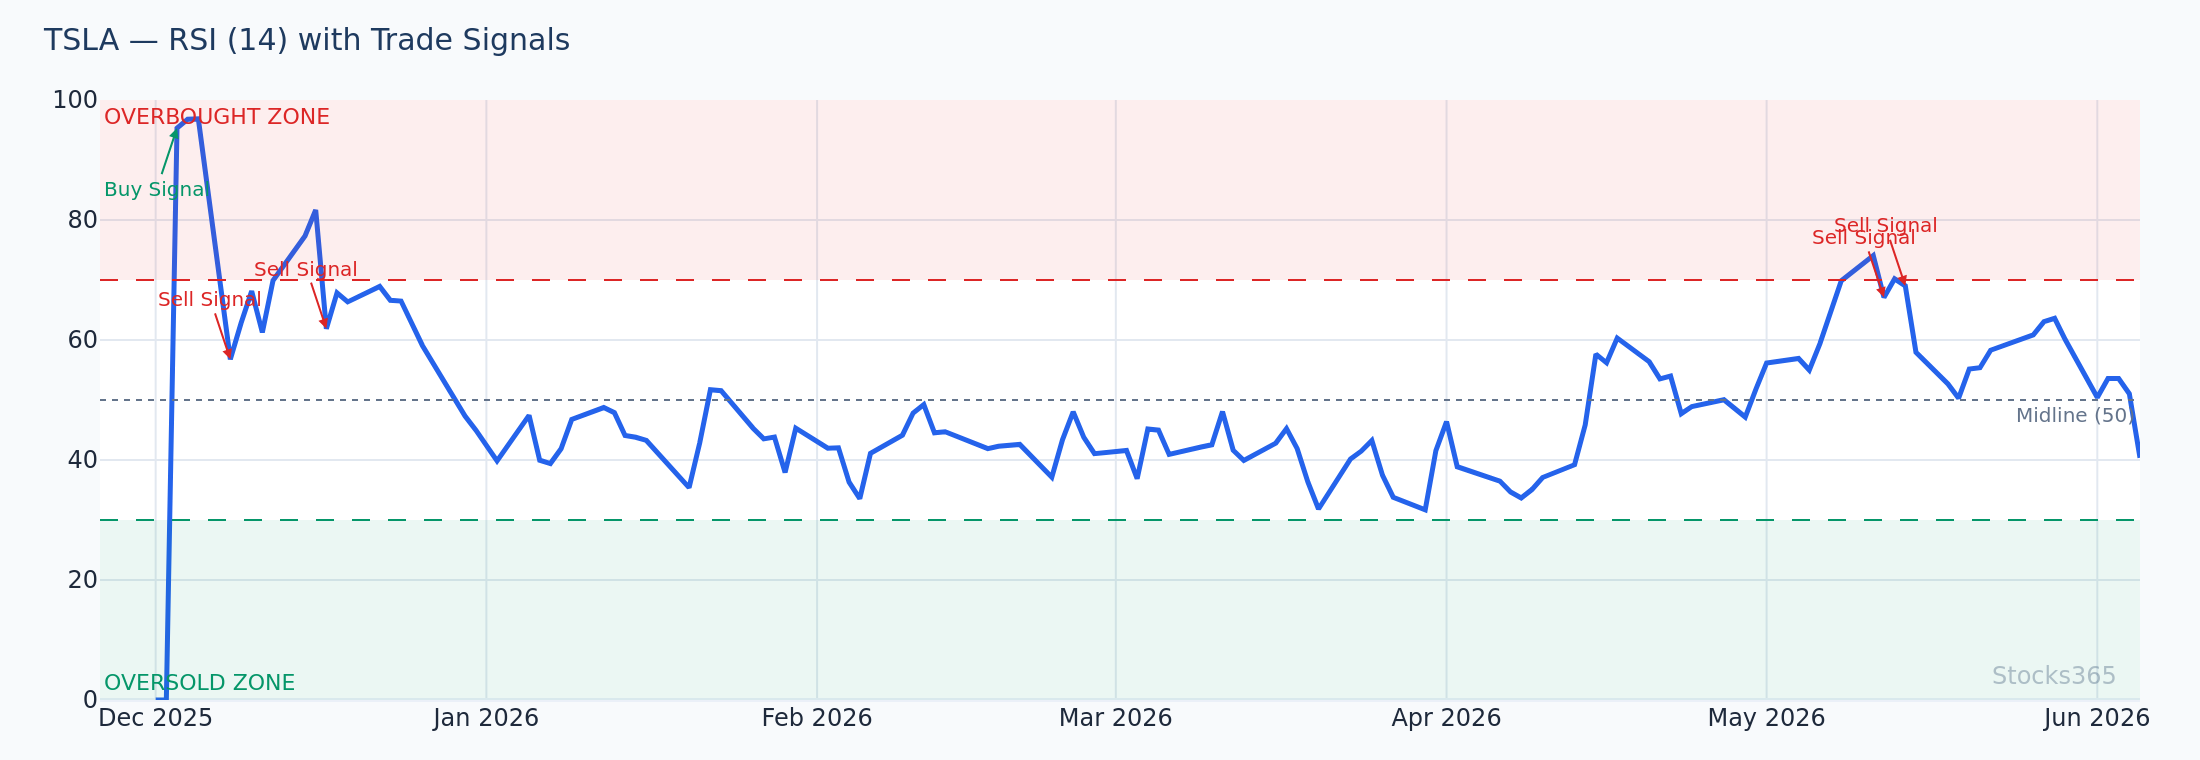
Here, RSI climbs decisively above 55 at the same moment price closes above the upper band — that's the confluence confirmation traders look for. When RSI is already trending higher into the breakout (not just spiking), the momentum has durability. If RSI immediately peaks and rolls over within 1-2 sessions of the breakout, reduce position size or exit early.
When the Bollinger Band Breakout Strategy Works Best
Context is everything. The same setup produces different results in different environments.
Best Market Conditions
- After prolonged consolidation: The longer the squeeze, the more energy stored. Breakouts after 2-3 week squeezes tend to produce larger moves than those from 3-day compressions
- Trend-aligned breakouts: Bullish breakouts work better in uptrending markets; bearish breakouts in downtrends. Use the Golden Cross vs Death Cross framework to confirm the broader trend direction
- Catalyst-driven environments: Earnings, macro announcements, and sector rotations that compress price into a range before releasing it explosively
- Crypto and high-beta equities: Our backtesting shows crypto produces the strongest breakout results across both squeeze and upper band setups
Conditions Where the Strategy Struggles
- Choppy, range-bound markets: When there's no dominant trend, breakouts fail and reverse frequently — you get repeated false signals
- Low-liquidity assets: Thinly traded instruments can produce band breaches on minimal volume — these are almost always traps
- Commodities: Our data consistently shows commodities as the weakest performer for both squeeze breakouts and upper band touch setups — seasonality and supply-demand dynamics override technical setups more frequently
- During high-uncertainty macro events: When the VIX spikes unpredictably, bands widen for reasons unrelated to directional momentum, producing misleading signals
False Breakouts: How to Filter Them Out
False breakouts are the primary failure mode of this strategy. Price crosses the band, traders enter, then price immediately reverses back inside. It happens. The question is how to minimize exposure to these traps.
The Retest Entry
Instead of entering on the breakout candle itself, wait for a retest. After a genuine breakout, price often pulls back to retest the upper band (now support on a bullish break) or the lower band (now resistance on a bearish break). Entry on the retest gives you a tighter stop and better risk-reward. If price fails the retest and collapses back through the band, you're out with a small loss rather than chasing a false move.
Volume Filter
A breakout on below-average volume has a much higher probability of being false. Make volume non-negotiable. If volume doesn't confirm, the signal doesn't qualify — move to the next setup. Combining volume with RSI and volume analysis creates a multi-layer filter that eliminates a significant portion of false signals.
Time-of-Day Awareness
Breakouts occurring in the final 30 minutes of a session — when volume can spike for technical reasons — are less reliable than those forming mid-session with sustained momentum. Early session breakouts that hold through the first hour carry more weight.
This chart illustrates the classic false breakout pattern — price crosses the upper band intraday but closes back inside on weak volume. The next session gaps lower, trapping late buyers. The tell is the candle structure: a long upper wick with a weak close signals seller rejection, not continuation. When you see this pattern, step aside. The real breakout often comes days later after the weak hands are cleared out.
Bollinger Band Breakout With Moving Average Context
Moving averages add trend context that Bollinger Bands alone can't provide. The 20-SMA (already embedded in the bands) is your primary reference, but adding the 50-SMA and 200-SMA dramatically improves signal quality.
A bullish band breakout is significantly stronger when the 20-SMA is above the 50-SMA, and the 50-SMA is above the 200-SMA — a full bullish alignment. Price breaking above the upper band in this structure confirms you're trading with the trend, not against it.
If you're using MetaTrader for analysis, our guide on how to set up moving averages on MetaTrader 4 and 5 covers the exact configuration for this multi-MA framework.
Risk Management for Bollinger Band Breakout Trades
Even with the best setups, losses happen. Managing them correctly is what keeps you in the game.
Stop Loss Placement
- Bullish breakout: Place stop below the 20-SMA or below the upper band (now support). A close back below either level invalidates the breakout thesis
- Bearish breakout: Stop above the 20-SMA or above the lower band (now resistance)
- ATR-based stops: Using 1.5x ATR below your entry gives room for normal volatility without stopping you out of a valid move prematurely
Profit Targets
- First target: 2x the ATR from entry — this captures the initial expansion phase
- Second target: move stop to breakeven at first target, let remainder run while bands continue expanding
- Exit signal: when price closes back inside the bands after an extended run, the expansion phase is likely exhausted
Position size based on your stop distance. Never fixed lot size. The setup doesn't dictate the risk — you do.
What to Watch For
- Bollinger Squeeze on tech stocks with bandwidth below the 20th percentile: When compression reaches historically tight levels, the next expansion frequently produces a 2-3 ATR move — watch for volume to confirm which direction the spring releases
- Upper band breakouts in crypto after a consolidation of 10+ sessions: Our backtesting shows crypto produces the strongest breakout performance (51.8% win rate on squeeze setups), particularly when RSI holds above 50 throughout the squeeze phase
- Bullish breakout with full moving average alignment (20 above 50, 50 above 200): These trend-aligned breakouts have meaningfully higher follow-through than counter-trend setups — filter ruthlessly for this condition
- Volume surge 2x or greater on the breakout candle: This single filter eliminates a large portion of false breakouts — if volume doesn't confirm, the signal doesn't qualify regardless of how clean the band breach looks
- RSI divergence going into a squeeze: If RSI makes higher lows while price consolidates flat, the coiled energy has a bullish bias — combine this with a band breakout for high-confluence entries
How Stocks365 Uses This
🔍 How Stocks365 Integrates Bollinger Band BreakoutsStocks365's trust score system evaluates signals across 12+ technical indicators — and Bollinger Band structure is one of the core volatility regime inputs. When our engine detects a Bollinger Squeeze (bandwidth in the bottom 20th percentile) followed by a band breakout with volume confirmation, this registers as a high-volatility expansion signal within the regime scoring layer.
The breakout direction, combined with RSI momentum and moving average alignment, feeds into the agreement score — a measure of how many independent indicators are pointing in the same direction. The higher the agreement score, the higher the overall trust score for that signal.
You can see trust scores live for individual stocks like AAPL and NVDA on our signals dashboard, where Bollinger Band regime data is one of the contributing factors displayed alongside momentum, volume, and trend indicators.
Key Takeaways
📌 Bollinger Band Breakout Strategy — Summary
- A Bollinger Squeeze (tight bands) precedes the majority of major directional moves — identify compression before the breakout, not after
- Stocks365 backtested 14,266 squeeze breakout signals with a profit factor of 1.03 — winners outrun losers in magnitude, making it a positive expectancy strategy when applied with filters
- Volume is non-negotiable confirmation — breakouts on below-average volume are traps, not opportunities
- Fading upper band touches as automatic sell signals is a negative expectancy approach (profit factor: 0.88 across 3,255 signals) — read context, not just position
- Crypto produces the strongest breakout performance across asset classes; commodities the weakest — asset selection matters as much as setup quality
- Layering RSI momentum, stochastic timing, and volume-weighted analysis dramatically improves signal quality over raw band touches alone
- False breakouts are filtered most effectively by waiting for retests and requiring volume confirmation on the initial breakout candle
- The Stocks365 signals dashboard integrates Bollinger Band regime analysis into its trust score system for real-time signal evaluation
| # | Strategy | Type | Win Rate | Sharpe | PF | N | Status |
|---|---|---|---|---|---|---|---|
| #1 | Bollinger Squeeze Breakout | volatility | 49.5% | 0.04 | 1.03 | 14,266 | TEST |
Frequently Asked Questions
What is a Bollinger Band breakout and how does it work?
A Bollinger Band breakout occurs when price closes decisively beyond the upper or lower band, typically after a period of compression called a Bollinger Squeeze. The squeeze forms when volatility contracts and bands narrow — and the breakout happens when price escapes that compressed range with momentum. The strategy works because volatility cycles between contraction and expansion: tight bands store energy, and breakouts release it. Volume confirmation and RSI alignment determine whether the breakout is genuine or a false signal.
Is a Bollinger Band breakout a reliable trading strategy?
It's a positive expectancy strategy when applied with proper filters — but it's not a high-win-rate setup on its own. Stocks365's analysis of 14,266 squeeze breakout signals found a 49.5% win rate with a profit factor of 1.03 over a 10-day holding period. The edge comes from winners being larger than losers, not from being right more than half the time. Adding volume confirmation, RSI momentum alignment, and trend context (moving average structure) significantly improves the quality of individual signals.
What's the difference between a Bollinger Band touch and a Bollinger Band breakout?
A band touch means price reaches or briefly crosses the outer band, often as part of normal oscillation within an established range. A breakout is a sustained close beyond the band, ideally following a squeeze, with elevated volume confirming directional momentum. Treating band touches as breakout signals is a common mistake — our backtesting of 3,255 upper band touch signals shows a profit factor of just 0.88, meaning blindly fading or trading band touches is a losing approach without additional context.
Which assets work best with the Bollinger Band breakout strategy?
Crypto consistently outperforms other asset classes in our backtesting — showing a 51.8% win rate on squeeze breakout setups compared to 47.1% for forex, which ranks as the weakest. High-beta equities (tech, growth stocks) also tend to produce cleaner breakout patterns due to their trending behavior and higher volatility regimes. Commodities perform worst across both squeeze and band touch setups — supply and demand fundamentals tend to override technical patterns more frequently in those markets.
How do I avoid false Bollinger Band breakouts?
Three filters eliminate the majority of false breakouts: First, require volume of at least 1.5-2x the 20-day average on the breakout candle — low-volume breakouts are traps. Second, wait for the retest — after a genuine breakout, price often pulls back to the band before continuing; enter on the retest rather than chasing the initial move. Third, confirm with RSI momentum — RSI above 55 on bullish breakouts and below 45 on bearish ones confirms underlying momentum. Candle structure matters too: a strong close (minimal wick relative to body) is far more reliable than a long wick breach of the band.