
How to Set Up Moving Averages on MetaTrader 4 & 5: The Complete 2026 Guide
Moving averages are the backbone of technical analysis. They cut through price noise, reveal trend direction, and — when combined correctly — generate some of the most reliable trade signals available. But raw knowledge isn't enough. You need to know exactly how to set them up on the platforms where real trades happen.
This guide covers everything: installing a moving average on MetaTrader 4 and MetaTrader 5, choosing the right settings for your market, and building crossover strategies that actually work. No fluff. No theory overload. Just the setup steps and the logic behind them.
Our research dashboard backtested over 6,600 moving average signals across stocks, crypto, and forex — and the results reveal something most tutorials won't tell you. The edge is real, but it's asset-class dependent. More on that shortly.
What Is a Moving Average — and Why It Still Works in 2026
A moving average smooths out price data over a set number of periods, plotting a continuous line on your chart. Instead of reacting to every candle, it shows the average price across a defined window — 20 periods, 50 periods, 200 periods.
Two types dominate real trading setups:
- Simple Moving Average (SMA): Adds closing prices over N periods and divides by N. Equal weight to every candle.
- Exponential Moving Average (EMA): Applies heavier weighting to recent prices. Reacts faster to new price action.
Neither is universally better. The SMA suits trend-following on higher timeframes. The EMA works better for intraday momentum and fast-moving assets. Your job is matching the tool to the context.
The math matters too — understanding how these calculations work makes you a better trader. For a deep dive into indicator calculation logic, the same principles covered in How RSI Is Calculated: Formula Explained Step by Step apply directly to understanding why moving averages lag and how to compensate.
How to Add a Moving Average on MetaTrader 4 (MT4)
MetaTrader 4 remains the most widely used retail trading platform in 2026. The moving average indicator is built in — no downloads required.
Step-by-Step: Installing a Moving Average on MT4
- Open any chart in MT4 (any symbol, any timeframe).
- Click Insert in the top menu bar.
- Hover over Indicators, then select Trend.
- Click Moving Average from the submenu.
- The parameter window opens. Configure your settings (details below).
- Click OK. The MA line appears on your chart instantly.
Alternatively, use the Navigator panel on the left side of the platform. Expand Indicators > Trend > Moving Average, then double-click or drag it onto your chart.
MT4 Moving Average Settings Explained
The parameter window has five fields. Here's what each one controls:
- Period: The number of candles averaged. Common values: 9, 20, 50, 100, 200.
- Shift: Displaces the line forward or backward on the chart. Leave at 0 for standard use.
- MA Method: Simple, Exponential, Smoothed, or Linear Weighted. SMA and EMA cover 95% of real setups.
- Apply To: The price input. Close is the default and most reliable. High/Low combinations are used in specific volatility strategies.
- Style: Line color, width, and type. Customize for readability — use contrasting colors when stacking multiple MAs.
Want to add a second moving average for a crossover strategy? Repeat the process and choose a different period. That's it.
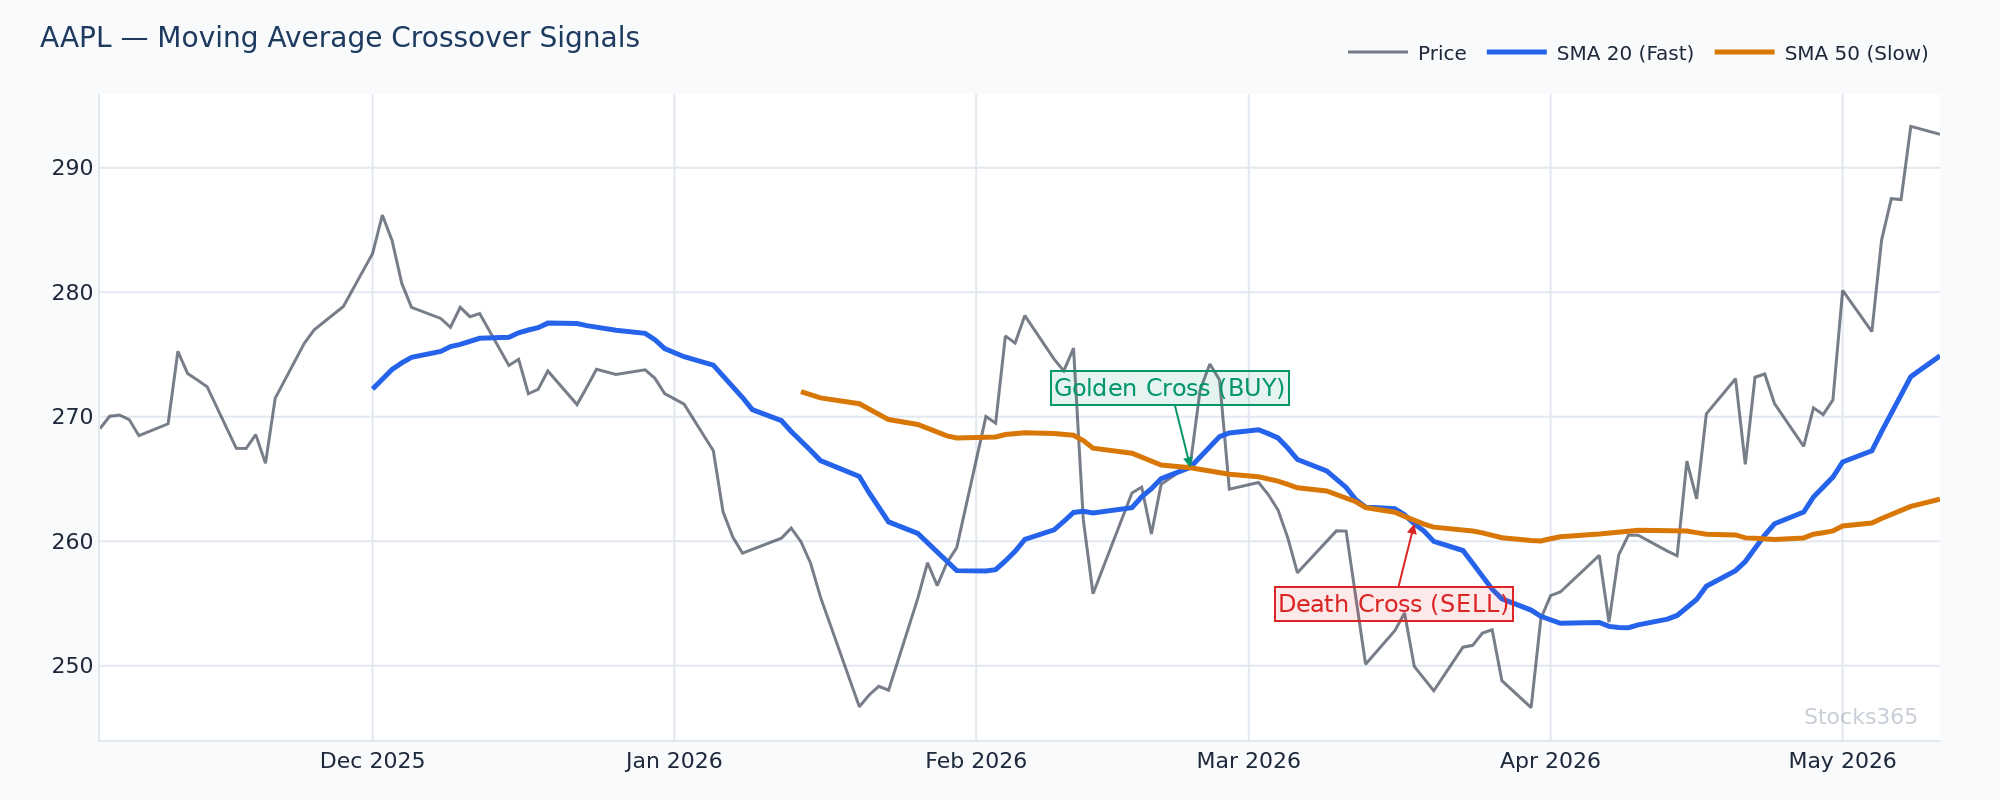
This chart shows a classic golden cross forming — the 20-period SMA rising toward and crossing above the 50-period SMA. When price holds above both lines after the cross, the bullish signal gains confirmation. The setup invalidates quickly if price closes back below both moving averages within two or three candles of the cross.
How to Add a Moving Average on MetaTrader 5 (MT5)
MT5 shares nearly the same workflow as MT4, with a cleaner interface and additional MA method options.
Step-by-Step: Installing a Moving Average on MT5
- Open a chart in MT5.
- Click Insert in the top menu.
- Select Indicators > Trend > Moving Average.
- Configure settings in the dialog box that appears.
- Click OK to apply.
MT5 also adds a Double Exponential Moving Average (DEMA) and Triple Exponential Moving Average (TEMA) as built-in options — both designed to reduce lag further. For most traders, standard EMA is sufficient. DEMA becomes useful when trading fast-moving assets like crypto where lag kills signal quality.
MT5-Specific Features Worth Using
- Indicator Properties Panel: Right-click the MA line on your chart and select Properties for quick access to all settings without reopening the full dialog.
- Multiple Chart Windows: MT5 supports more simultaneous chart layouts, making multi-timeframe MA analysis significantly easier than MT4.
- Strategy Tester: MT5's built-in backtester is more powerful than MT4's, allowing you to test MA crossover systems across multiple assets efficiently.
Choosing the Right Moving Average Period for Your Strategy
Period selection is where most beginners go wrong. There's no universal setting. The right period depends on your timeframe, your asset class, and your holding window.
Short-Period MAs (9–21): Momentum and Intraday
The 9 EMA and 21 EMA are workhorses for day traders and swing traders operating on 15-minute to 4-hour charts. They hug price closely and generate frequent signals. That's both the advantage and the risk — more signals means more false signals too.
Medium-Period MAs (50): Trend Identification
The 50-period SMA or EMA is the most watched medium-term trend indicator. Price holding above the 50 SMA on a daily chart is widely read as a bullish regime. Price breaking below it triggers defensive posturing from institutional desks. This isn't coincidence — it's self-reinforcing because so many participants watch the same level.
Long-Period MAs (100–200): Macro Trend and Support
The 200 SMA on the daily chart is the most referenced moving average in professional trading. It defines long-term trend. The 200-day MA cross — when price crosses above or below it — is one of the most broadcast signals in financial media. That attention gives it real impact on market behavior.
Here the price is testing the 200 SMA from above after a pullback — a textbook support interaction. If price closes a full candle above the 200 SMA and reverses upward with volume confirmation, the long-side setup activates. A clean close below the 200 SMA on elevated volume cancels the bullish thesis entirely.
Building a Moving Average Crossover Strategy on MT4 & MT5
The crossover strategy is simple in concept: a faster MA crossing above a slower MA signals bullish momentum; crossing below signals bearish. The execution requires discipline.
The Classic 20/50 SMA Crossover Setup
Add both the 20-period SMA and 50-period SMA to your chart using the steps above. Use contrasting colors — white for the 20, yellow for the 50, for example. The signal triggers when the 20 SMA crosses the 50 SMA.
Bullish signal: 20 SMA crosses above 50 SMA while price trades above both lines.
Bearish signal: 20 SMA crosses below 50 SMA while price trades below both lines.
Context matters enormously. A crossover firing in a ranging, low-volatility market produces far more false signals than the same crossover in a trending environment. Always check the broader price structure before acting.
The Triple MA Stack: 20 / 50 / 200
Add a third MA — the 200 SMA — and use all three together. The most powerful setup occurs when all three are aligned in order: price above the 20, 20 above the 50, 50 above the 200. That stack tells you the short, medium, and long-term trends are all pointing in the same direction. Pullbacks to the 20 or 50 in that environment become high-probability entries.
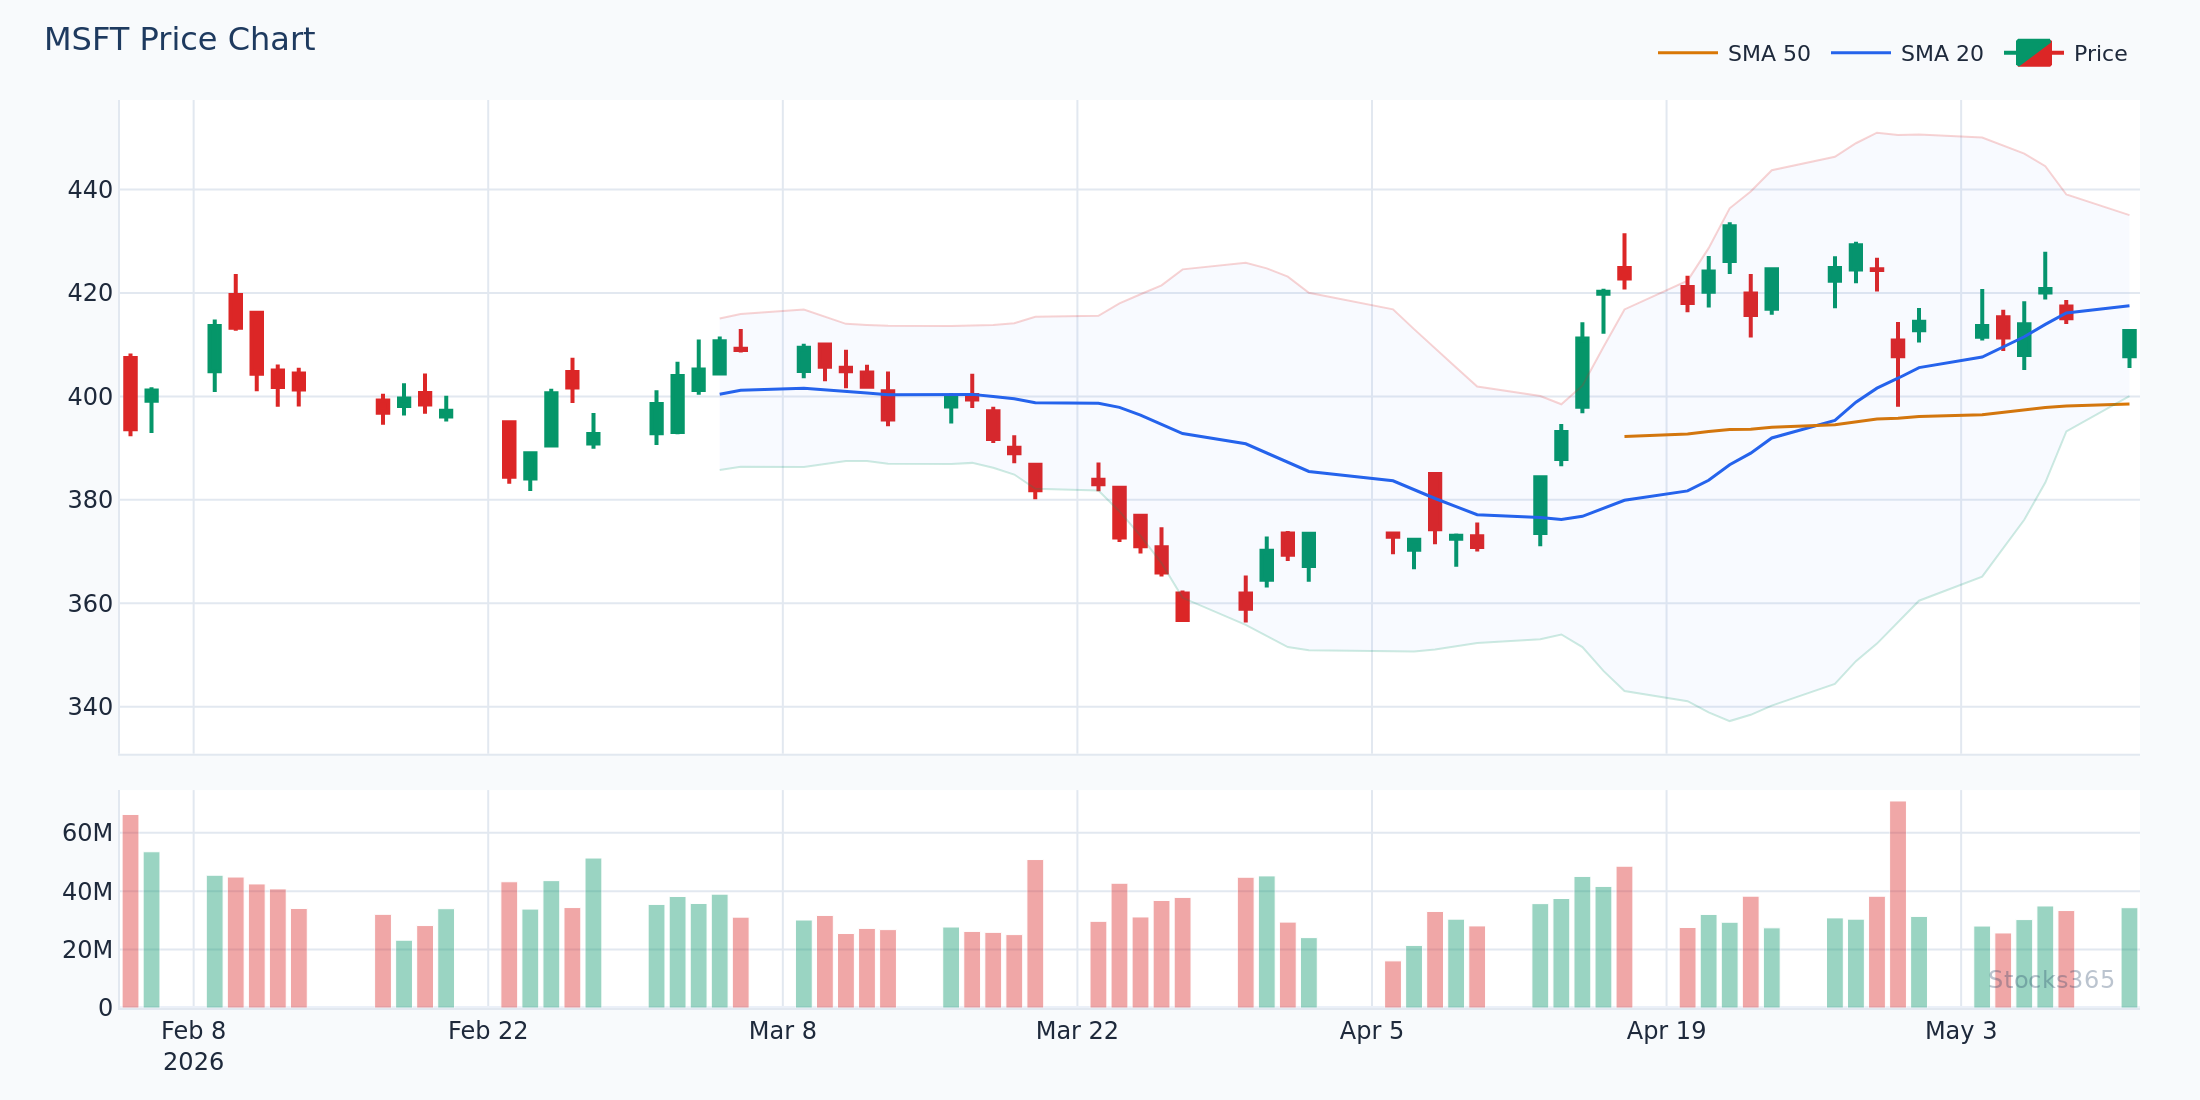
All three moving averages are stacked in bullish order here, with price pulling back toward the 20 SMA after a momentum surge. The 20 SMA acting as dynamic support during an uptrend is a reliable continuation pattern. The setup fails if price slices through all three MAs on a single candle — that kind of decisive break often precedes a trend reversal rather than a simple retest.
Here's What Most Traders Get Wrong About Moving Averages
Most traders treat a moving average cross as an automatic entry signal. They see the 20 SMA cross above the 50 SMA and buy immediately — no confirmation, no context check.
The real edge isn't the cross itself. It's what happens after the cross. Price often retests the moving averages following a crossover event. That retest — where the previously broken MA becomes new support or resistance — is the higher-probability entry. You get a second chance to enter with confirmation instead of chasing the initial move.
Stocks365 backtested 3,289 instances of price crossing above the 20 SMA across stocks, crypto, and forex, and found a win rate of just 48.3% over a 10-day holding period (n=3,289, profit factor: 0.88). That's a losing expectancy if you're trading the cross blindly. But when broken down by asset class, stocks produced a 52.3% win rate — a meaningful edge that compounds over time when filtered correctly.
Context. Filtering. Confirmation. Those are the three things separating traders who profit from moving average setups and those who don't.
Combining Moving Averages With Other Indicators on MT4 & MT5
Moving averages alone are trend tools. They don't tell you about momentum exhaustion, divergence, or overbought/oversold conditions. Stack them with momentum indicators and your signals get dramatically cleaner.
Moving Average + RSI
The combination of a 50 SMA trend filter and RSI momentum confirmation is one of the most robust frameworks in retail trading. The rule is simple: only take long signals when price is above the 50 SMA and RSI is recovering from below 40. Only take short signals when price is below the 50 SMA and RSI is rolling over from above 60.
For a complete primer on how RSI works before integrating it with your MA setup, start with What Is RSI? The Complete Beginner's Guide. If you're newer to indicator-based trading, RSI for Beginners: 5 Simple Rules to Start Trading Today gives you a practical foundation before layering in moving averages.
Moving Average + MACD
MACD is essentially a relationship between two EMAs — it's a natural companion to moving average analysis. When the MACD histogram turns positive at the same time the 20 EMA crosses above the 50 EMA, both signals are confirming the same trend shift. That confluence dramatically improves the quality of the entry. For a deep exploration of MACD-based setups, see MACD in Forex Trading: Master Currency Pair Strategies.
Moving Average + RSI Divergence
Divergence signals — where price makes a new high but RSI fails to confirm — become far more actionable when price is simultaneously pressing against a key moving average like the 200 SMA. The MA provides the structural context; the divergence provides the timing. RSI Divergence Explained: Master Bullish & Bearish Signals breaks down exactly how to identify these setups. For the more advanced version, Hidden RSI Divergence: The Advanced Signal Most Traders Miss covers the signals that fire during trend continuations — highly compatible with MA trend-following frameworks.
Price is retesting the 50 SMA from above while RSI shows a bearish divergence — lower RSI high against a higher price high. This dual signal (structural level + momentum failure) creates a high-quality short setup. Confirmation comes from a candle closing below the 50 SMA. If RSI recovers and pushes above its prior high, the divergence reading is void.
Moving Averages Across Asset Classes: What the Data Shows
Not all markets respond equally to moving average signals. This isn't intuition — it's measurable.
Stocks365 backtested 3,332 instances of price crossing below the 20 SMA across multiple asset classes and found a 50.9% win rate overall (profit factor: 1.06, 10-day holding). But the asset class breakdown tells the real story: crypto produced a 66.8% win rate on this signal, while forex came in at just 42.5% — a losing expectancy. Same signal, same setup, dramatically different outcomes depending on the market.
Why the gap? Crypto markets trend more persistently and exhibit stronger momentum characteristics. Forex pairs, especially majors, mean-revert more aggressively and respond to macro catalysts that override technical signals entirely. Moving averages work best in trending, momentum-driven environments. They struggle in choppy, range-bound conditions.
Know your market before committing to any MA-based strategy.
Advanced MT4/MT5 Moving Average Techniques
Multi-Timeframe MA Analysis
One of the most powerful — and underused — techniques is checking the same moving average across multiple timeframes. If the 50 SMA on the weekly chart is pointing up and price is above it, any short-term bearish signals on the 1-hour chart carry lower probability. The higher timeframe MA defines the regime; the lower timeframe MA defines the entry.
In MT5, use the multi-chart layout to display the weekly and daily views simultaneously. In MT4, open multiple chart windows manually for the same symbol at different timeframes.
Using MA as Dynamic Support and Resistance
Static horizontal support levels are useful. Moving averages offer something better — dynamic levels that move with price over time. In a strong uptrend, price repeatedly pulls back to the 20 EMA and bounces. Each successful bounce reinforces the level. Traders who recognize this use MA touches as entry triggers rather than waiting for crossovers — a technique that generates earlier, tighter entries with defined invalidation levels.
Applying the MA to RSI for Dual Confirmation
You can apply a moving average directly to the RSI oscillator in MT4 and MT5 — not just to the price chart. Add RSI to your chart first, then apply a 9-period EMA to the RSI line itself. RSI crossing above its own 9 EMA acts as a momentum confirmation signal that pairs cleanly with price-based MA setups. RSI Trendline Strategy: Master Drawing Lines for Better Signals extends this concept further, showing how trendlines on RSI reveal breakouts before they appear on the price chart.
For a complete operational framework on RSI-based trading, How to Use RSI in Trading: The Ultimate Step-by-Step Guide integrates all the pieces — including how moving averages and RSI work together as a system.
What to Watch For
- The 20 EMA retest after a crossover on tech stocks: When the 20 EMA crosses above the 50 SMA on a daily chart and price pulls back to tap the 20 EMA within three to five candles, watch for a bullish rejection candle (hammer, engulfing) as the continuation trigger. Volume declining on the pullback and expanding on the bounce confirms institutional interest.
- 200 SMA breakdowns on crypto with volume confirmation: When price breaks below the 200 SMA on a 4-hour chart with volume surging at least 1.5x the 20-period average, moving average bounce attempts typically fail within one to two candles. The 200 SMA flips from support to resistance rapidly in crypto — faster than in equities.
- Triple MA compression in low-volatility environments: When the 20, 50, and 200 SMAs converge within a tight band and price compresses between them, the subsequent expansion move tends to be sharp and sustained. The direction is confirmed by which side price closes on after the breakout candle — not during it.
- Golden cross forming on weekly charts during earnings seasons: A 50/200 SMA golden cross on the weekly chart of a large-cap stock carries stronger follow-through when it coincides with positive earnings momentum. The weekly MA signal filters out intraday noise and represents institutional repositioning rather than retail momentum.
- EMA slope steepening after a consolidation period: When a 20 EMA that has been nearly flat for 10 or more candles begins angling upward sharply, it signals fresh trend initiation rather than continuation. These early-trend setups often produce the cleanest risk/reward entries before the move becomes crowded.
⚡ How Stocks365 Uses Moving Averages
Moving averages are one of 12+ technical inputs inside the Stocks365 trust score system. Specifically, the relationship between price and key SMAs (20, 50, 200) contributes to our regime scoring layer — which determines whether a given asset is in a trending, ranging, or transitional state.
When price trades above all three SMAs in stacked bullish alignment, the regime score tilts positive and increases the weight given to bullish signals from other indicators in the model. When price breaks below the 200 SMA, the regime score shifts to caution mode regardless of shorter-term momentum readings.
This prevents the system from issuing aggressive long signals during structural downtrends — one of the most common failure modes in rules-based trading systems. You can see this scoring in action across every asset tracked on the Stocks365 signals dashboard, including individual signals like AAPL where moving average regime context is displayed alongside the trust score.
📌 Key Takeaways
- Adding a moving average on MT4 or MT5 takes under 60 seconds: Insert → Indicators → Trend → Moving Average.
- SMA works best for trend identification on higher timeframes; EMA reacts faster and suits intraday and momentum strategies.
- The 20, 50, and 200 SMAs are the three most impactful periods — stack all three for the clearest trend picture.
- Backtesting shows moving average signals perform very differently by asset class: crypto responds more strongly to SMA-based signals than forex does.
- Crossover signals work best when confirmed by a retest — enter on the pullback to the MA, not on the initial cross.
- Combine MAs with RSI and MACD to filter false signals and improve entry timing significantly.
- In MT5, use multi-chart layouts for multi-timeframe MA analysis — higher timeframe MA direction defines the trade bias.