
Bollinger Bands for Beginners: 5 Rules to Trade Safely in 2026
Most beginners look at Bollinger Bands and think they've found a crystal ball. Price touches the upper band — sell. Price touches the lower band — buy. Simple, right?
Wrong. That approach loses money consistently.
Bollinger Bands are one of the most misunderstood tools in retail trading. Used correctly, they reveal volatility structure, squeeze conditions, and potential breakout zones that most traders completely miss. Used incorrectly, they generate a stream of false signals that drain accounts slowly and painfully.
Stocks365 backtested 3,255 Bollinger Upper Band Touch signals across multiple asset classes and found a 49.6% win rate with a profit factor of just 0.88 over a 10-day holding period. That means blindly fading every upper band touch — one of the most popular beginner strategies — is a losing approach on average. The edge only appears when you layer in the right conditions. We'll show you exactly what those are.
These five rules will help you stop losing money on bad Bollinger Band setups and start reading the market the way professionals do.
What Are Bollinger Bands? A Quick Foundation
Before the rules, you need the foundation. Bollinger Bands consist of three lines plotted on a price chart:
- The Middle Band: A 20-period Simple Moving Average (SMA) — the baseline of the indicator
- The Upper Band: Middle Band + 2 standard deviations
- The Lower Band: Middle Band − 2 standard deviations
The bands expand when volatility increases. They contract when volatility decreases. That expansion and contraction is the entire story. Everything else flows from understanding that dynamic.
Want to go deeper on the mechanics? Our guide on How Bollinger Bands Work: Master the Math Behind It breaks down the standard deviation calculations in full detail.
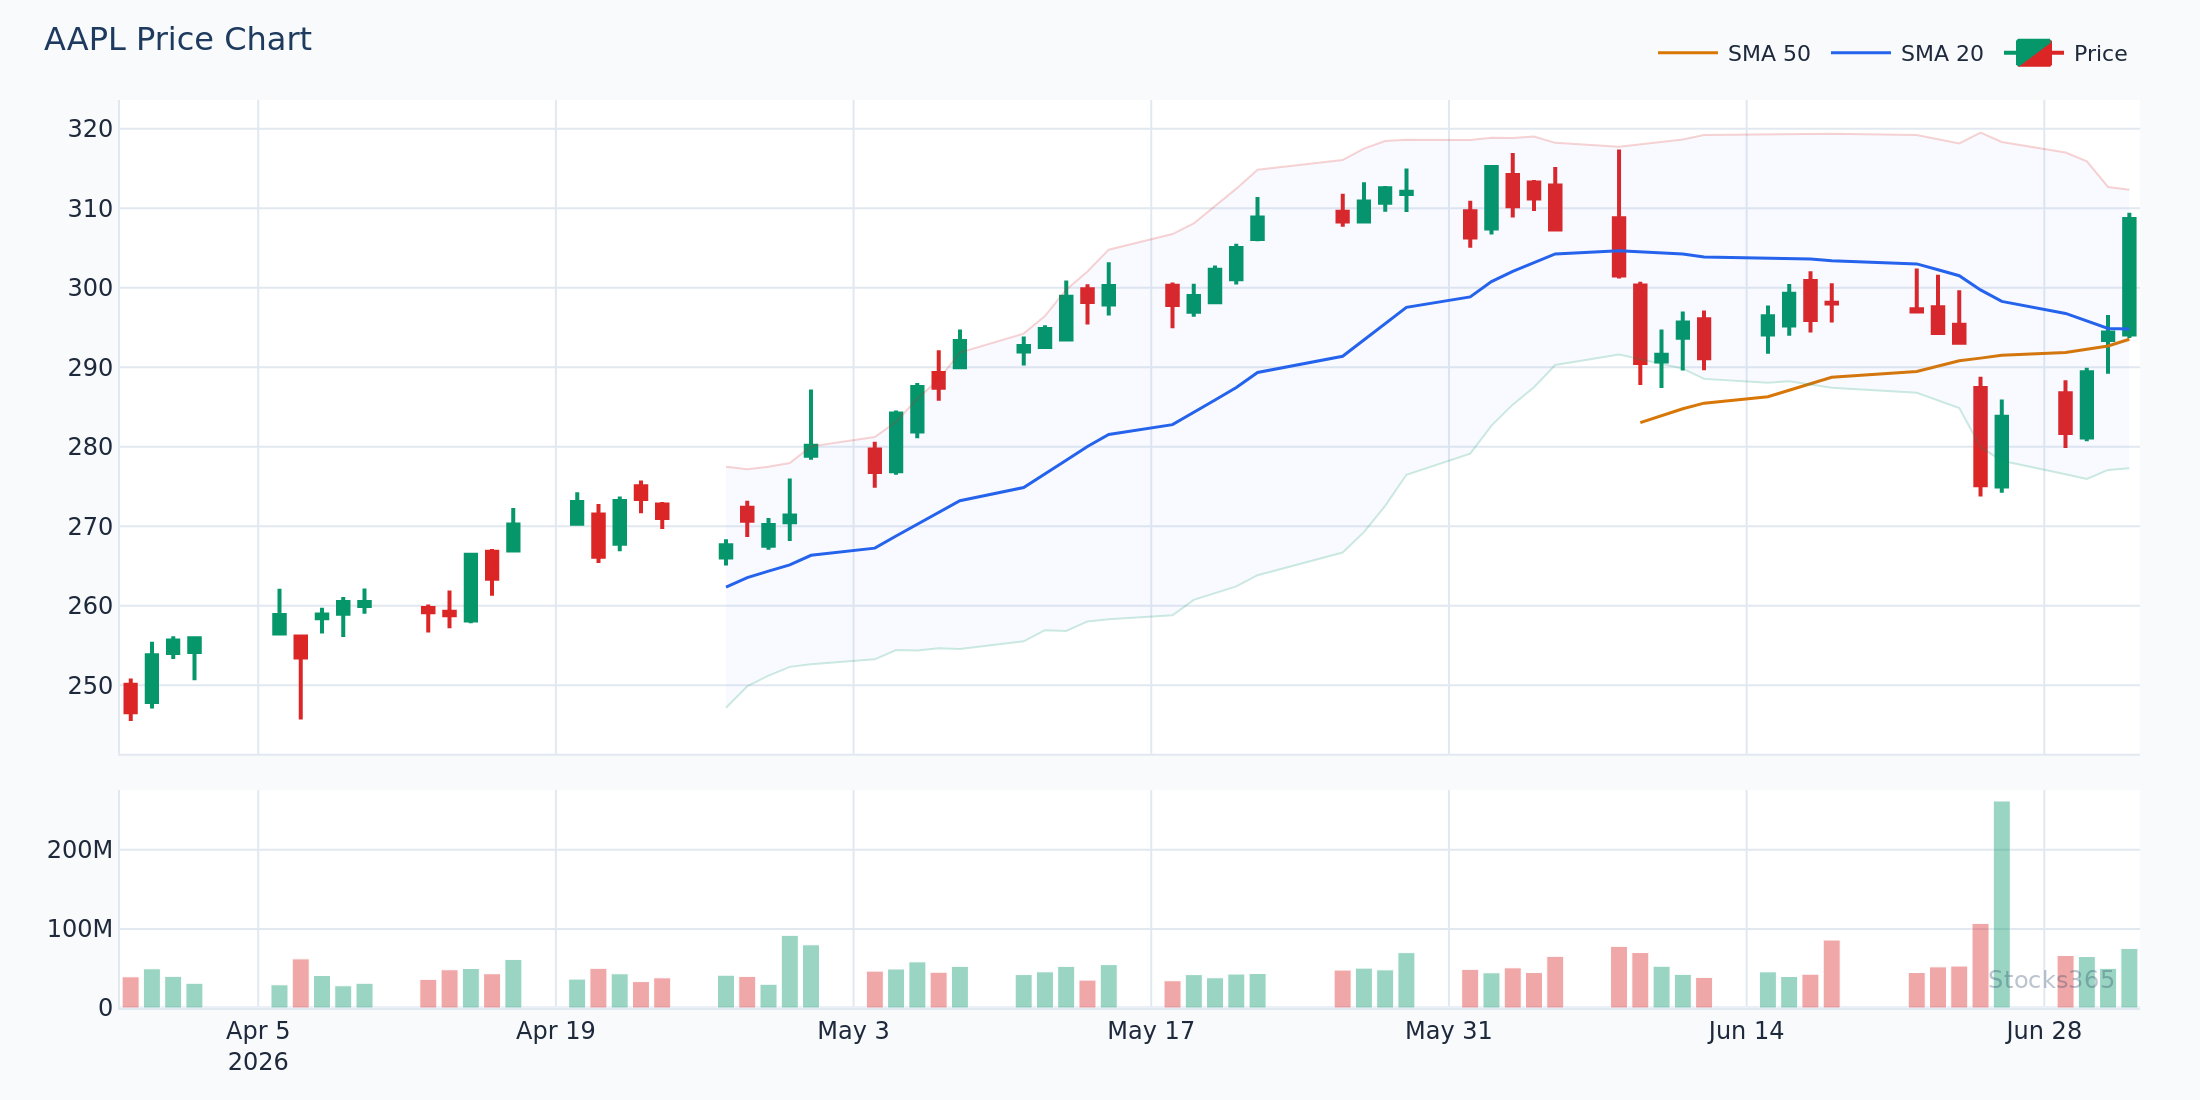
This chart shows a classic Bollinger squeeze resolving into a directional expansion. When the upper and lower bands converge tightly, volatility is compressed — and compressed volatility almost always precedes a significant move. The direction of the breakout, not the squeeze itself, is what confirms the trade. A close above the upper band on rising volume validates the bullish breakout; a reversal back inside the bands within one or two candles invalidates it immediately.
Rule 1 — Never Trade Band Touches Alone
This is the single most important rule for beginners. Do not treat a price touch of the upper or lower band as a trading signal by itself.
Here's what most traders get wrong: they assume Bollinger Bands act like a ceiling and a floor. They see price reach the upper band and immediately short it. They see price fall to the lower band and immediately buy it. In strongly trending markets, price can walk the upper band for days or weeks without pulling back at all. Shorting every upper band touch during a powerful uptrend is how accounts get destroyed.
The bands are a volatility envelope, not a price boundary. A touch tells you where price is relative to recent volatility. It tells you nothing about what price will do next.
What you need is confirmation. Before acting on any band touch, check at least one of these:
- A momentum oscillator showing divergence (RSI failing to make a new high as price makes a new high)
- A candlestick reversal pattern at the band (bearish engulfing, shooting star, pin bar)
- Volume declining on the touch, suggesting the move is losing conviction
Pair Bollinger Bands with the RSI using our RSI Indicator: The Complete Trading Guide for 2026 — the combination filters out a significant portion of false band-touch signals.
Rule 2 — Respect the Squeeze Before Everything Else
The Bollinger Squeeze is the most reliable setup the indicator produces. Full stop.
A squeeze occurs when the bands contract to their narrowest point over a defined lookback period — typically measured using a Bandwidth indicator or by visual identification of converging bands. This compression signals that the market is coiling. Energy is building. A breakout is coming.
Stocks365 backtested 14,266 Bollinger Squeeze Breakout signals and found a profit factor of 1.03 — the only Bollinger Band setup in our analysis that crosses into positive expectancy territory. The best-performing asset class was crypto at 51.8%, while forex lagged at 47.1%. Those numbers might look modest, but in combination with proper risk management, a positive profit factor creates consistent, compounding results over time.
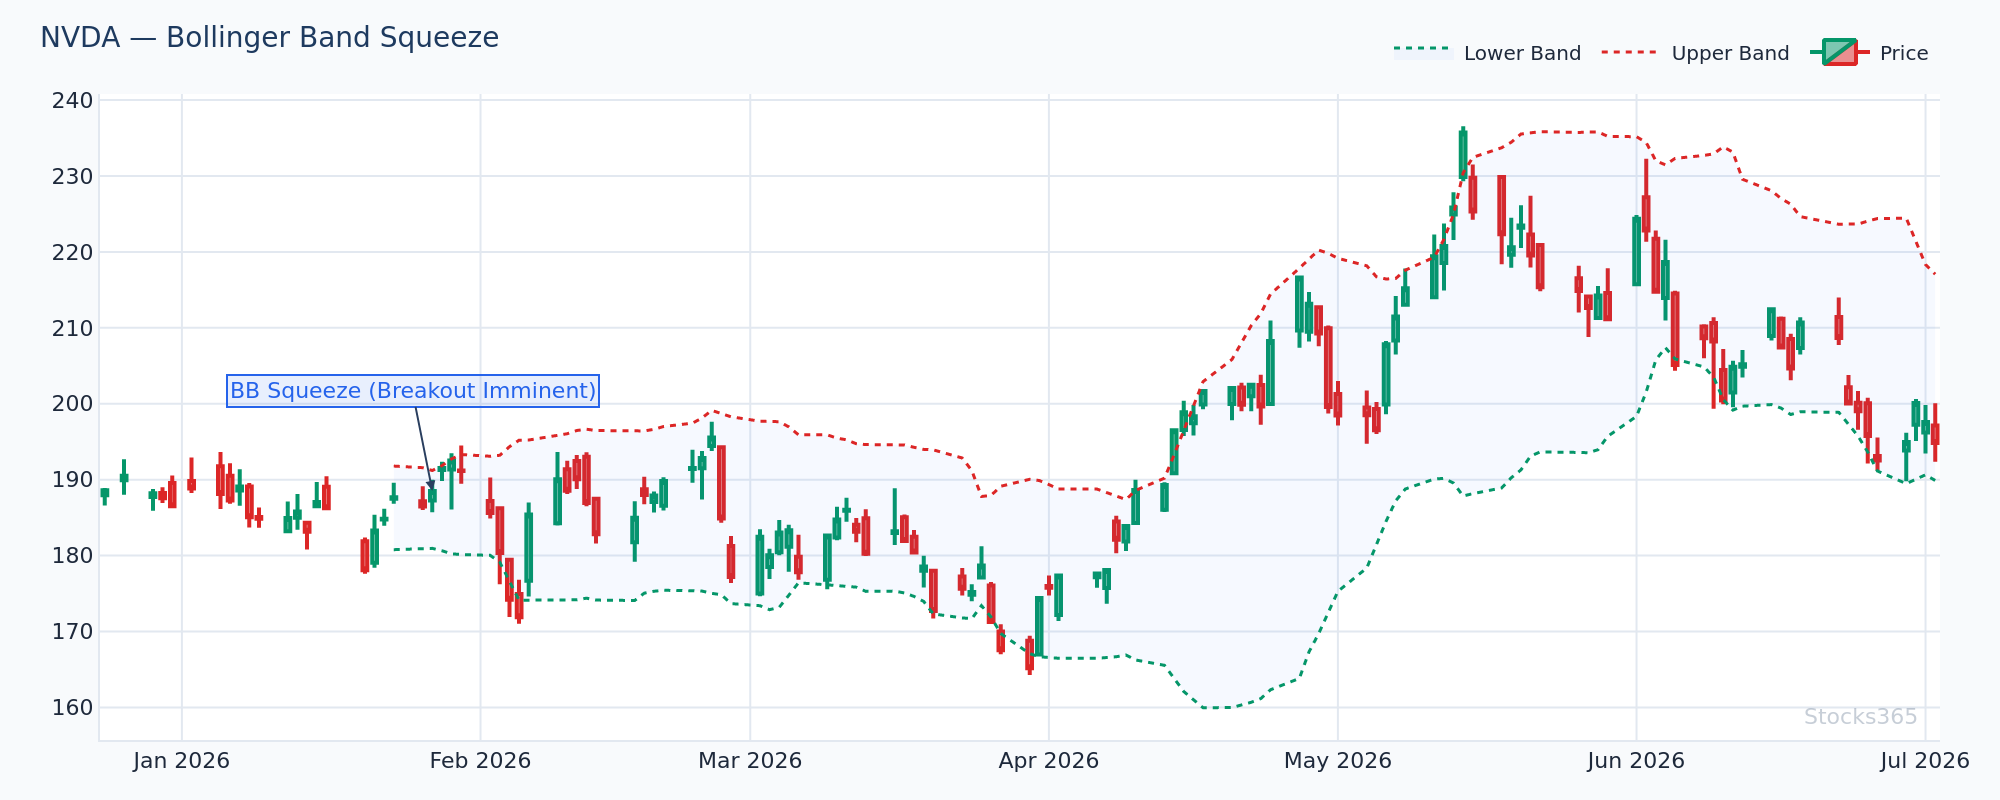
When band width compresses to its lowest level in 20 or more periods, the market is signaling an impending volatility expansion. The chart above shows a textbook squeeze setup where price consolidates in a tight range within narrowing bands. Once price closes decisively above or below the middle band with expanding band width, the breakout direction is established. A failure to follow through — price re-entering the squeeze range within two candles — invalidates the trade entirely.
The squeeze does not tell you which direction price breaks. That's the job of volume, trend context, and momentum confirmation. Always wait for the break, not the squeeze itself.
Rule 3 — Use the Middle Band as Your Trend Filter
Beginners focus obsessively on the outer bands. Experienced traders watch the middle band.
The 20-period SMA at the center of Bollinger Bands is one of the most important dynamic levels on any chart. In an uptrend, price consistently bounces off the middle band and continues higher. In a downtrend, price consistently fails at the middle band and continues lower. The middle band acts as the pivot point between bullish and bearish regimes.
Here's the rule: only take long setups when price is above the middle band and trending higher. Only take short setups when price is below the middle band and trending lower. This one filter eliminates a large percentage of counter-trend trades that look attractive on the surface but fail at execution.
Think of the middle band as your trend permission line. Above it, you have permission to go long. Below it, you have permission to go short. Cross-trend trades require exceptional confirmation — and beginners should avoid them entirely.
For a deeper understanding of how moving averages create trend structure, read our Moving Average Crossover Strategy: Complete Trading Guide.
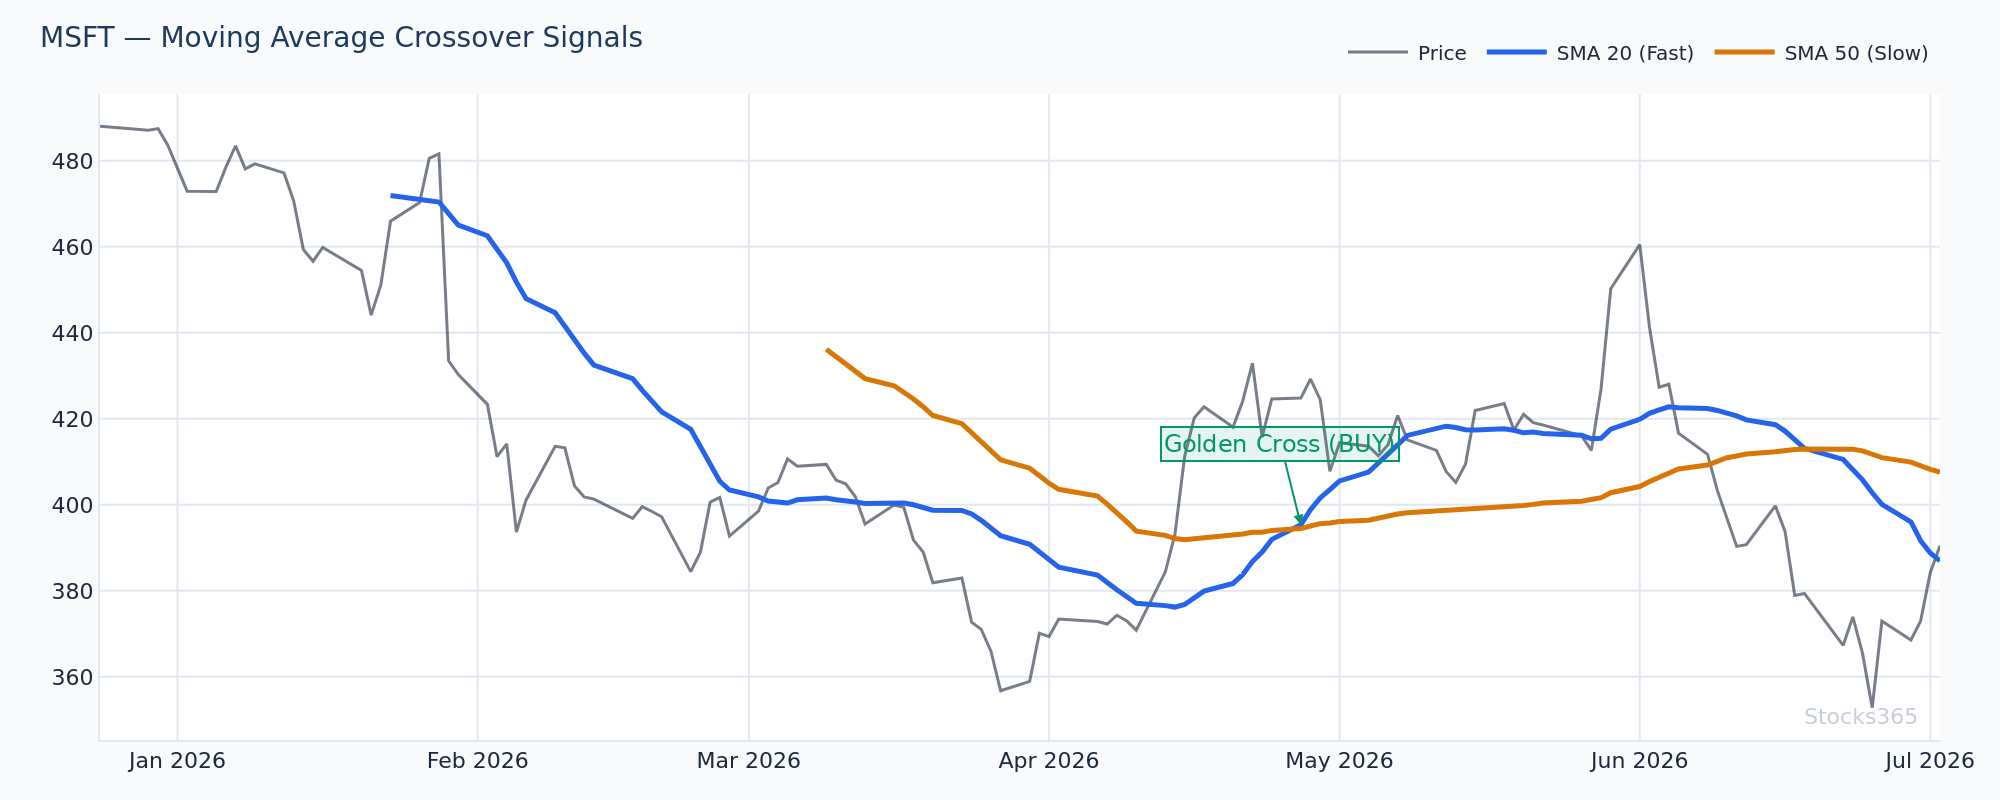
Notice how, in a confirmed uptrend, price repeatedly tests the middle band and finds support before continuing higher. Each successful test and bounce reinforces the trend structure and provides a low-risk entry point with the middle band acting as natural stop placement. The pattern breaks down — and the trend weakens — when price closes below the middle band on above-average volume, signaling a potential regime change.
Rule 4 — Combine Bollinger Bands With One Momentum Oscillator
Bollinger Bands measure volatility. They do not measure momentum or trend strength. That gap needs to be filled.
Adding a single momentum oscillator transforms Bollinger Bands from a volatility tool into a complete trading system. The most effective combinations for beginners:
Bollinger Bands + RSI
RSI divergence at the bands is one of the cleanest setups in technical analysis. When price makes a new high touching the upper band but RSI fails to confirm with a new high — that's bearish divergence. When price makes a new low touching the lower band but RSI fails to confirm — that's bullish divergence. These divergences signal exhaustion before the reversal begins.
Bollinger Bands + Stochastic Oscillator
Our analysis of 3,026 BB + Stochastic Double Overbought signals found a 49.9% win rate overall — but crypto led significantly at 58.0%, while commodities came in worst at 40.7%. This asset class variation is critical. The double overbought setup (Stochastic above 80 while price is at the upper band) works meaningfully in crypto markets but destroys edge in commodity trading. Know where your setup has an actual historical edge before committing capital.
Check out How to Read the Stochastic Oscillator: Step-by-Step to understand how to combine it with Bollinger Bands correctly, and see our MACD vs Stochastic Oscillator: Key Differences Explained to decide which oscillator suits your trading style.
The rule is simple: pick one oscillator, learn it deeply, and use it consistently. Indicator overload is a beginner trap. One well-understood combination beats five poorly understood indicators every time.
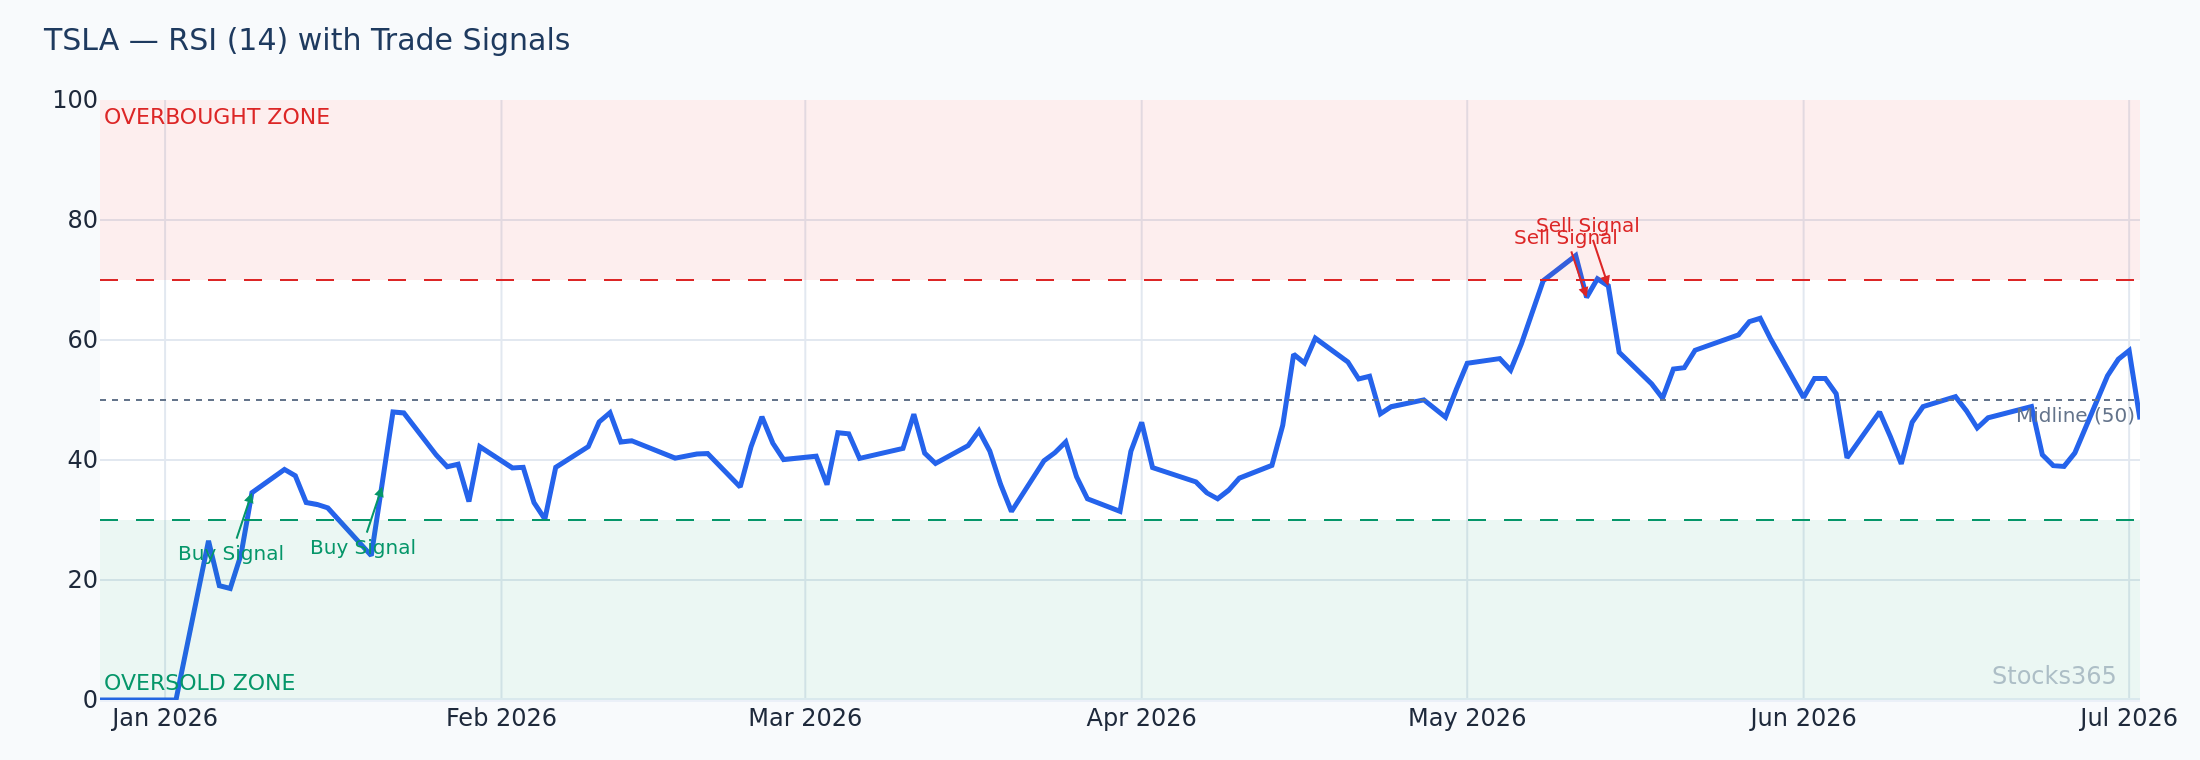
This chart illustrates a bearish RSI divergence occurring precisely as price reaches the upper Bollinger Band. Price prints a higher high while RSI prints a lower high — a classic sign of weakening momentum despite the surface-level price strength. The signal gains validity when price then closes back below the upper band on the following candle. Confirmation fails if RSI instead pushes to new highs alongside continued price strength, indicating the trend has more fuel.
Rule 5 — Adjust Your Settings to Match Your Timeframe
Default settings are a starting point, not a permanent answer.
The standard Bollinger Band settings — 20-period SMA, 2 standard deviations — work well on daily charts for swing traders. But beginners applying the same settings to 5-minute charts or weekly charts get noisy, misleading signals. The settings need to match the timeframe and trading style.
Here are practical adjustments based on trading style:
- Day trading (5-15 minute charts): Consider shortening the period to 10-15 and reducing standard deviations to 1.5 to capture intraday volatility more responsively
- Swing trading (daily charts): Standard 20-period, 2 standard deviations — this is the most extensively backtested configuration
- Position trading (weekly charts): Extend the period to 50 for smoother, longer-term trend visualization with reduced noise
- Crypto trading: Crypto's elevated volatility often benefits from wider bands — 2.5 standard deviations — to reduce false breakout signals
For crypto-specific Bollinger Band strategies, our dedicated guide on Bollinger Bands for Crypto Trading: Bitcoin & Altcoins covers the necessary adjustments in detail.
The underlying principle: match your indicator settings to the rhythm of the market you're trading. A setting that works on one timeframe produces garbage on another.
Common Bollinger Band Mistakes Beginners Make
Beyond the five rules, several recurring mistakes consistently hurt beginner performance:
Treating Every Breakout as Valid
Price breaking above the upper band is not automatically a buy signal. In ranging markets, it's often the beginning of a mean-reversion move. Always check whether the overall market is in a trend or range before interpreting a breakout. Trending markets reward breakout continuation. Ranging markets punish it.
Ignoring Volume on Squeezes
A squeeze breakout on declining volume is a trap. Volume must confirm the directional move. When price breaks out of a Bollinger squeeze on volume that is 1.5x or higher than the 20-period average, the breakout has meaningful conviction. Low-volume breakouts fail at a much higher rate.
Using Bollinger Bands in Isolation
This loops back to Rule 4, but it deserves its own mention. Bollinger Bands were designed to be used in combination with other analysis. John Bollinger himself documented over 20 confirmed signals using the bands in conjunction with other indicators. Standalone band signals have no reliable edge, as our backtested data confirms.
Avoid the moving average equivalent of this mistake too — read Moving Averages: 7 Beginner Mistakes to Avoid for patterns that apply directly to band-based systems.
Chasing After the Signal Has Already Played Out
This is emotional trading, not technical trading. If you missed the squeeze breakout entry, you missed it. Wait for the next setup. Chasing a move that's already extended from the bands dramatically worsens your risk-reward ratio and places your stop far too wide to manage properly.
How to Use Bollinger Bands for Long-Term Investing
Bollinger Bands aren't only for active traders. Long-term investors use them effectively on weekly and monthly charts to time entries into existing trend positions.
The core approach: when a stock you want to own long-term pulls back to the lower Bollinger Band on the weekly chart while remaining in a multi-year uptrend, that's a statistically sound entry zone. You're buying a temporary volatility expansion during a healthy trend — not catching a falling knife.
Pair this with the strategies in Moving Averages for Long-Term Investors: Master Entry Points for a complete framework around timing long-term positions using volatility-based indicators.
What to Watch For
- Bollinger Squeeze with band width at a multi-week low: When the Bollinger Bandwidth indicator drops below its 20th percentile over a 125-day lookback, a volatility expansion is imminent. The subsequent directional move often spans 2–3 ATR. Wait for the breakout candle to close before committing — false starts are common during the final compression phase.
- Upper band touch with RSI divergence on large-cap tech: When price reaches the upper band while RSI prints a lower high than the previous upper band touch, the momentum divergence is statistically meaningful. This setup sharpens further when volume is declining on the second price high, confirming distribution.
- Middle band reclaim after downtrend: When a stock that has been trading below the 20-SMA for several weeks reclaims the middle band on above-average volume, this signals a potential regime change. The first successful test of the middle band as support after reclaim is often the cleanest swing long entry.
- Double Overbought setup in crypto: When Stochastic crosses above 80 simultaneously with price touching the upper Bollinger Band in crypto markets, our backtested data across 3,026 signals shows a 58.0% win rate — the highest of any asset class in this setup. Use it selectively and always define your exit before entry.
- W-bottom pattern at the lower band: A price pattern that tests the lower band, bounces to the middle band, then retests near (but not below) the lower band forms a W-bottom. This pattern, combined with a Stochastic bullish crossover on the second low, frequently precedes a sustained recovery toward the upper band.
How Stocks365 Uses Bollinger Bands in Its Trust Score System
📊 How Stocks365 Integrates Bollinger Bands
Bollinger Bands are one of 12+ indicators that feed directly into the Stocks365 Trust Score system. Specifically, band width and squeeze conditions contribute to the Volatility Scoring component of the Trust Score, which assesses whether current market conditions favor trend-following or mean-reversion setups.
When a stock's Bollinger Bandwidth drops below a threshold percentile, the Trust Score flags the asset as being in a pre-breakout compression state, prompting the regime scoring layer to increase weighting on breakout-confirmation signals over fade signals.
Band position relative to the 20-SMA also contributes to the Agreement Scoring layer — where multiple indicators must align directionally before the Trust Score reaches actionable territory. A band touch alone never triggers a high Trust Score signal. It's the confluence of band structure, momentum oscillators, and volume behavior that moves the needle.
You can see these signals in action on the Stocks365 signals dashboard — each signal card displays the underlying indicator confluence that produced the Trust Score, including Bollinger Band conditions. Explore individual stock setups like the AAPL signal page to see how band conditions interact with other indicators in real time.
Our research dashboard publishes ongoing backtested results across indicator combinations so you can verify which setups carry genuine statistical edge — and which don't.
Key Takeaways
- ✅ Never trade band touches alone — always require momentum or candlestick confirmation before entering
- ✅ The Bollinger Squeeze is the highest-probability setup — it's the only configuration in our backtested data with a positive profit factor (1.03 across 14,266 signals)
- ✅ Use the middle band as your trend filter — only trade long above it, only trade short below it
- ✅ Pair with one momentum oscillator — RSI or Stochastic, not both simultaneously, not five indicators at once
- ✅ Adjust settings to your timeframe — default 20/2 settings work for daily swing trading; other timeframes require adaptation
- ✅ Asset class matters — Bollinger Band strategies perform best in crypto, weakest in commodities and forex based on our backtested data
- ✅ Volume confirms everything — no breakout, bounce, or squeeze resolution is valid without volume participation
Frequently Asked Questions
What are Bollinger Bands and how do they work for beginners?
Bollinger Bands are a volatility indicator consisting of three lines: a 20-period Simple Moving Average in the center, and upper and lower bands placed two standard deviations away. The bands expand when volatility increases and contract when volatility decreases. For beginners, the most important concept is that band width tells you about market volatility conditions — not directly about price direction. Price touching the bands signals a relative volatility extreme, but requires additional confirmation before trading.
Is a Bollinger Band touch a buy or sell signal?
Not by itself. A price touch of the upper band is not automatically a sell signal, and a touch of the lower band is not automatically a buy signal. In trending markets, price can walk the upper band for extended periods. The touch becomes meaningful only when combined with a momentum divergence (RSI or Stochastic), a reversal candlestick pattern, or declining volume — all of which suggest the move is losing conviction. Our backtested data on 3,255 upper band touch signals shows a 49.6% win rate without additional filters — effectively a coin flip with negative expectancy.
What is a Bollinger Band squeeze and why does it matter?
A Bollinger Band squeeze occurs when the upper and lower bands converge to their narrowest point over a set period, indicating that volatility has compressed significantly. Periods of low volatility consistently precede periods of high volatility — that's the core principle. The squeeze itself doesn't tell you which direction price will break, but it signals that a significant move is loading. Our analysis of 14,266 squeeze breakout signals produced a profit factor of 1.03 — the only positive-expectancy Bollinger Band setup in our backtested database, which is why it deserves priority attention from beginners.
What is the best indicator to combine with Bollinger Bands?
For beginners, the RSI (Relative Strength Index) is the most practical companion to Bollinger Bands. RSI divergence at the bands provides clean, visual confirmation that price momentum is weakening before a reversal, reducing false signal entry significantly. The Stochastic Oscillator is also effective, particularly in crypto markets where our backtested data on the double overbought setup shows a 58.0% win rate. Choose one oscillator, learn it thoroughly, and apply it consistently rather than stacking multiple indicators.
Do Bollinger Bands work differently in crypto vs stocks?
Yes, meaningfully so. Crypto markets exhibit higher baseline volatility, which affects how Bollinger Band signals perform. Our backtested data consistently shows crypto outperforming other asset classes across Bollinger Band setups — 56.7% win rate for upper band touches versus 41.5% in commodities, and 58.0% for the double overbought Stochastic combination versus 40.7% in commodities. For crypto-specific strategy adjustments, including optimal band width settings for digital assets, see our dedicated guide on Bollinger Bands for Crypto Trading: Bitcoin & Altcoins.