
Bollinger Bands Buy and Sell Signals: The Complete Trading Guide
Bollinger Bands are one of the most widely used technical indicators in trading. They appear on millions of charts every day. But most traders misread them — and it costs them real money.
This guide breaks down exactly how Bollinger Bands buy and sell signals work, where they consistently outperform, and where they quietly bleed accounts dry. No fluff. No generic advice. Just the mechanics, the edge, and the honest truth about what the data actually shows.
What Are Bollinger Bands? A Quick Primer
Bollinger Bands were developed by John Bollinger in the early 1980s. The indicator plots three lines on a price chart:
- Middle Band: A 20-period Simple Moving Average (SMA)
- Upper Band: Middle Band + 2 standard deviations
- Lower Band: Middle Band − 2 standard deviations
The bands expand during high volatility and contract during low volatility. That contraction — called the Bollinger Squeeze — is often where the most powerful signals originate.
Statistically, price stays within the bands roughly 95% of the time. When it breaks outside, something significant is happening — or about to reverse. The question is always: which one?
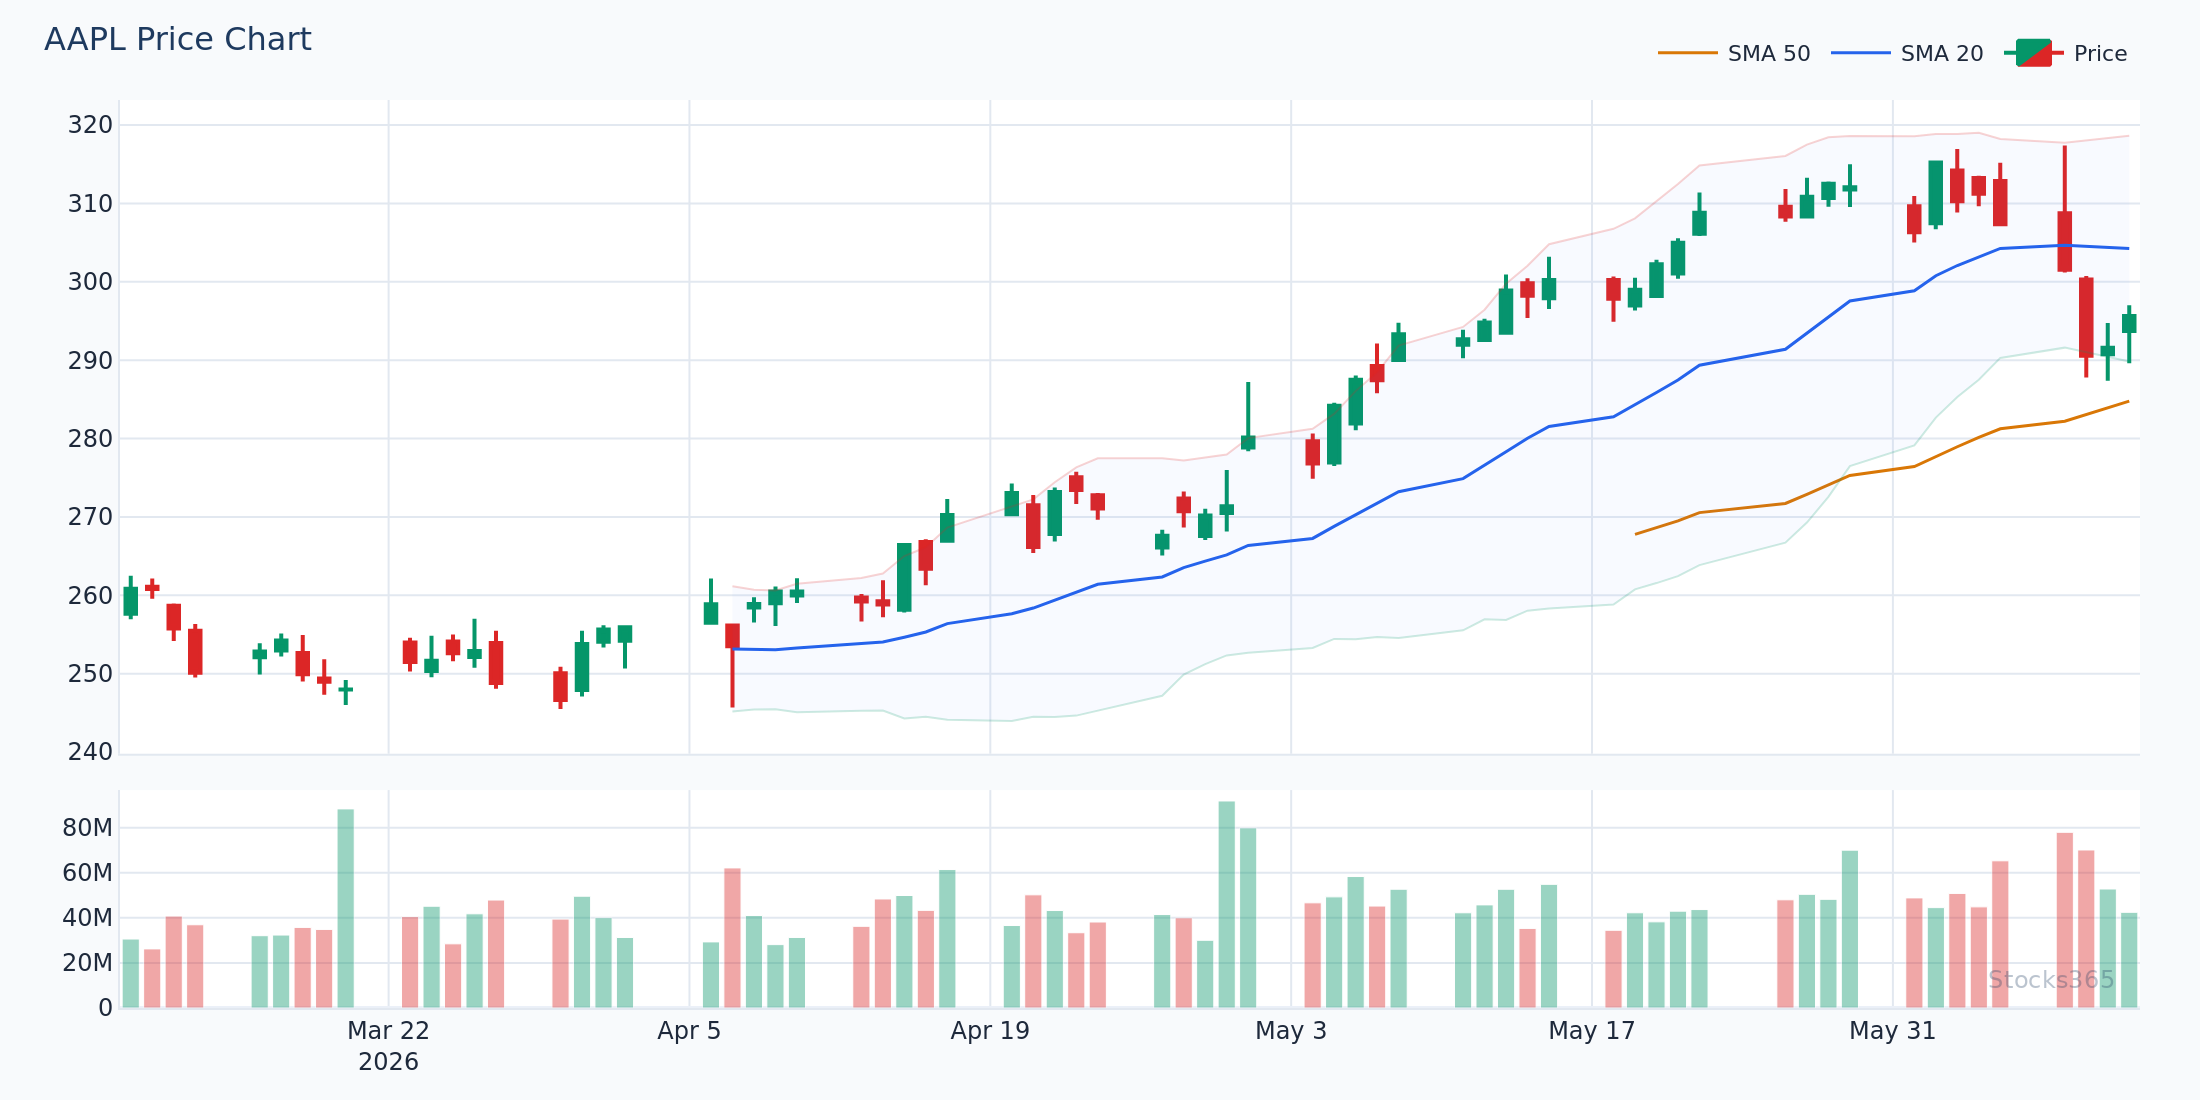
This chart shows the classic Bollinger Band envelope tightening around price before a directional expansion. When the bands compress like this and price coils near the midline, the next significant candle often determines the trend for the coming sessions. A clean breakout above the upper band on rising volume confirms the move. A failed breakout that immediately reverses back inside the bands is the first warning that the signal is weak.
How Bollinger Bands Buy Signals Work
The Lower Band Touch (Mean Reversion Buy)
The most basic buy signal: price touches or briefly closes below the lower Bollinger Band. The theory is that price has moved too far, too fast, and a snap back toward the 20-SMA is statistically likely.
This works. In range-bound, low-trending markets, the lower band acts like a rubber band. But in a strong downtrend, price can walk the lower band for days — even weeks — before any meaningful bounce occurs.
Here's what most traders get wrong: They treat the lower band touch as an automatic buy signal. It isn't. A band touch is a condition, not a signal. The actual signal is the confirmation candle — a bullish engulfing, a pin bar rejection, or a close back above the lower band with volume. Without confirmation, you're catching falling knives.
The Bollinger Squeeze Breakout (Expansion Buy)
This is the setup serious traders watch. When the bands compress tightly — bandwidth drops to its lowest levels in 20+ bars — volatility is coiling. The market is deciding its next move. When price breaks out of that squeeze with conviction, the resulting move is often sharp and sustained.
Stocks365 backtested 14,266 Bollinger Squeeze Breakout signals across equities, crypto, forex, and commodities — and found a profit factor of 1.03 with a 49.5% win rate over a 10-day holding period. That's not a massive edge on its own. But the breakouts in crypto specifically delivered a 51.8% win rate, while forex lagged at 47.1%. Asset class matters enormously here. You can explore the full breakdown in our research dashboard.
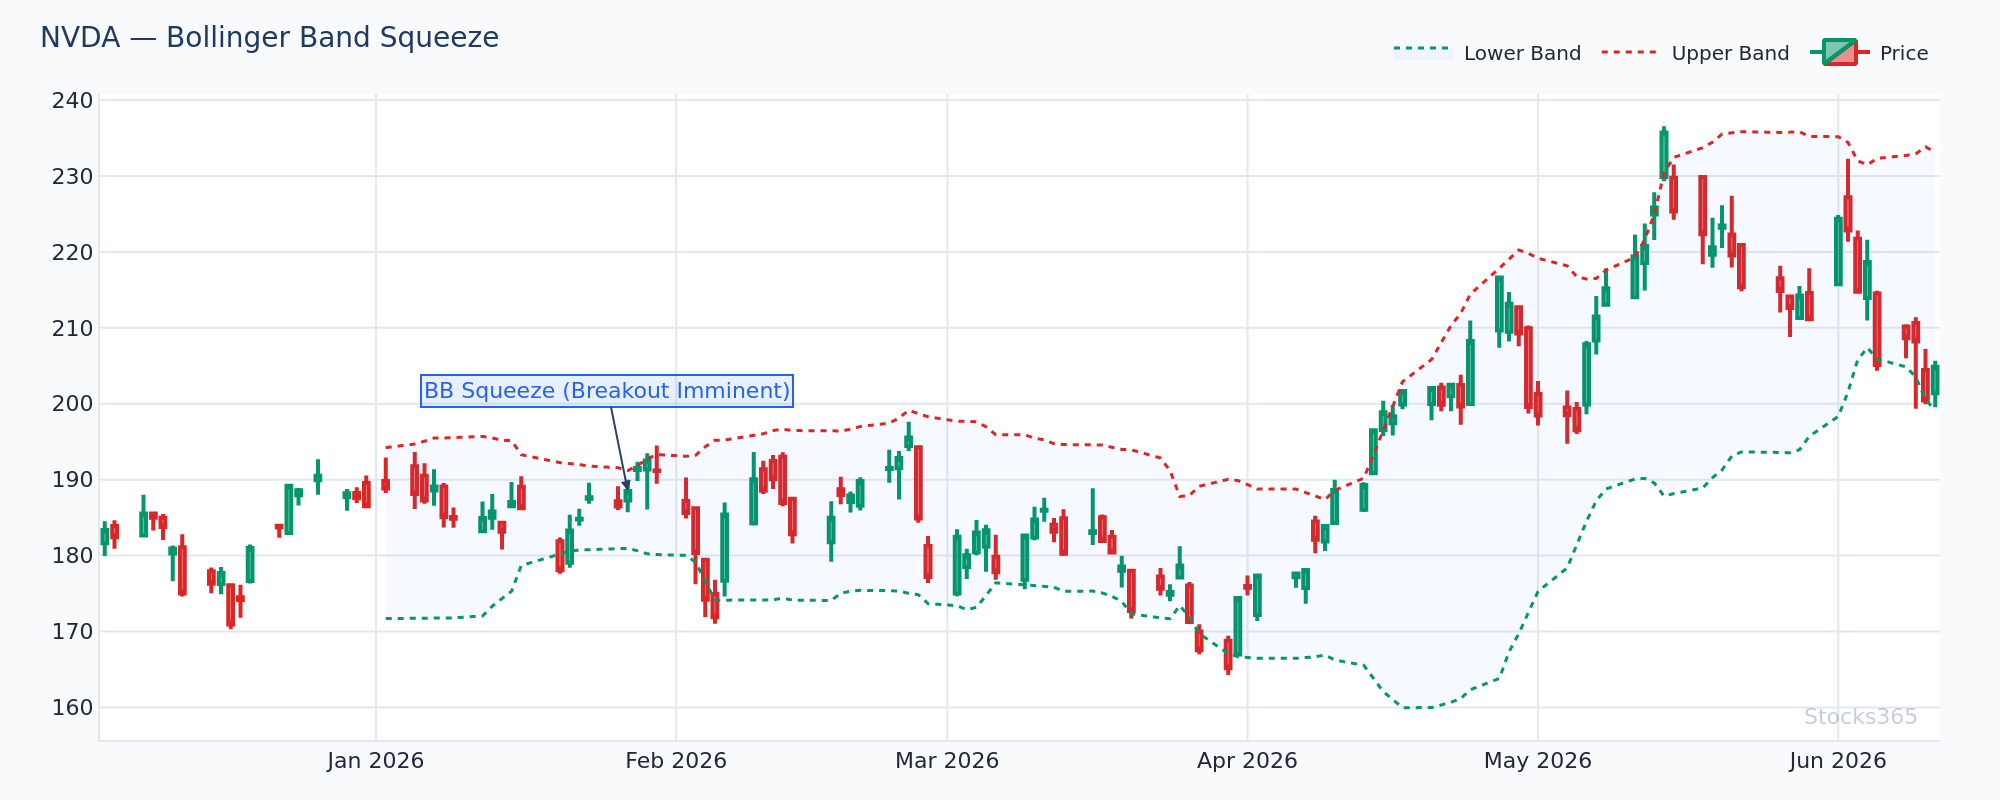
This squeeze setup shows the upper and lower bands converging to their narrowest width in over a month, with price consolidating just above the 20-SMA. When the breakout candle closes above the upper band with volume at least 1.5x the 20-day average, the pattern is confirmed. A close back below the midline within two sessions invalidates the breakout and signals a likely fade back into the range.
The W-Pattern (Double Bottom Within Bands)
Price touches the lower band, bounces toward the midline, then pulls back again — but the second low stays above the lower band. That's a classic W-pattern Bollinger setup. The second touch failing to reach the band signals diminishing selling pressure. A break above the midline confirms the long setup.
This pattern is more reliable than a single lower band touch because it shows the market actually defending a level across two separate tests.
How Bollinger Bands Sell Signals Work
The Upper Band Touch (Mean Reversion Sell)
Price touches or closes above the upper Bollinger Band. In sideways markets, this signals potential exhaustion. In trending markets, it often signals continuation — price can ride the upper band for an extended period in a strong bull trend.
Our analysis of 3,255 upper band touch signals found a win rate of just 49.6% with a profit factor of 0.88 over a 10-day holding period. Crypto showed the best results at 56.7%, while commodities dragged to 41.5%. The baseline data is clear: fading upper band touches in commodities is a consistent money-loser.
The M-Pattern (Double Top Within Bands)
The mirror image of the W-pattern. Price tags the upper band, pulls back to the midline, rallies again — but the second high fails to reach the upper band. Selling pressure is building. A break below the 20-SMA confirms the short setup.
This is one of the cleaner reversal signals Bollinger Bands generate. Two tests, diminishing momentum, structural break. That's a complete setup.
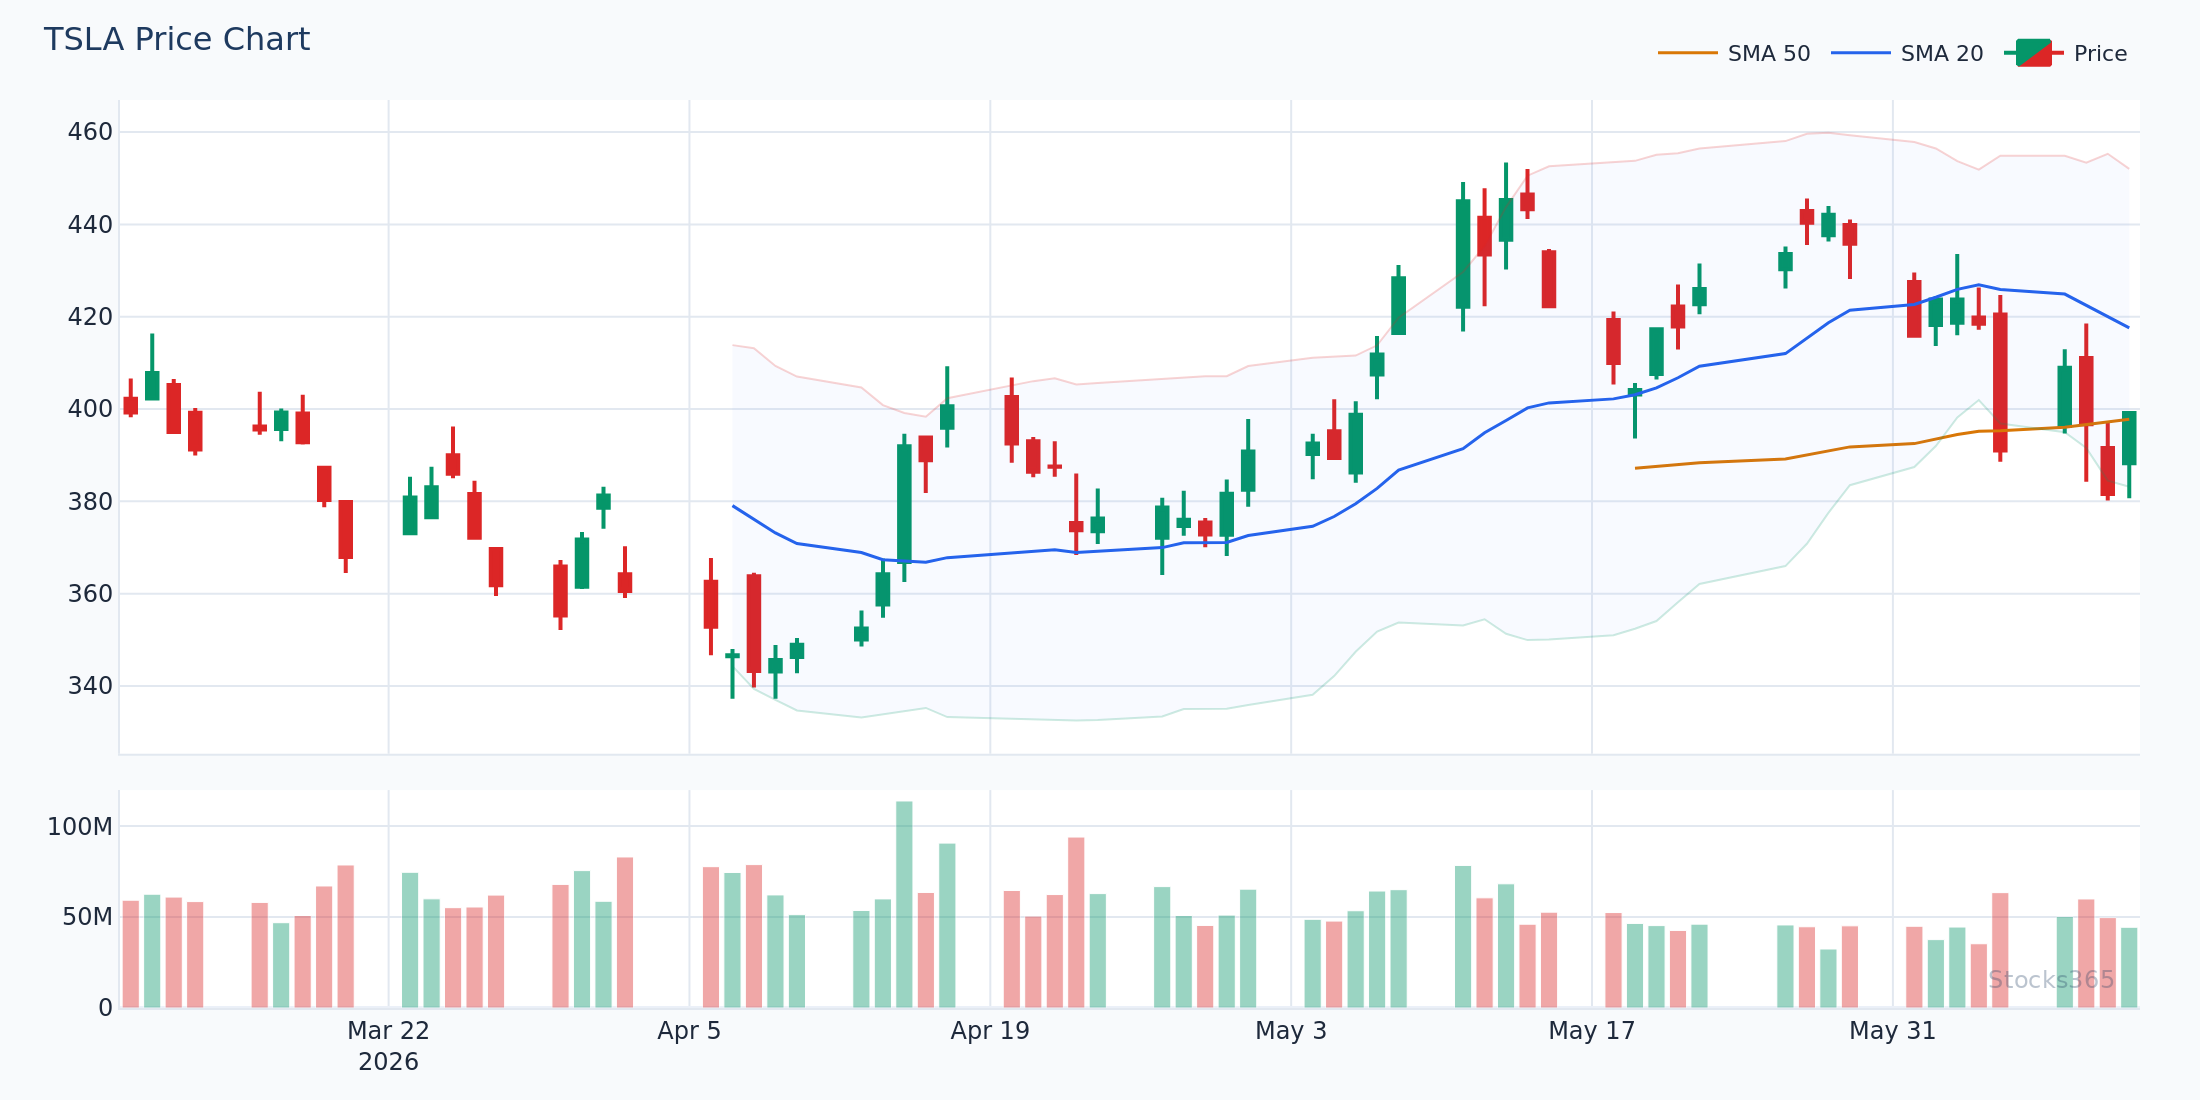
The M-pattern here shows the first high closing above the upper band with strong momentum, followed by a pullback to the 20-SMA midline, then a second rally that stalls just inside the upper band. The divergence between the two highs — one outside the band, one inside — is the core of the signal. Confirmation comes when price breaks and closes below the 20-SMA. Failure to break below the midline within 3-4 sessions typically means the trend is resuming upward.
Combining Bollinger Bands With Other Indicators
Bollinger Bands generate better signals when layered with momentum and volume tools. Using them alone leaves too much noise in the system.
Bollinger Bands + Stochastic Oscillator
One of the most popular combinations. When price touches the lower band and the Stochastic Oscillator is below 20 (oversold), the probability of a bounce increases. When both align at the upper band with Stochastic above 80, the short setup becomes more credible.
Stocks365 backtested this exact dual-signal setup — BB + Stochastic Double Overbought — across 3,026 signals and found a 49.9% win rate with a profit factor of 0.91. Crypto led with a 58.0% win rate; commodities were the worst at 40.7%. If you trade this combination, crypto is where the edge concentrates. For a deeper dive into Stochastic mechanics, read our guide on Fast vs Slow Stochastic Oscillator: Key Differences.
Bollinger Bands + RSI
RSI adds a momentum lens that Bollinger Bands lack. A lower band touch paired with RSI dropping below 30 strengthens the mean-reversion buy case. An upper band touch with RSI above 70 reinforces the fade. But the most powerful combo is RSI divergence at the bands — price makes a new low at the lower band while RSI makes a higher low. That divergence is the market whispering that sellers are losing power.
Learn how to draw RSI trendlines to catch these divergences early in our RSI Trendline Strategy guide. For adding volume to the equation, RSI and Volume Analysis covers the combination in full detail.
Bollinger Bands + Volume
Volume is the one variable that separates real breakouts from false ones. A squeeze breakout on 2x average volume? Pay attention. A breakout on thin volume? Ignore it — or fade it. Volume-weighted tools like the VWMA give context to where real institutional interest sits. Our Volume-Weighted Moving Average complete guide explains exactly how to integrate this into your band analysis.
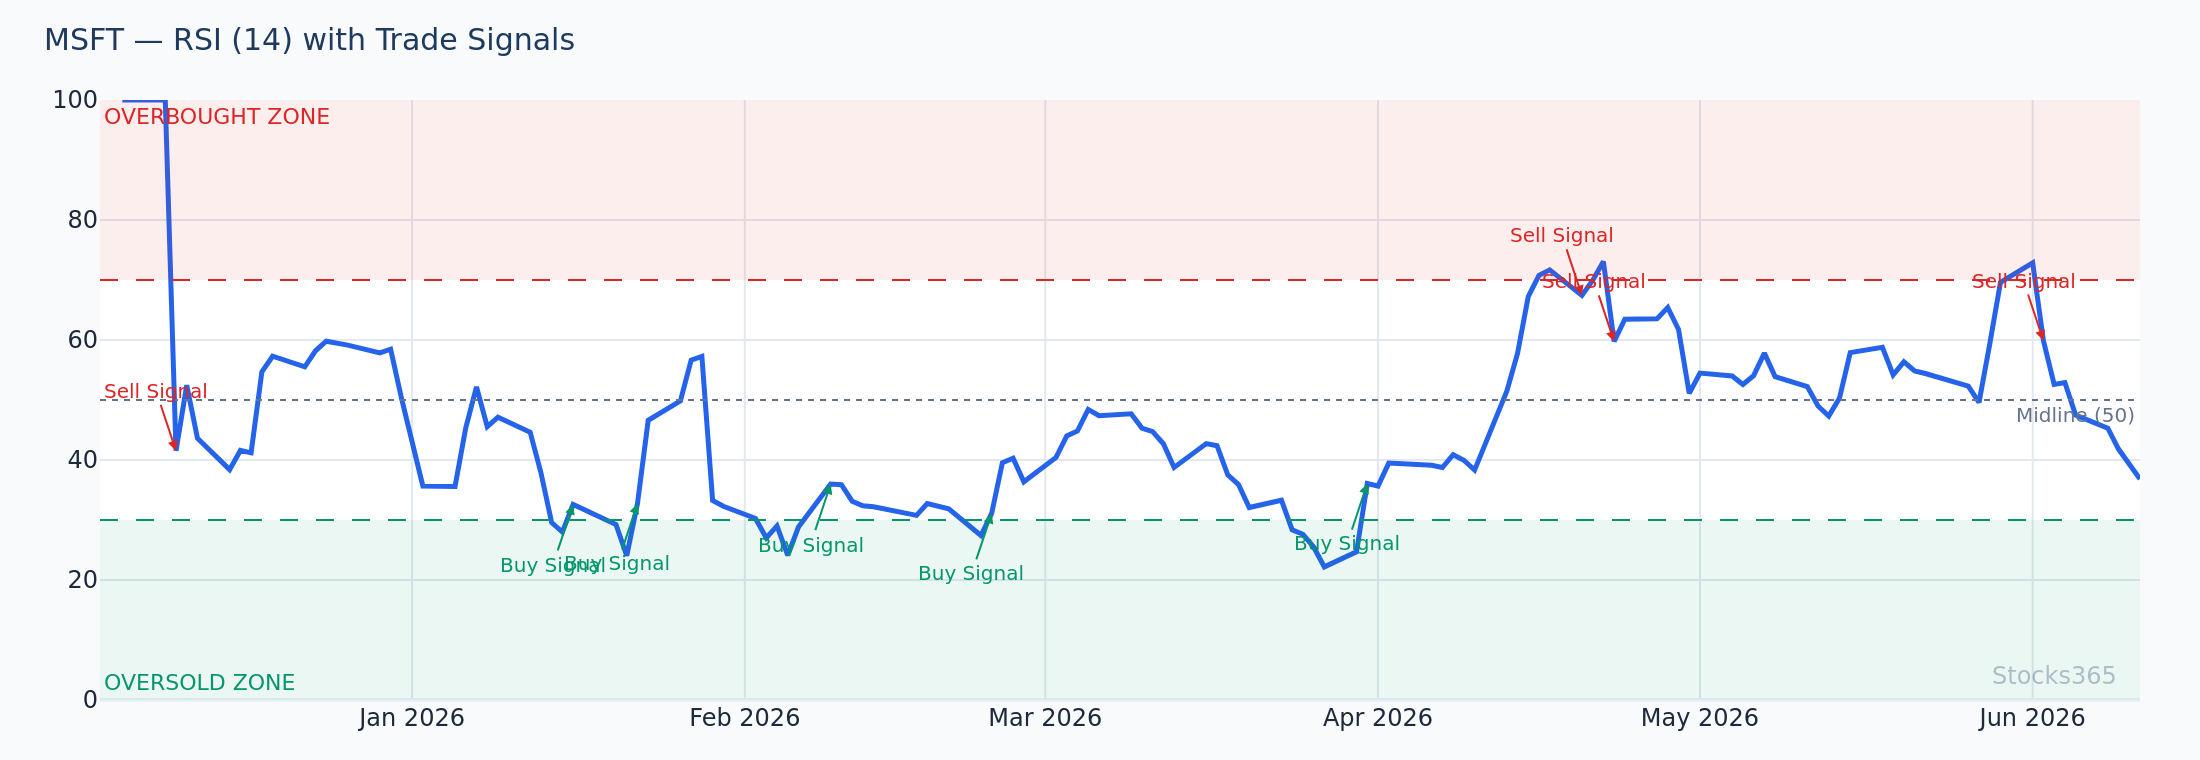
This chart overlays RSI with the lower Bollinger Band touch on a pullback. The key detail is that price makes a marginally lower low at the second band touch while RSI forms a higher low — classic bullish divergence. When this appears alongside a volume contraction on the second low, the setup becomes high-conviction. The pattern is invalidated if price closes more than one ATR below the second low before RSI can confirm the divergence.
When Bollinger Band Signals Fail
Failure modes matter as much as the setups themselves. Knowing where Bollinger Bands consistently fail saves capital.
Strong Trends Destroy Mean-Reversion Trades
In a powerful uptrend, price rides the upper band. Every lower band touch in a downtrend is a value trap. Mean-reversion signals get slaughtered in trending conditions. The fix: check the slope of the 20-SMA before entering any mean-reversion trade. If the midline is steeply angled in one direction, skip the counter-trend fade entirely.
Commodities Show Consistently Weak Results
Across every Bollinger Band setup Stocks365 has tested, commodities underperform. The upper band touch strategy in commodities shows a 41.5% win rate. The dual overbought setup drops to 40.7%. Commodity markets are driven by supply shocks, geopolitical events, and seasonality — dynamics that technical band signals don't capture well. Applying Bollinger Band sell signals to commodity markets is a structural disadvantage, not bad luck.
Low-Liquidity Markets Produce False Signals
Thin markets manipulate the bands. A single large order can spike price through the upper or lower band and immediately reverse. This is especially common in small-cap equities and micro-cap crypto. Always check average daily volume before trusting a band signal in any less-liquid instrument.
Our broader analysis of signal accuracy across conditions is detailed in Indicator Deep-Dive: Where Our Signals Work, Where They Don't — essential reading if you want the full picture.
Signal failure is not the exception. It's the cost of doing business with any technical indicator.
Bollinger Bands and Trend Confirmation
Bollinger Bands work best when paired with a clear understanding of the broader trend structure. For identifying major trend shifts, the Golden Cross vs Death Cross guide explains how 50-day and 200-day moving average crossovers frame the macro trend context that Bollinger Band signals operate within.
Combine macro trend direction from moving average crosses with micro-level entry triggers from Bollinger Bands, and you have a layered approach that filters out a significant portion of noise.
Practical Bollinger Band Trade Setups to Know
Setup 1: The Squeeze Breakout Long
- Band width drops to 20th percentile or lower (squeeze confirmed)
- Price consolidates near or above the 20-SMA midline
- Breakout candle closes above the upper band
- Volume surges above 1.5x the 20-day average on the breakout candle
- Stop placed below the most recent swing low inside the squeeze
Setup 2: The W-Pattern Mean Reversion Long
- First low tags or closes below the lower band
- Bounce reaches at least halfway to the 20-SMA midline
- Second low stays above the lower band (higher low structure)
- RSI shows a higher low on the second touch (divergence)
- Entry on the close back above the 20-SMA; stop below the second low
Setup 3: The M-Pattern Reversal Short
- First high closes above or at the upper band
- Pullback reaches near the 20-SMA midline
- Second high fails to reach the upper band (lower high structure)
- RSI shows a lower high on the second push (divergence)
- Entry on the break below the 20-SMA; stop above the second high
For a step-by-step walkthrough of reading oscillator signals alongside these band setups, our How to Read the Stochastic Oscillator guide is a direct complement to everything covered here. For an even deeper dive specifically on Bollinger Band signal mechanics, the Bollinger Bands Master Guide covers advanced pattern variations.
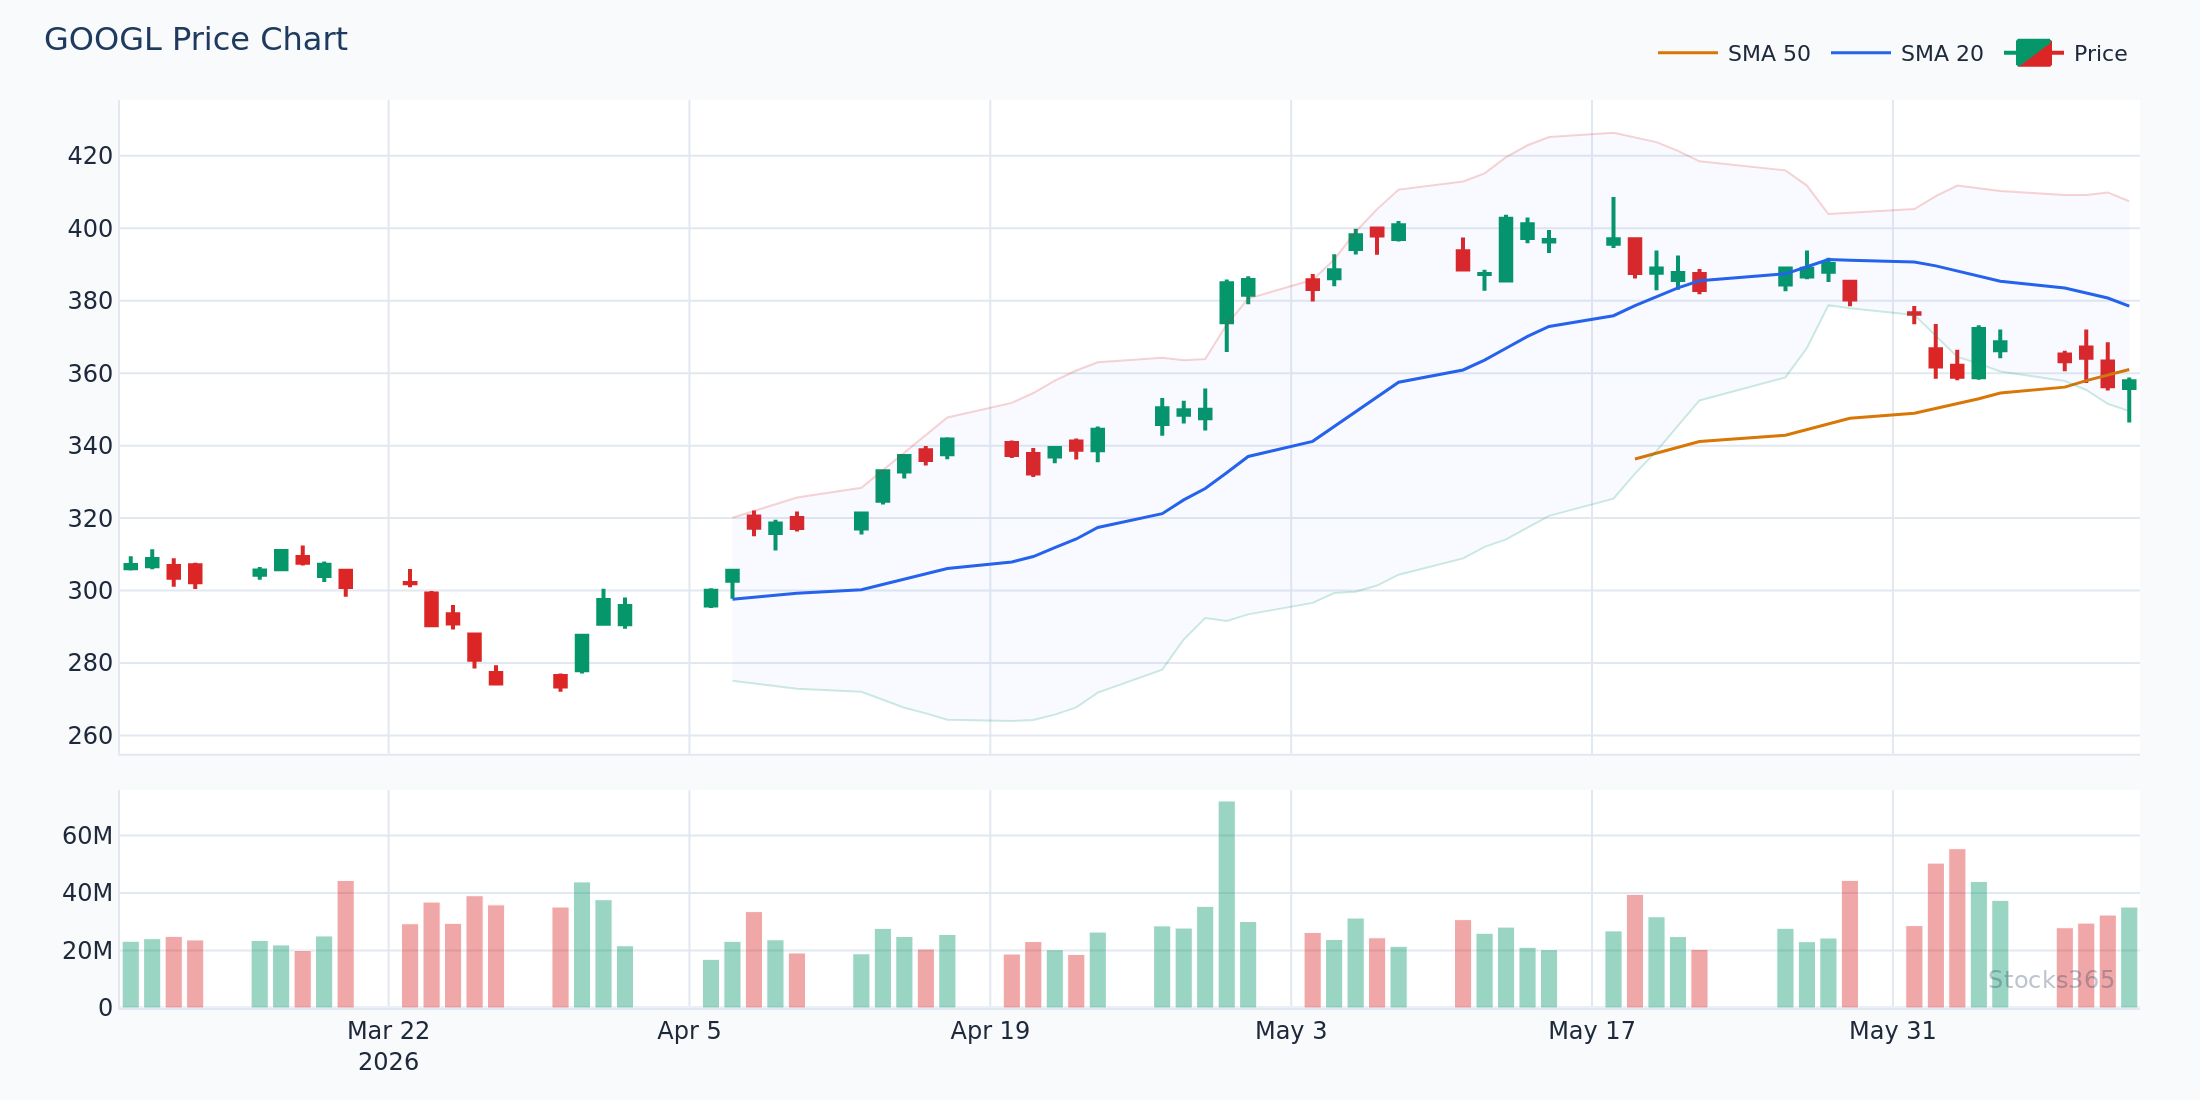
This setup illustrates the W-pattern on a daily chart, with the first low touching the lower band during a broad market pullback and the second low forming inside the bands with RSI showing a clear higher low. The midline reclaim candle — a bullish close back above the 20-SMA — is the trigger. The pattern loses its validity if volume on the second rally is significantly weaker than the first bounce, which would suggest institutional selling into the recovery.
What to Watch For
- Bollinger Squeeze breakouts on momentum stocks: When band width compresses below the 20th percentile on high-beta equities and price is coiling above the 20-SMA, the next directional candle on elevated volume often initiates a 2-3 ATR move. Watch the first 30 minutes of a session after a multi-day squeeze for the trigger.
- W-pattern setups after earnings-driven selloffs: When a large-cap stock gaps down on earnings and price touches the lower band within two sessions, then forms a second low inside the bands 3-7 days later with RSI divergence, the mean-reversion trade carries a higher probability than a random lower-band touch.
- Upper band touch fades in crypto during consolidation phases: When crypto enters a defined range with no trend slope on the 20-SMA and price tags the upper band with a Stochastic reading above 80, the fade back to the midline is historically the highest-probability short-term outcome — our data shows crypto upper band touches in range-bound conditions outperform random entries significantly.
- Squeeze breakouts following cross-asset volatility compression: When equity volatility indices are suppressed and individual stock Bollinger Bands simultaneously compress, the subsequent expansion breakouts tend to be more sustained — both asset classes are coiling together, and the unwind is sharper.
- Band-walking signals in strong trending assets: When price consistently closes above the upper band for three or more consecutive sessions in a strong uptrend, avoid fading. Instead, watch for the first close back inside the upper band as a potential momentum-shift warning, and confirm with volume dropping below the 10-day average.
Key Takeaways
Bollinger Bands Buy and Sell Signals — What Actually Matters:
- Band touches are conditions, not signals. Always wait for confirmation.
- The Bollinger Squeeze Breakout shows the most consistent edge, especially in crypto (51.8% win rate across 14,266 backtested signals) — but the edge is thin and requires volume confirmation.
- Mean-reversion signals (upper/lower band touches) fail in trending markets. Check the 20-SMA slope before every fade trade.
- Commodities consistently underperform across all Bollinger Band setups — adjust expectations accordingly.
- W-patterns and M-patterns outperform simple band touches because they require two tests plus structural confirmation.
- Layer Bollinger Bands with RSI divergence and volume for higher-probability setups.
- The Stocks365 signals dashboard surfaces Bollinger-based setups with multi-indicator confirmation built in — removing the manual filtering step.
How Stocks365 Uses This
🔬 How Stocks365 Integrates Bollinger Band SignalsBollinger Bands are one of 12+ indicators feeding into the Stocks365 Trust Score system. Specifically, band signals contribute to two scoring dimensions: volatility regime scoring (is the market in a squeeze or expansion phase?) and indicator agreement scoring (do multiple signals point in the same direction?).
When a Bollinger Squeeze Breakout aligns with RSI confirmation and elevated volume — all within the same signal window — the Trust Score weights that confluence higher than any single band signal alone. A solo upper band touch with no momentum confirmation scores low agreement and is flagged accordingly in the signal feed.
This is why individual stock signal pages show not just whether a band signal fired, but how many other indicators agree with it — giving you a fast filter for quality over noise. You can see the full signal landscape across all tracked assets in the Stocks365 dashboard.