
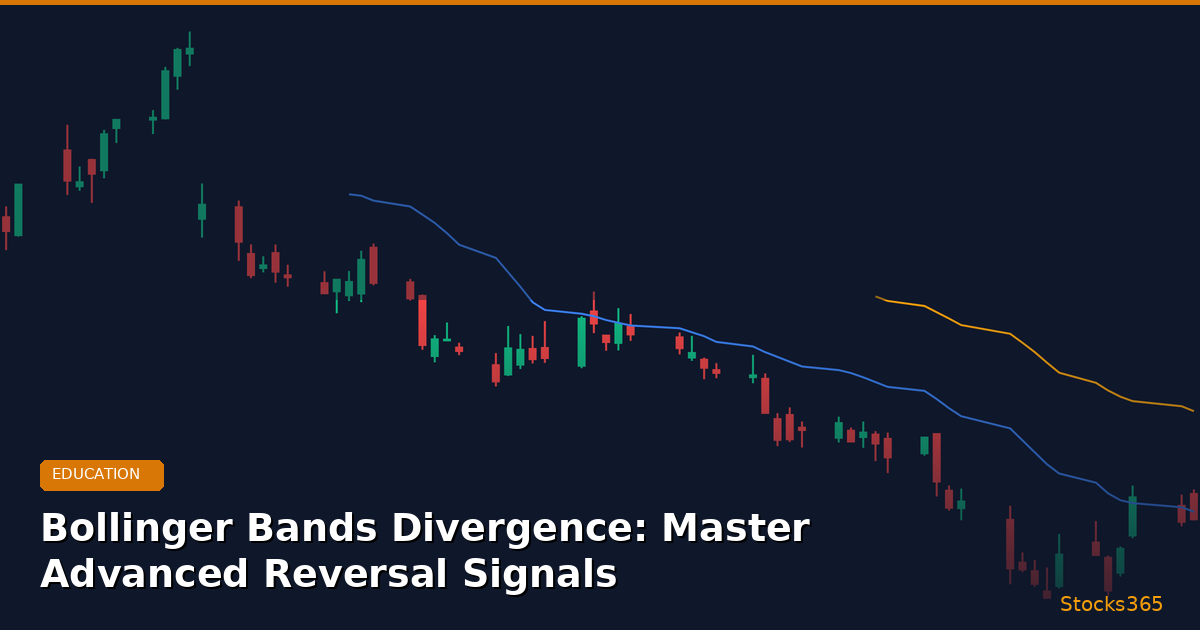
Bollinger Bands Divergence: The Reversal Signal Most Traders Miss
Price makes a new high. The indicator doesn't. That gap — that silent disagreement between price and momentum — is where reversals are born.
Bollinger Bands divergence is one of the most overlooked setups in advanced technical analysis. Most traders use Bollinger Bands to spot overbought and oversold conditions. That's fine. But the real edge comes when you combine band position with diverging momentum — and start reading what the bands are actually telling you beneath the surface.
Stocks365 backtested 3,026 signals combining Bollinger Band positioning with Stochastic Oscillator readings across multiple asset classes and found a 49.9% raw win rate — but with a critical detail: crypto assets hit 58.0% while commodities lagged at 40.7%. Those numbers aren't just statistics. They tell you where this setup works, and where to be cautious. More on that shortly.
This article covers the mechanics of Bollinger Bands divergence, how to identify it correctly, what confirms it, and how to avoid the traps that catch most beginner traders off guard.
What Is Bollinger Bands Divergence?
Bollinger Bands consist of three lines plotted around price: a 20-period simple moving average in the center, and two outer bands placed two standard deviations above and below. If you need a refresher on the math, How Bollinger Bands Work: Master the Math Behind It breaks down the formula in detail.
Divergence happens when price and a secondary indicator disagree about the strength of a move.
In the Bollinger Bands context, there are two primary divergence scenarios:
- Bearish Bollinger Bands divergence: Price pushes to a new high and tags or exceeds the upper band — but the secondary indicator (RSI, MACD, Stochastic) makes a lower high. Momentum is weakening even as price extends.
- Bullish Bollinger Bands divergence: Price falls to a new low and tags or pierces the lower band — but the secondary indicator makes a higher low. Selling pressure is exhausting even as price dips further.
The divergence itself isn't the trade. It's the warning. The trade comes from confirmation.
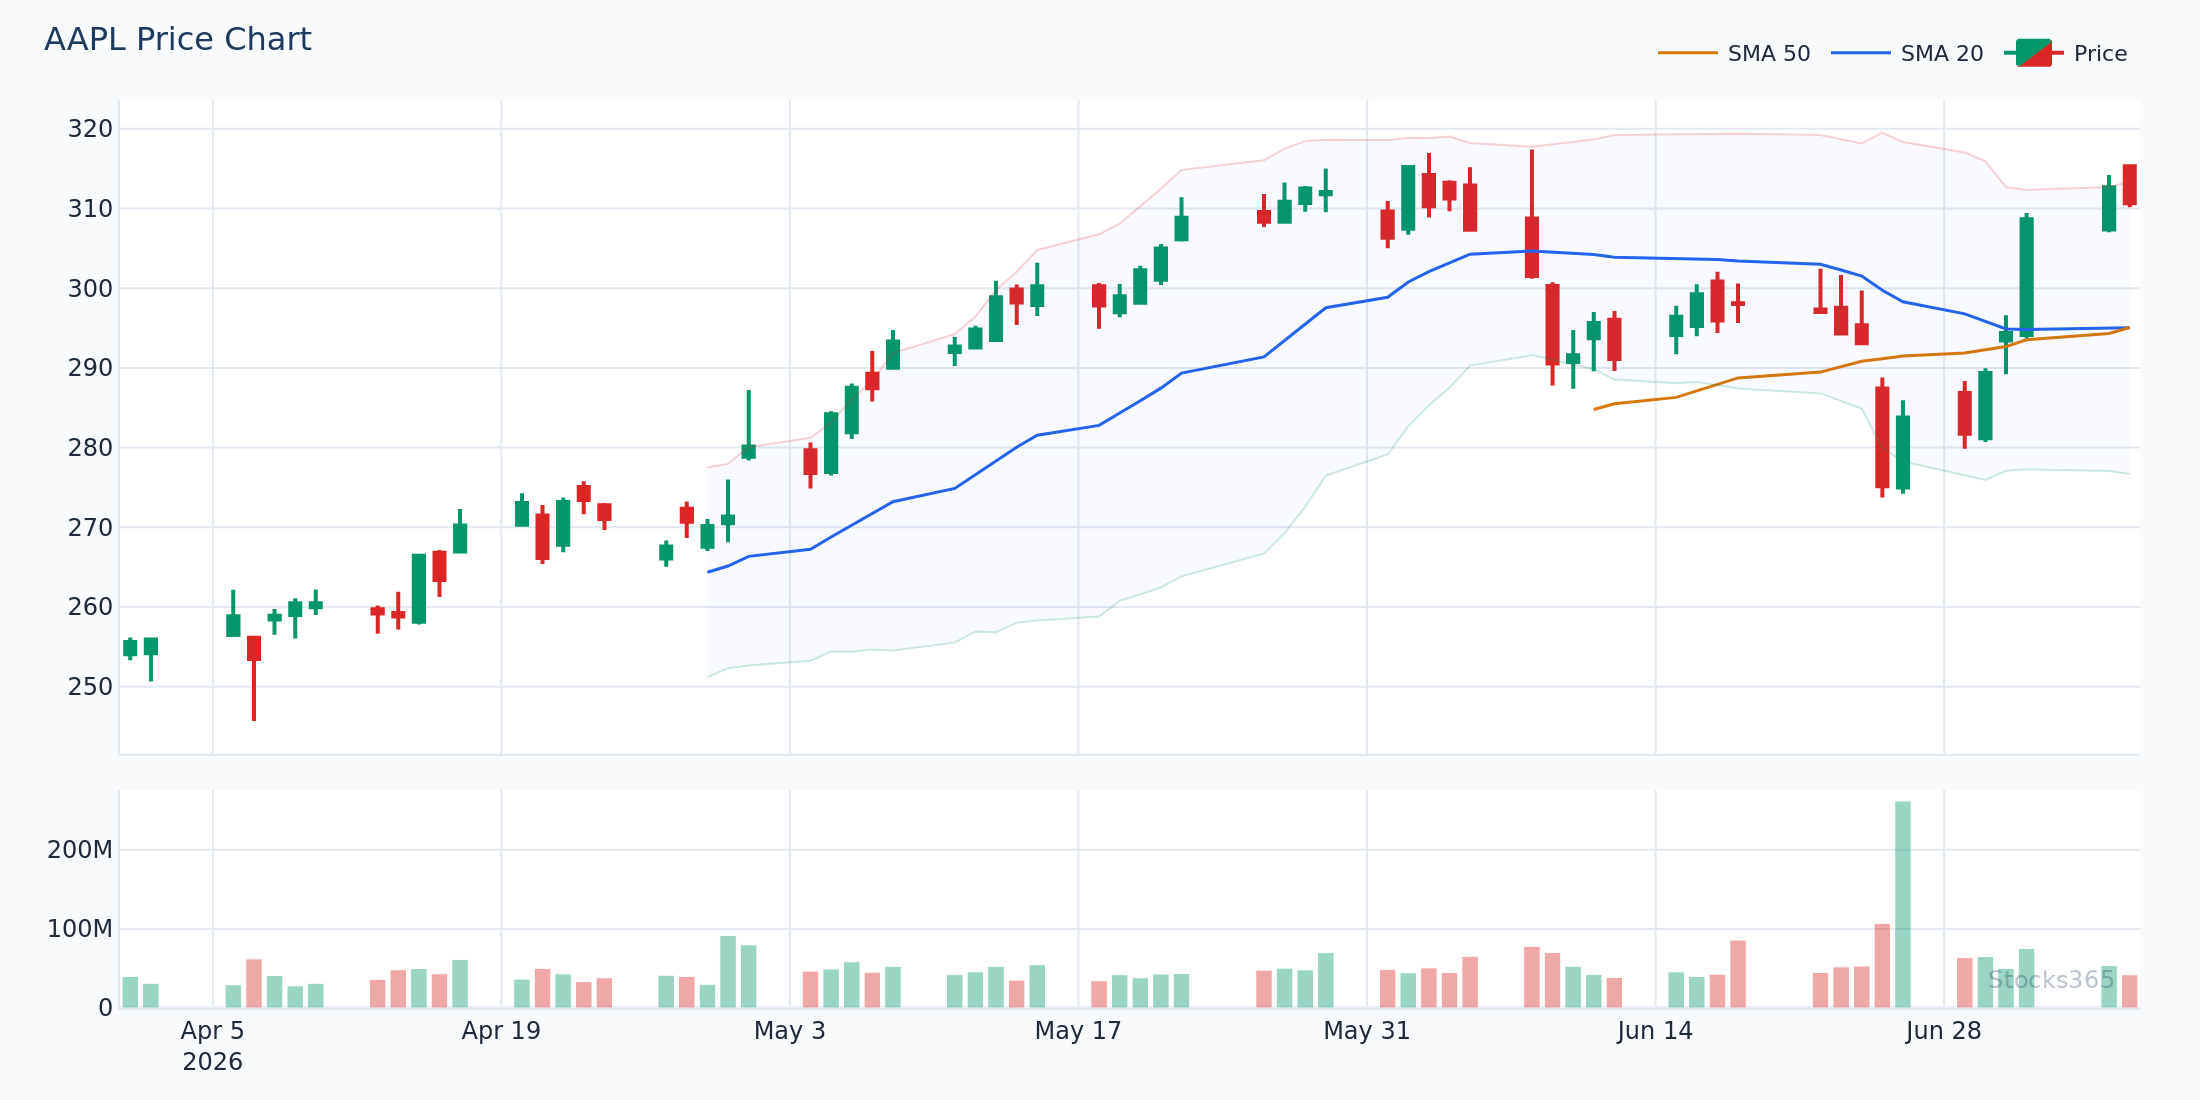
This chart shows price tagging the upper Bollinger Band while the RSI forms a visibly lower peak. The bands are wide, indicating elevated volatility. When price subsequently fails to hold above the 20-SMA midline and RSI breaks below its prior swing low, that confirms the divergence signal — and typically marks the beginning of a meaningful pullback. The setup is invalidated if price closes convincingly above the upper band with RSI making a new high simultaneously.
Why Bollinger Bands Divergence Works as a Reversal Signal
Bollinger Bands measure volatility and price displacement from a statistical mean. When price stretches to the upper or lower band, it's operating at an extreme relative to recent history. That alone doesn't guarantee a reversal — trending markets can walk the band for extended periods.
But when price reaches that extreme and momentum is simultaneously fading, you have two data points pointing in the same direction. The crowd is pushing price to a new extreme, but with less conviction than the previous extreme. That divergence in conviction is what precedes many of the cleanest reversals.
Think of it as a runner approaching a finish line who's visibly slowing down. They might still cross it — but they won't keep running much farther.
The Role of Band Width in Divergence Quality
Not all divergence signals are equal. The quality of a Bollinger Bands divergence signal depends heavily on band width context.
- Divergence during band expansion: This is the highest-quality scenario. Bands are widening, price is at an extreme, and momentum is fading — all simultaneously. This combination most reliably precedes sharp reversals.
- Divergence during a squeeze: Lower reliability. Price may be consolidating before a new breakout. The divergence could resolve in either direction once the squeeze releases. See our guide on Bollinger Bands for ETF Trading for how squeeze dynamics play out in index products specifically.
- Divergence during contracting bands: Moderate reliability. Momentum is already fading and the band contraction confirms reduced market participation.
How to Identify Bollinger Bands Divergence Step by Step
Step 1: Identify the Band Touch
Look for price reaching or breaching the upper or lower Bollinger Band. This can be a close outside the band or a wick penetration — both are valid, though a full close beyond the band carries more weight.
Step 2: Compare the Prior Band Touch
Look back to the most recent time price touched the same band. This is your reference point. You're comparing two band touches on the same side.
Step 3: Check the Secondary Indicator
Now check your momentum indicator at both band touches. The most effective secondary indicators for this setup are:
- RSI (14-period): The most commonly used. A lower RSI reading at the second upper band touch (or higher RSI at the second lower band touch) confirms divergence. See the RSI Indicator: The Complete Trading Guide for 2026 for full RSI methodology.
- MACD histogram: A shrinking histogram at the second extreme is a reliable divergence signal. Compare it to MACD vs Stochastic Oscillator to understand which fits your trading style.
- Stochastic Oscillator: Particularly useful on shorter timeframes. If the Stochastic made a reading above 80 at the first band touch and sits at 70 at the second — that's divergence. Read How to Read the Stochastic Oscillator for the complete setup guide.
Step 4: Wait for Price Confirmation
The divergence is identified. Now wait for price to confirm the reversal. Don't jump the gun.
Confirmation signals include:
- Price closes back inside the band after a prior close outside it
- Price breaks below (or above) the 20-SMA midline
- A bearish (or bullish) engulfing candle on elevated volume
- Volume on the confirmation candle exceeds the average of the prior 5 sessions
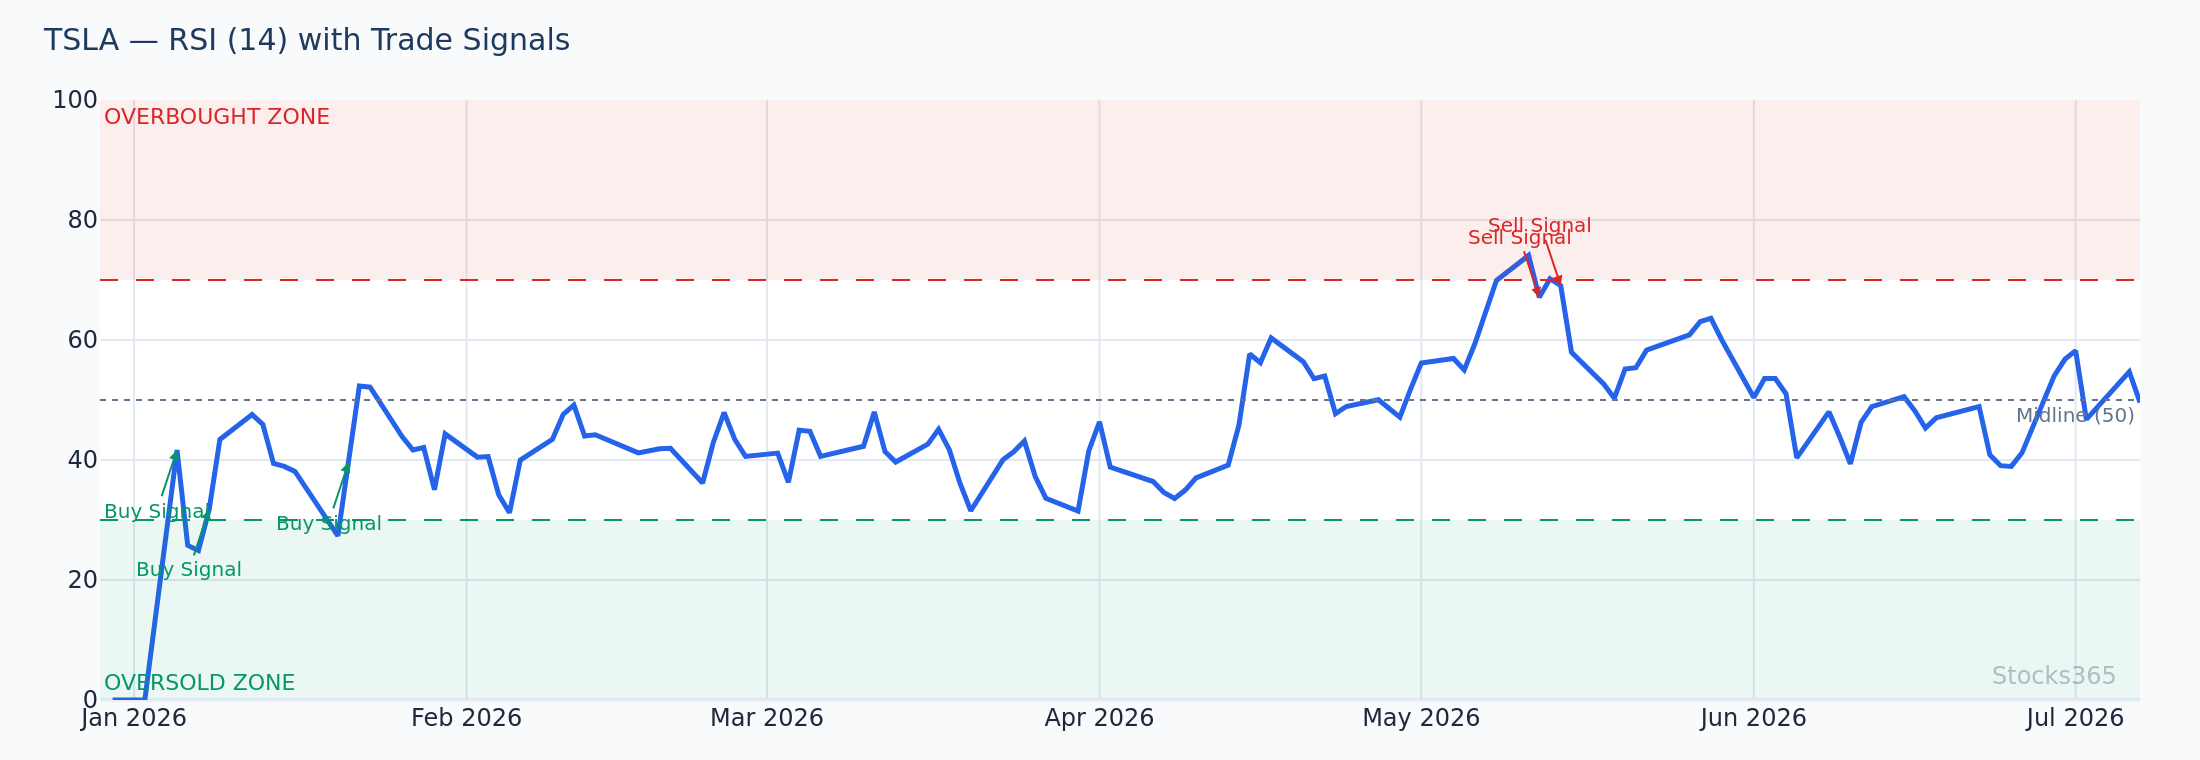
Here the RSI line clearly forms a lower peak while price continues to press the upper band. Watch the moment the RSI breaks below its most recent swing low — that's the confirmation trigger, not the divergence observation itself. Trades entered on divergence alone, without price confirmation, carry significantly higher false-signal risk. The pattern becomes invalid if RSI reclaims its prior high while price simultaneously makes another upper band touch.
Here's What Most Traders Get Wrong
Most traders see price touch the upper Bollinger Band and immediately assume a reversal is coming. They short the first band touch. They get stopped out as price walks the band higher. They try again. They get stopped out again.
The band touch alone means nothing without divergence. In a strong trending market, price can tag the upper band on 8 consecutive candles and never reverse. The band touch tells you price is at a statistical extreme — it doesn't tell you the trend is ending. Bollinger Bands divergence is what separates a potential reversal from a continuation. Without a diverging momentum indicator, you're just fading strength. That's a low-probability trade dressed up as a signal.
The edge is in the disagreement between price and momentum — not in the band touch itself.
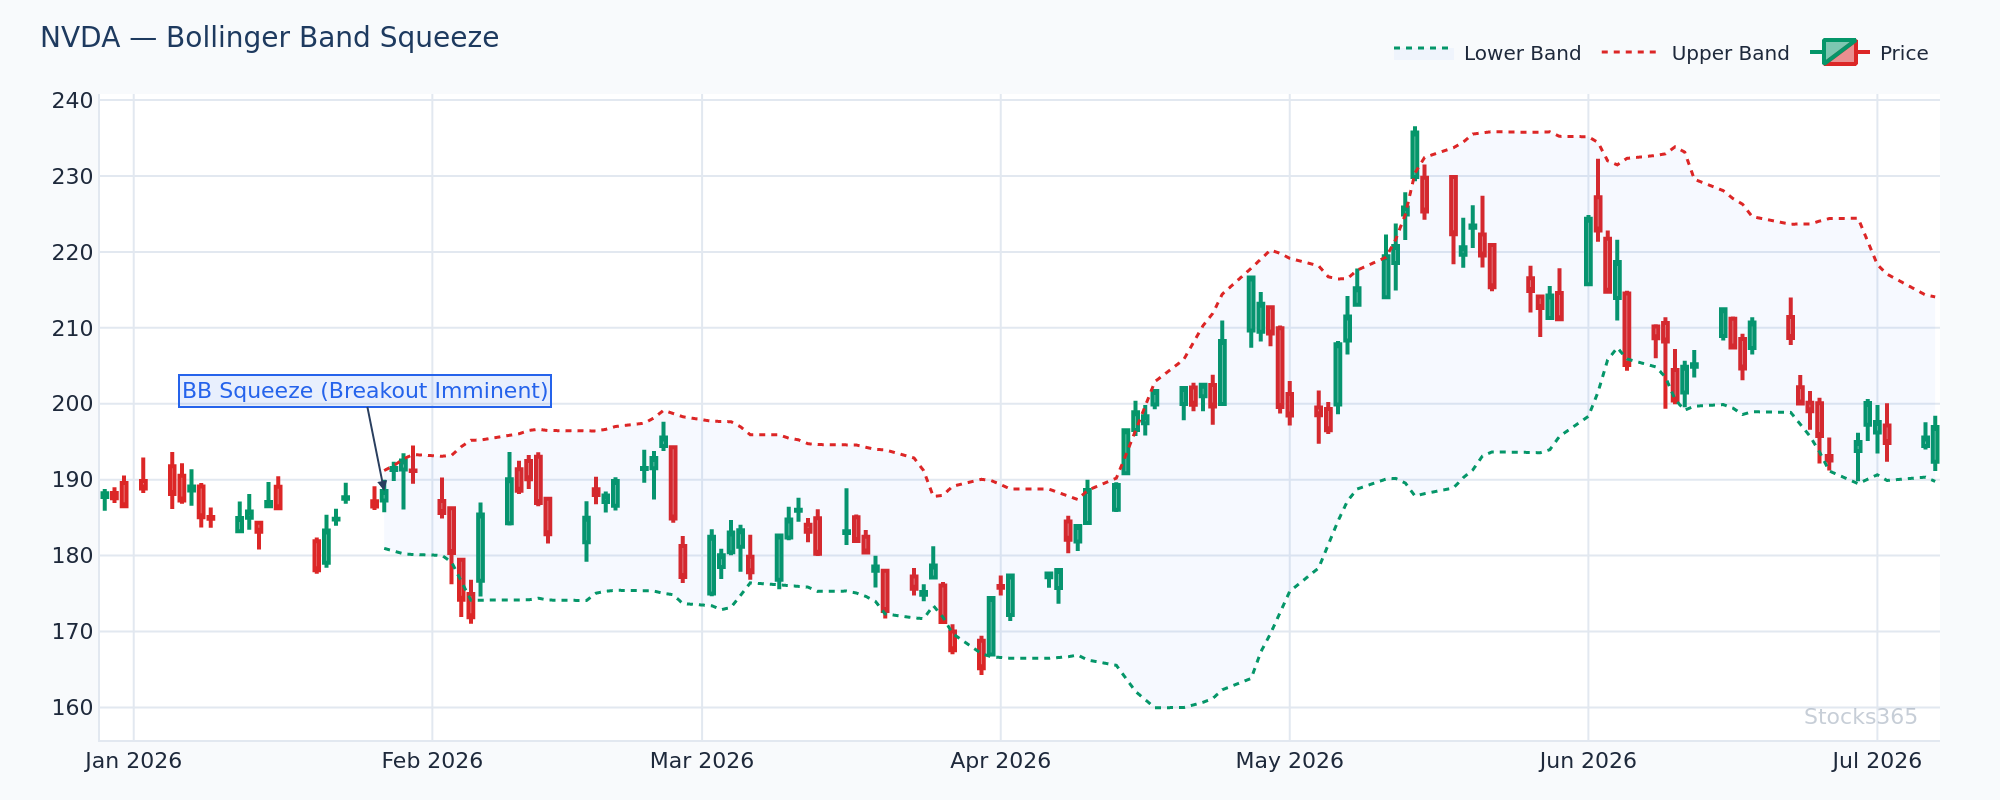
This chart illustrates a squeeze breakout that initially appears bullish — price breaks above the upper band as bands expand. However, volume on the breakout is below average, and the RSI fails to make a new high despite price extending further. That's a textbook Bollinger Bands divergence setup forming in real time. Confirmation arrives when price pulls back inside the band and the 20-SMA begins to flatten. If volume had surged on the breakout candle and RSI confirmed, this setup would be invalidated as a divergence signal.
Combining Bollinger Bands Divergence With Other Indicators
Divergence is more powerful in confluence. One disagreeing indicator is a warning. Two or three are a signal.
Bollinger Bands Divergence + RSI
The most common and reliable combination. RSI divergence at a Bollinger Band extreme is a setup that appears across every asset class and timeframe. The 14-period RSI is the standard, but some traders use a 9-period RSI for shorter-term setups.
The specific trigger: price tags the upper band while RSI prints below its prior high at the previous upper band touch. Enter on the first candle that closes back inside the band, with RSI confirming the move by breaking its own support level.
Bollinger Bands Divergence + Stochastic Double Overbought
Our research dashboard tracks the Bollinger Band + Stochastic Double Overbought setup across thousands of signals. The combination — price at the upper band with Stochastic above 80 — has a 49.9% base win rate across 3,026 signals. That's essentially random at face value. But in crypto assets specifically, that figure rises to 58.0%, while in commodities it drops to 40.7%. The implication: this setup has genuine edge in high-volatility, momentum-driven markets like crypto, and significantly less reliability in slower-moving commodity markets where mean reversion is less predictable. For traders focused on digital assets, Bollinger Bands for Crypto Trading: Bitcoin & Altcoins covers the full crypto-specific application.
Bollinger Bands Divergence + Moving Average Context
The trend context matters. A bearish divergence signal that forms while price is still above a rising 200-SMA carries less weight than the same signal forming at a long-term resistance zone. Use Moving Averages for Long-Term Investors to understand how to layer trend context with shorter-term reversal signals effectively.
The moving average context also helps define your trade bias: divergence against the primary trend produces countertrend trades with smaller profit targets. Divergence aligned with the primary trend — for example, bearish divergence in a stock that's already trending lower — produces higher-probability, higher-reward setups.
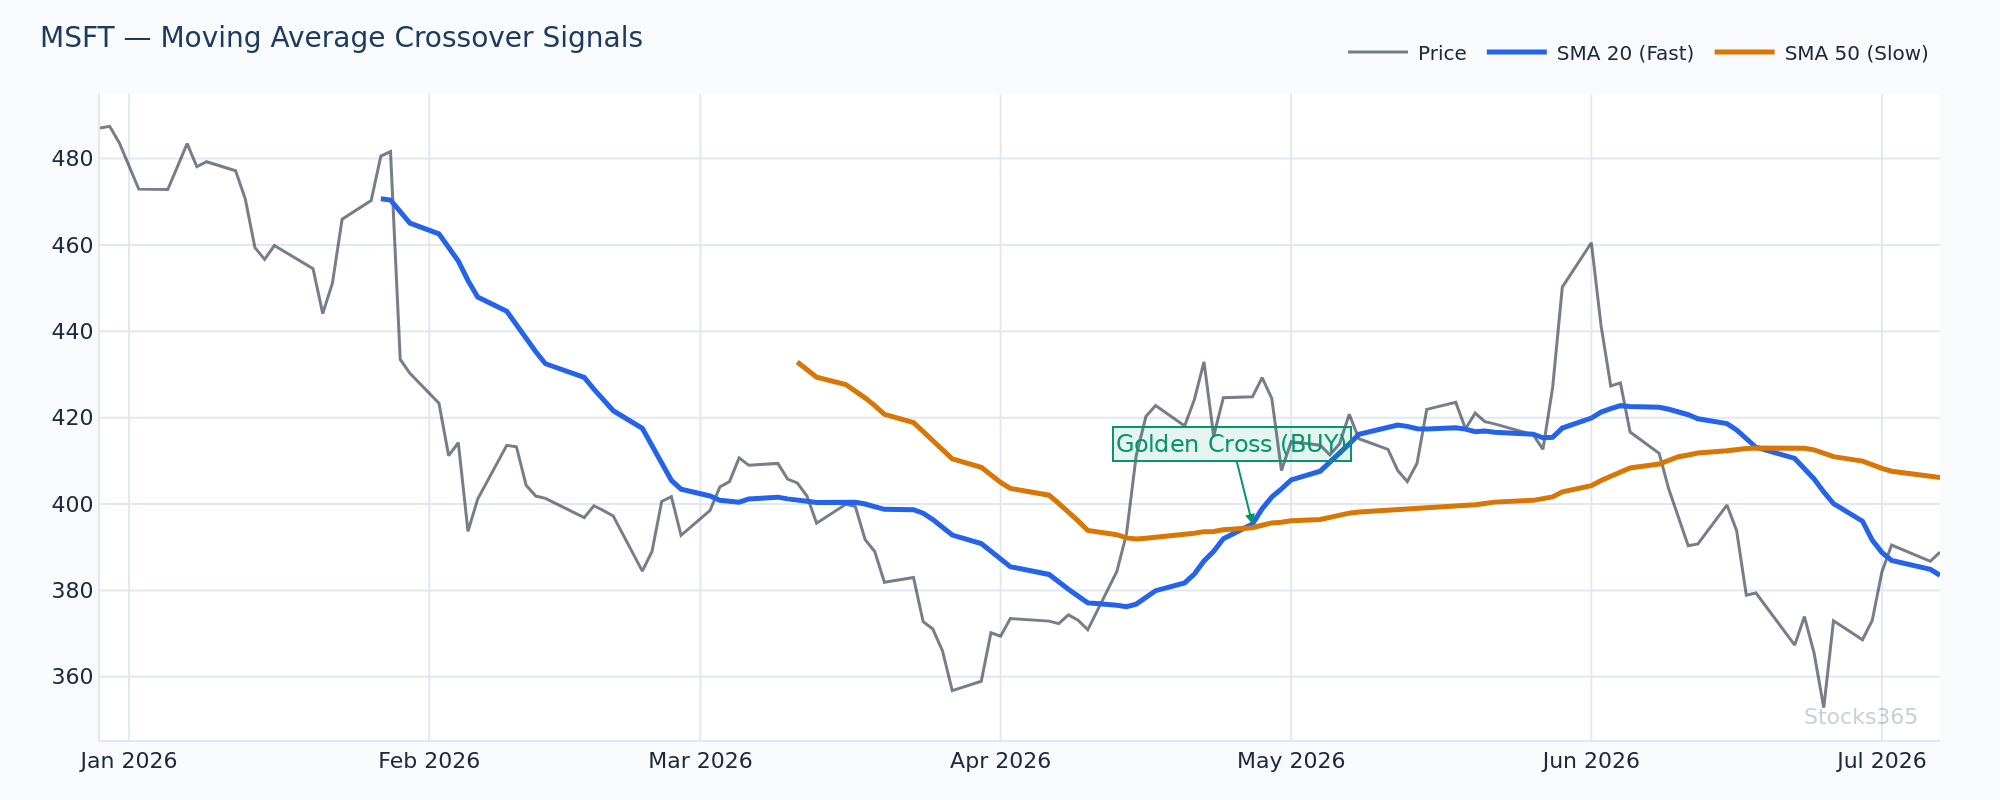
Price pushes the upper Bollinger Band while sitting well above both the 50-SMA and 200-SMA — indicating an uptrend context. The RSI shows a lower high at the second upper band touch, but the primary trend remains intact. In this scenario, the divergence is most useful as a signal to reduce position size or tighten stops, rather than a full reversal entry. If price subsequently breaks below the 20-SMA midline and the 50-SMA begins to flatten, the divergence signal gains significantly more weight as a genuine reversal warning.
Bollinger Bands Divergence Across Different Markets
Stocks
In equities, Bollinger Bands divergence works best on individual names with clear momentum characteristics — think high-beta tech stocks or growth names after extended runs. It's less reliable on low-volatility defensive stocks where band width stays narrow and touches are infrequent. Check AAPL's signal page as a reference for how large-cap divergence setups form in practice.
Crypto
Crypto is the strongest asset class for this setup. High volatility means frequent, clear band touches. Momentum indicators diverge sharply in crypto after parabolic moves. The 58.0% win rate in our backtested data (n=3,026) reflects this structural advantage. Volatility is your friend when you're trading reversals.
Forex
Forex markets present more challenges. Currency pairs often trend persistently, making divergence signals prone to early triggering. Bollinger Bands divergence on forex works best on major pairs during ranging conditions, or as confirmation after a major news-driven spike that creates an unsustainable band extreme.
ETFs and Indices
Index ETFs show clean divergence signals around market turning points — particularly when broad market indices push to new highs on diminishing breadth. When the index tags the upper Bollinger Band but fewer constituent stocks participate, that's fundamental and technical divergence aligning.
Common Bollinger Bands Divergence Mistakes
- Trading the divergence before confirmation: The most common error. Divergence is a warning. Price confirmation is the signal. Always wait for both.
- Using only one indicator: Single-indicator divergence produces false signals frequently. Stack at least two momentum indicators before acting.
- Ignoring trend context: Bearish divergence in a roaring bull trend is a trap. Know whether you're trading with or against the primary trend, and size your position accordingly.
- Treating all timeframes equally: Divergence on a 5-minute chart has a much shorter lifespan than divergence on a daily chart. Match your position sizing and target expectations to the timeframe.
- Expecting perfect symmetry: The two band touches don't need to be at exactly the same price level. You're comparing momentum at two extremes — price levels are secondary.
What to Watch For
- Watch for bearish Bollinger Bands divergence on high-beta tech stocks after a 15%+ rally in under 20 sessions. When price tags the upper band on lighter-than-average volume and RSI prints a lower high compared to the mid-rally peak, the reversal setup is forming. Confirmation arrives on the first daily close back below the 20-SMA.
- In crypto, monitor bullish divergence setups when price pierces the lower Bollinger Band following a drawdown exceeding 25% from the recent high. If the Stochastic makes a higher low while price makes a new low, the exhaustion structure is in place. Volume contraction on the second low strengthens the signal significantly.
- On sector ETFs, watch for divergence at upper band extremes when the sector has outperformed the broad market by more than two standard deviations over a rolling 30-day period. Relative strength divergence combined with Bollinger Band divergence is a high-quality rotation signal.
- Moving average crossover failures near Bollinger Band extremes are worth tracking. When a short-term moving average attempts a bullish cross but price is already diverging from the upper band on RSI, the cross often fails — and that failure becomes a stronger reversal signal than the divergence alone. See the Moving Average Crossover Strategy guide for crossover mechanics.
- Pay attention to band width percentile when evaluating divergence quality. When band width is in the top 20% of its historical range, divergence signals carry more weight — the market is highly stretched, and the reversion potential is larger.
Key Takeaways
Bollinger Bands Divergence — Summary
- Bollinger Bands divergence occurs when price reaches a band extreme but a momentum indicator makes a contradicting high or low.
- The divergence itself is a warning. Price confirmation — a close back inside the band or a break of the 20-SMA — is the actual trade trigger.
- Highest reliability comes from combining band touches with RSI, MACD, or Stochastic divergence simultaneously.
- Crypto assets show the strongest historical performance for this setup (58.0% win rate in Stocks365 backtested data, n=3,026). Commodities show the weakest (40.7%).
- Band width context matters: divergence during band expansion produces the cleanest, most reliable reversal signals.
- Always assess the primary trend before trading divergence. With-trend divergence setups carry higher probability than countertrend setups.
- Use the Stocks365 signals dashboard to screen for live divergence setups across equities, crypto, and ETFs with real-time trust score confirmation.
How Stocks365 Uses This
🔍 How Stocks365 Integrates Bollinger Bands DivergenceBollinger Bands divergence is one of the inputs within the Stocks365 trust score system, which aggregates 12+ technical indicators into a single actionable score for every tracked asset. When price tags a Bollinger Band extreme and a diverging momentum signal is detected — particularly from RSI or Stochastic — this disagreement is flagged within the agreement scoring layer of the trust score. A lower agreement score indicates that multiple indicators are pulling in opposite directions, which is precisely the environment where Bollinger Bands divergence setups are most meaningful.
The volatility scoring layer also contributes: when band width expansion accompanies a divergence setup, the trust score reflects elevated reversal probability. Traders using the Stocks365 signals dashboard can filter for low-agreement, high-volatility setups to surface live Bollinger Bands divergence candidates across equities, crypto, and ETFs in real time. Individual stock pages — like AAPL's signal page — display the full trust score breakdown, making it straightforward to assess whether divergence is confirmed by the broader indicator consensus before entering a trade.