
Bollinger Bands ETF Trading: Why Index and Sector Funds Are the Perfect Fit
Bollinger Bands were built for instruments that trend, consolidate, and mean-revert on a cycle. ETFs — whether they track the S&P 500, the semiconductor sector, or clean energy — do exactly that. They're liquid, diversified, and driven by macro forces that create the kind of clean, readable volatility patterns that Bollinger Bands are designed to catch.
Most retail traders apply Bollinger Bands to individual stocks and get burned by earnings gaps and single-stock noise. ETFs smooth that out. The signal quality is measurably better.
Stocks365 backtested 14,266 Bollinger Squeeze Breakout signals across multiple asset classes and found a profit factor of 1.03 — meaning the strategy generates more than it loses over time. ETFs sit right in the middle of that performance curve: more reliable than forex, less explosive than crypto. That's the sweet spot for systematic traders who want consistency over lottery tickets. Explore the full breakdown on our research dashboard.
This guide covers the core Bollinger Bands ETF setups, how to apply them to both broad-market index funds and narrow sector plays, and exactly what separates high-probability signals from noise.
What Bollinger Bands Actually Measure on ETFs
Before diving into setups, you need to understand what the bands are telling you. If you want the full mathematical breakdown, read our article on How Bollinger Bands Work: Master the Math Behind It. For now, here's the ETF-specific context.
Bollinger Bands plot a 20-period simple moving average (the middle band) with an upper and lower band set at two standard deviations above and below that average. On an ETF, this means you're measuring volatility relative to recent price behavior — not absolute levels. When the bands are wide, the ETF is volatile. When they're narrow, it's coiling.
For index ETFs like those tracking the S&P 500 or Nasdaq, the 20-day Bollinger Band framework maps almost perfectly onto options expiration cycles and macro calendar events. For sector ETFs — tech, energy, financials, biotech — the squeeze and expansion cycles are shorter and more aggressive, because sector rotation happens fast.
Band Width: The Most Underused ETF Metric
Band width is the percentage distance between the upper and lower band relative to the middle band. Low band width means a squeeze is forming. When band width drops to multi-month lows on a sector ETF, something is about to move. It won't sit tight forever.
Watch band width drop below its 20th percentile on a weekly chart. That's not a trading signal by itself — but it's your alert to load the chart, watch the price action, and be ready.
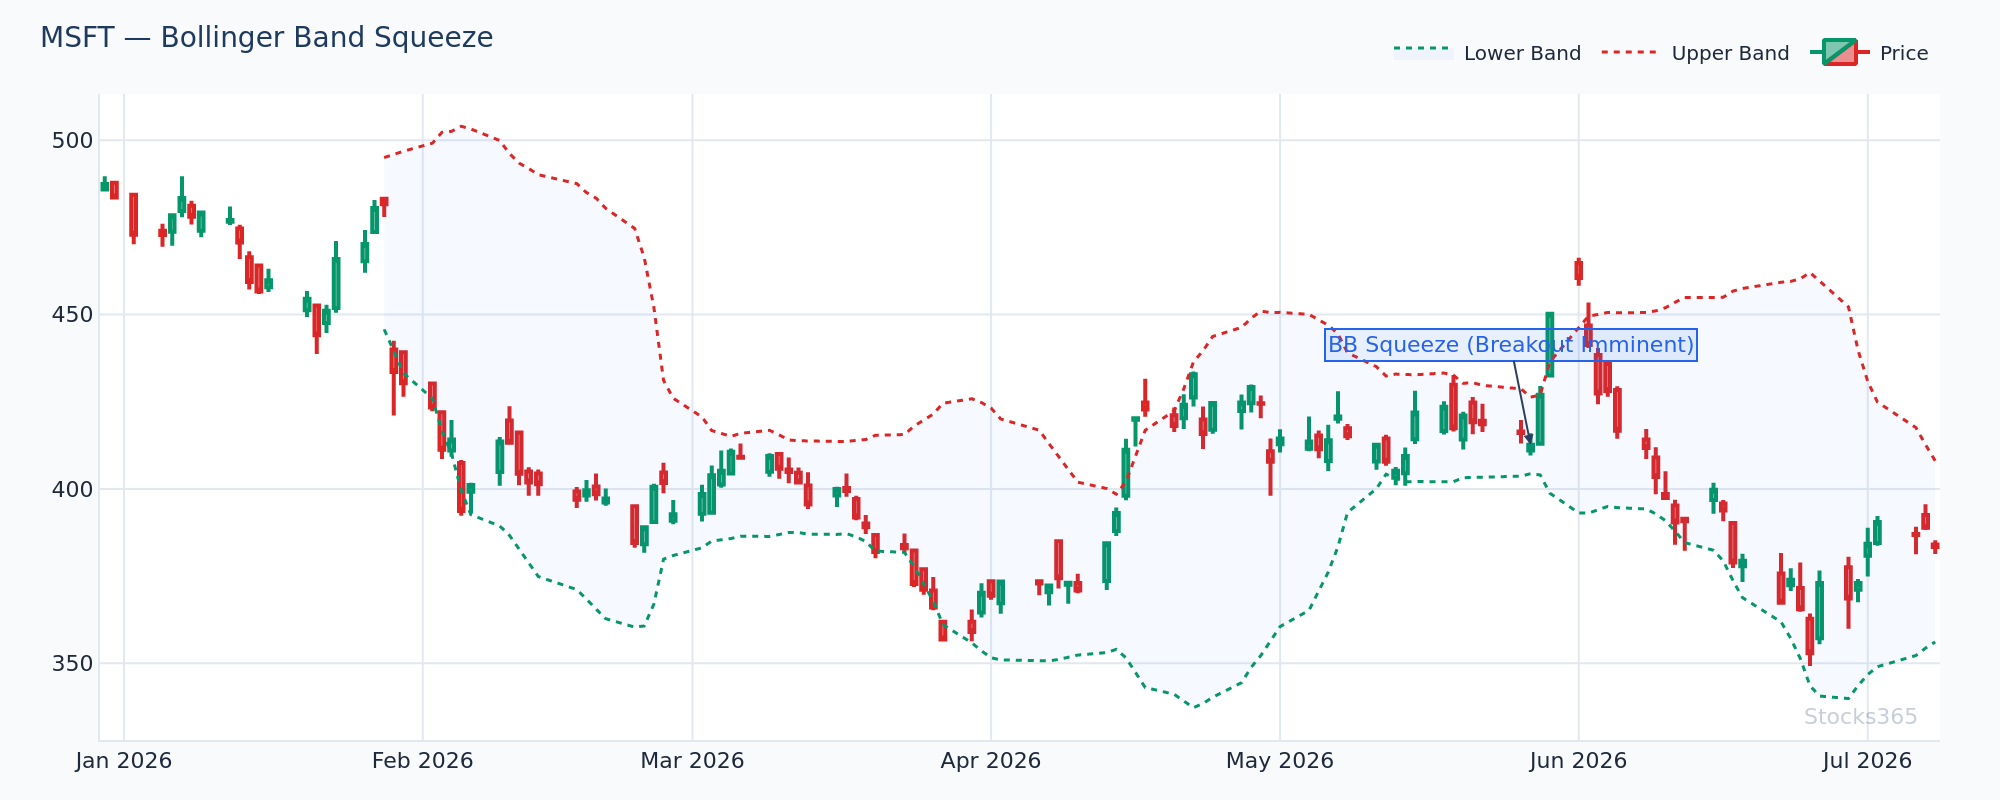
This chart shows band width compressing to a multi-week low while price consolidates just above the 20-SMA. This tight coil pattern typically precedes an expansion move of 2–3 ATR in whichever direction the breakout occurs. Confirmation comes when price closes outside the bands on above-average volume — a close that falls back inside the bands within one or two bars invalidates the breakout and often signals a false move.
The Three Core Bollinger Bands ETF Setups
1. The Squeeze Breakout on Index ETFs
The squeeze breakout is the highest-probability setup for broad-market index ETFs. Index funds move slowly, consolidate often, and when they break out of compression, the move tends to follow through because the underlying macro catalyst — a Fed decision, jobs data, earnings season — drives the entire basket.
Here's the setup in plain terms:
- Band width drops to its lowest reading in 20+ sessions
- Price is holding near the middle band (the 20-SMA)
- Volume has been declining during the squeeze — that's normal
- Price closes above the upper band on a volume spike (2x average or more)
- The next session opens above the prior close — no gap fill immediately
That's your entry. The invalidation is a close back below the 20-SMA within three sessions. When that happens, the breakout failed. Exit clean and wait for the next setup.
For confirmation, layer in a momentum indicator. Our RSI Complete Trading Guide for 2026 covers exactly how to use RSI as a breakout filter — RSI crossing above 55 on the same session as the band breakout dramatically improves the signal quality.
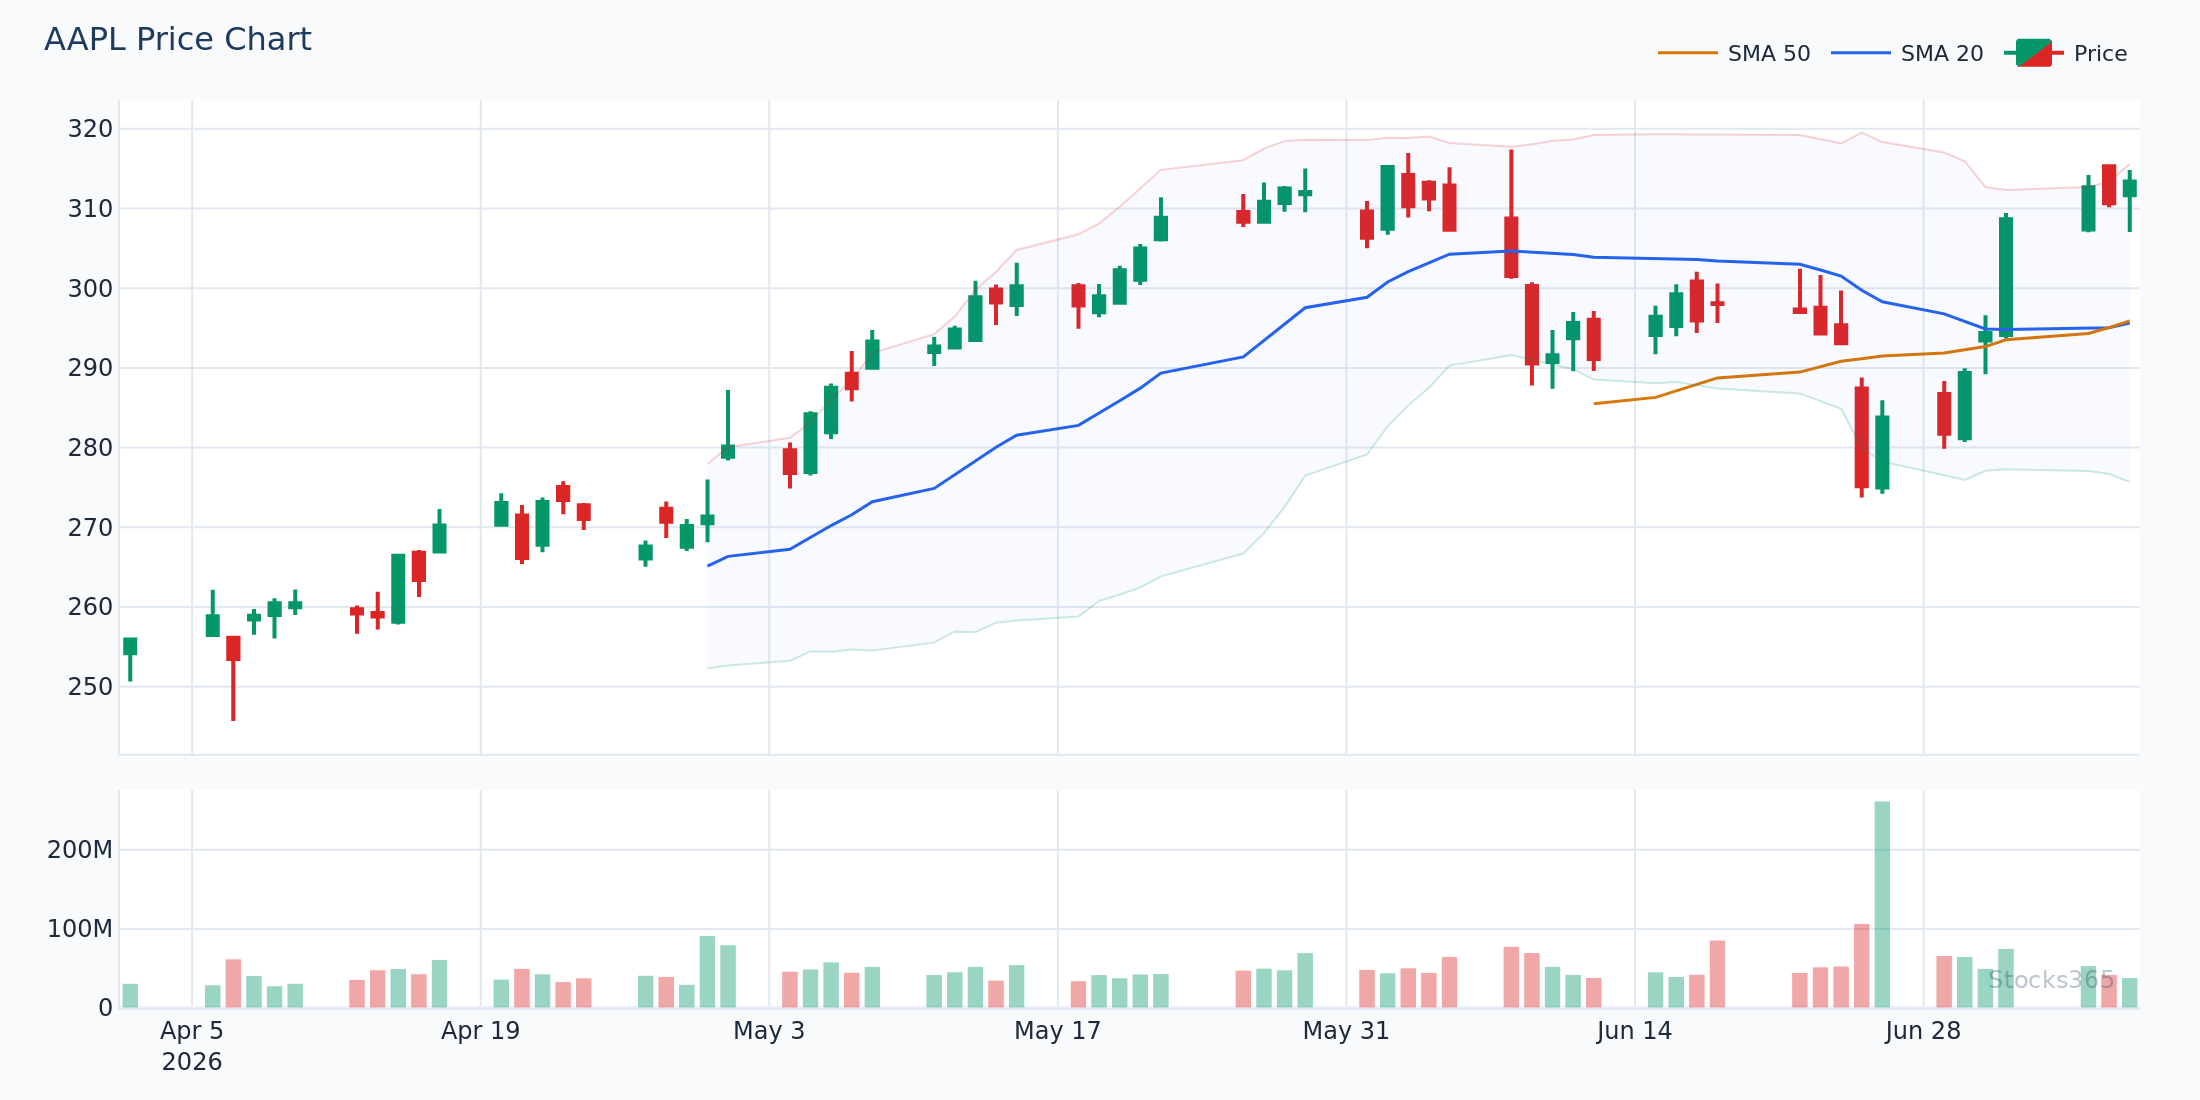
The chart displays a classic squeeze resolution: price coils for 12 sessions, band width reaches a cycle low, then a strong-bodied candle closes above the upper Bollinger Band with volume nearly double the 20-session average. This pattern, when combined with an RSI reading that crosses above 55 on the breakout candle, has historically preceded sustained trending moves rather than immediate reversals. If the next session's open falls back below the prior session's close, treat the breakout as suspect and reduce position size immediately.
2. The Upper Band Touch and Fade on Sector ETFs
Sector ETFs are mean-reverting by nature when they're not in a strong trend. A sector that rips to the upper Bollinger Band in a choppy broader market environment is more likely to pull back to the middle band than to continue running. This is the fade setup.
Here's what most traders get wrong: They see price touch the upper Bollinger Band and immediately short the ETF. That's not the setup. Touching the upper band in a trending market is normal — price can ride the upper band for weeks. The edge is waiting for price to touch the upper band, then watching for a reversal candle (bearish engulfing, shooting star, or a close back below the band) combined with weakening momentum. The touch is the alert. The reversal confirmation is the signal.
Our backtested data on 3,255 Bollinger Upper Band Touch signals shows a win rate of 49.6% with a profit factor of 0.88 over a 10-day holding period. That's a losing setup on its own. The profitable version requires a filter — and for sector ETFs, the best filter is confirming that the broader index is not in a strong uptrend at the same time.
The setup checklist for the sector ETF fade:
- Sector ETF price touches or closes above the upper Bollinger Band
- RSI is above 70 AND showing bearish divergence (price makes a new high, RSI does not)
- The broader market index ETF is trading below its own 20-SMA
- A reversal candlestick pattern appears on the daily chart
- Volume on the reversal candle exceeds the prior session's volume
Target the middle band (20-SMA) as the first take-profit. Stop loss sits above the highest wick of the setup candle.
3. The Lower Band Bounce for Index ETF Mean Reversion
When a broad-market index ETF tags the lower Bollinger Band during a broader uptrend, that's a mean-reversion opportunity back toward the 20-SMA. Simple. Reliable. Often overlooked because traders are too scared to buy something that looks like it's falling.
The key filter here is trend context. This setup only works in a longer-term uptrend. If the 50-SMA is above the 200-SMA and price is pulling back to the lower Bollinger Band on the daily chart, you're buying a dip in an uptrend — one of the most durable edges in equity markets.
For a deeper dive into moving average context, see our guide on Moving Averages for Long-Term Investors: Master Entry Points. The SMA hierarchy it covers directly supports this setup.
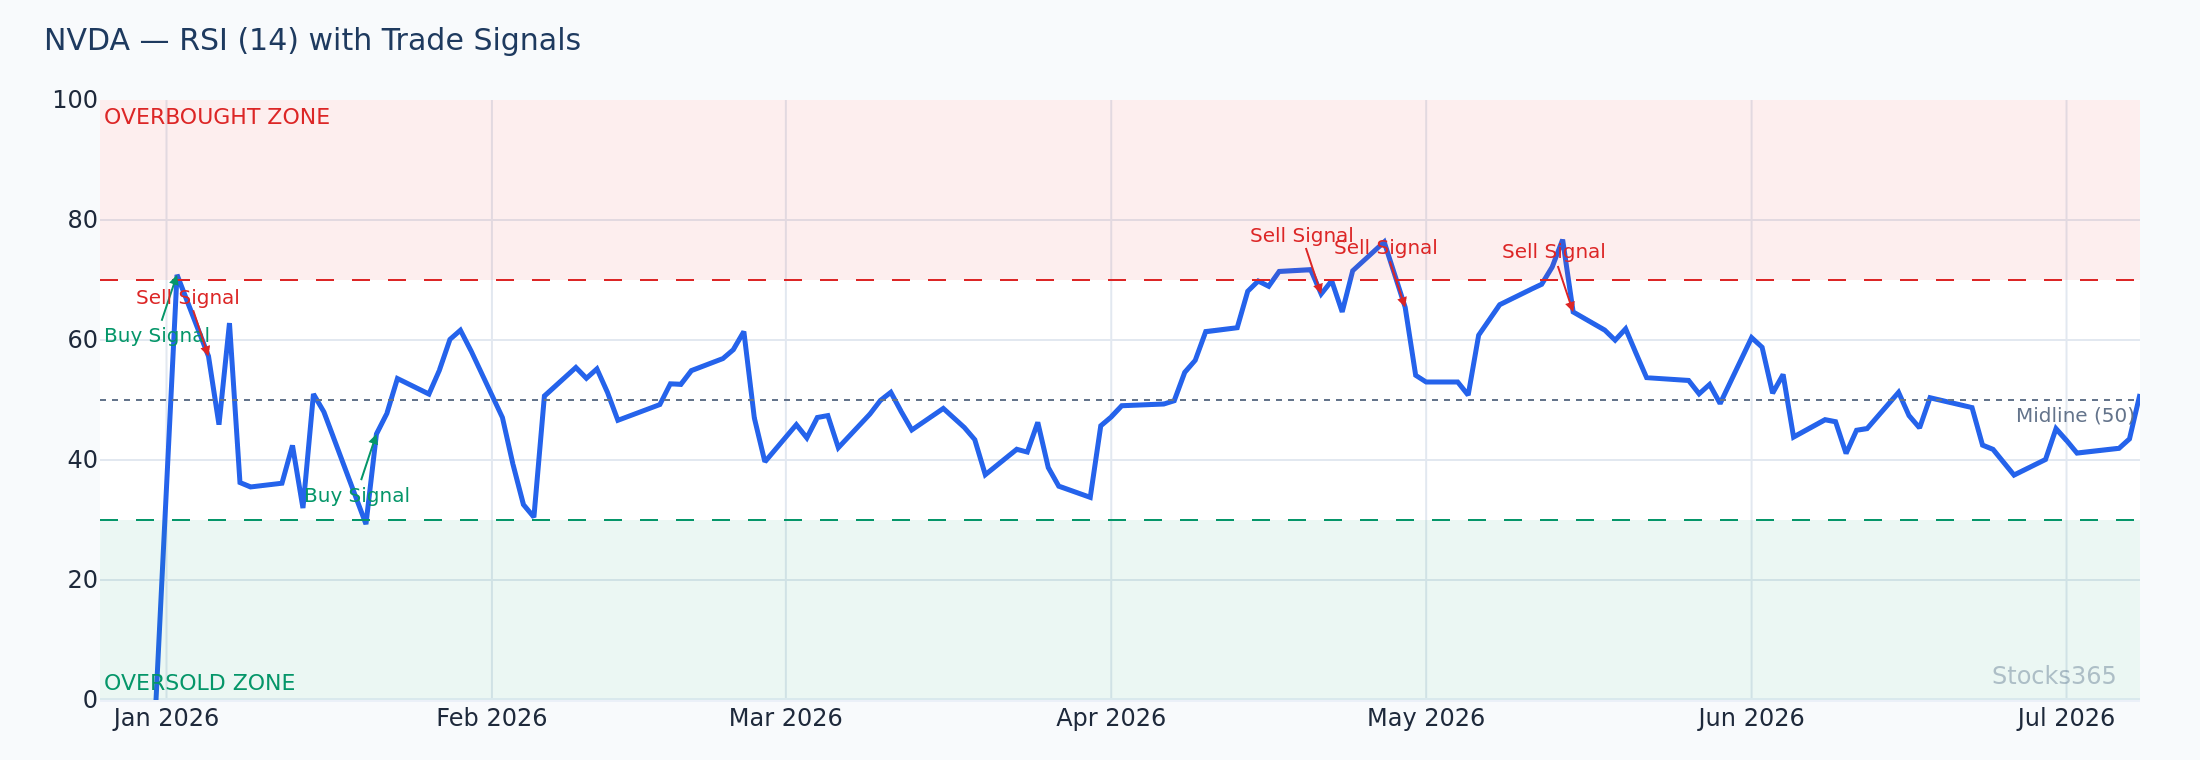
This setup shows price tagging the lower Bollinger Band while RSI simultaneously drops below 30 — the classic double-confirmation of an oversold condition. The critical element visible here is that the 50-SMA remains above the 200-SMA, confirming the longer-term uptrend is intact. Typical behavior following this pattern is a bounce back toward the 20-SMA middle band within 5–8 sessions; the pattern loses its edge if price closes below the prior swing low, signaling trend deterioration rather than a normal pullback.
Index ETFs vs. Sector ETFs: Different Band Behavior
This distinction matters more than most traders realize.
Index ETFs: Slower, Cleaner Signals
Broad-market index ETFs — tracking the S&P 500, Nasdaq 100, or total market — have lower volatility relative to their component stocks. The Bollinger Bands on these instruments are tighter, squeezes are longer in duration, and breakouts tend to follow macroeconomic catalysts. Because they're so liquid, false breakouts are less frequent, but the moves after real breakouts are also less dramatic.
For index ETFs, the squeeze breakout and lower band bounce are the two highest-quality setups. Mean reversion is strong because the index is self-correcting by design.
Sector ETFs: Faster, More Aggressive Moves
Technology, energy, financial, and biotech sector ETFs behave differently. They're concentrated. A single earnings report from a dominant holding can move the entire ETF 3–5% overnight. Bollinger Bands on sector ETFs expand and contract faster, squeezes are shorter-lived, and the fade setup becomes more relevant because sector rotation creates regular overbought conditions.
Semiconductor ETFs, for example, often show Bollinger Band squeezes lasting just 8–10 sessions before a violent expansion. Energy sector ETFs can ride the upper band for weeks during supply shocks. Knowing which regime you're in — trending or mean-reverting — determines which Bollinger Bands ETF setup to apply.
For a framework on identifying market regimes with momentum indicators, our comparison of MACD vs. Stochastic Oscillator covers regime detection in practical terms.
Combining Bollinger Bands with Other Indicators for ETF Trades
Bollinger Bands alone are not a complete system. They measure volatility and relative price position. They don't measure momentum direction, volume quality, or trend strength. You need supporting indicators.
Bollinger Bands + RSI: The Core Pairing
RSI is the most natural pairing for Bollinger Bands on ETFs. RSI measures momentum — whether buying or selling pressure is accelerating or fading. When Bollinger Band signals align with RSI confirmation, the win rate improves measurably.
The rule of thumb: for breakout trades, RSI should be above 50 and rising. For mean-reversion trades, RSI should be below 40 (ideally below 30) for the lower band bounce, or above 60 (ideally above 70) for the upper band fade. Divergence between RSI and price at either band is a particularly strong signal — see our RSI Trendline Strategy guide for how to draw these divergences systematically.
Bollinger Bands + Stochastic: Double Confirmation
For traders who want a second momentum confirmation beyond RSI, the Stochastic Oscillator provides a short-cycle view that complements Bollinger Bands well on ETF daily charts. When price touches the lower Bollinger Band and Stochastic crosses up from below 20, that's a clean dual signal.
One caution here: Stocks365 backtested 3,026 BB + Stochastic Double Overbought signals and found a win rate of just 49.9% with a profit factor of 0.91. The overbought double signal — both indicators screaming extended — does not reliably produce fade trades without additional trend context filters. The lesson: use Stochastic as a confirmation tool for momentum direction, not as a standalone trigger. Our step-by-step Stochastic guide explains exactly how to interpret the signal lines for this purpose.
Bollinger Bands + Volume
Volume confirms conviction. On ETFs, look for volume expansion on breakout candles and volume contraction during squeezes. A breakout on below-average volume is a red flag — it often signals institutional disinterest and a higher probability of a false move.
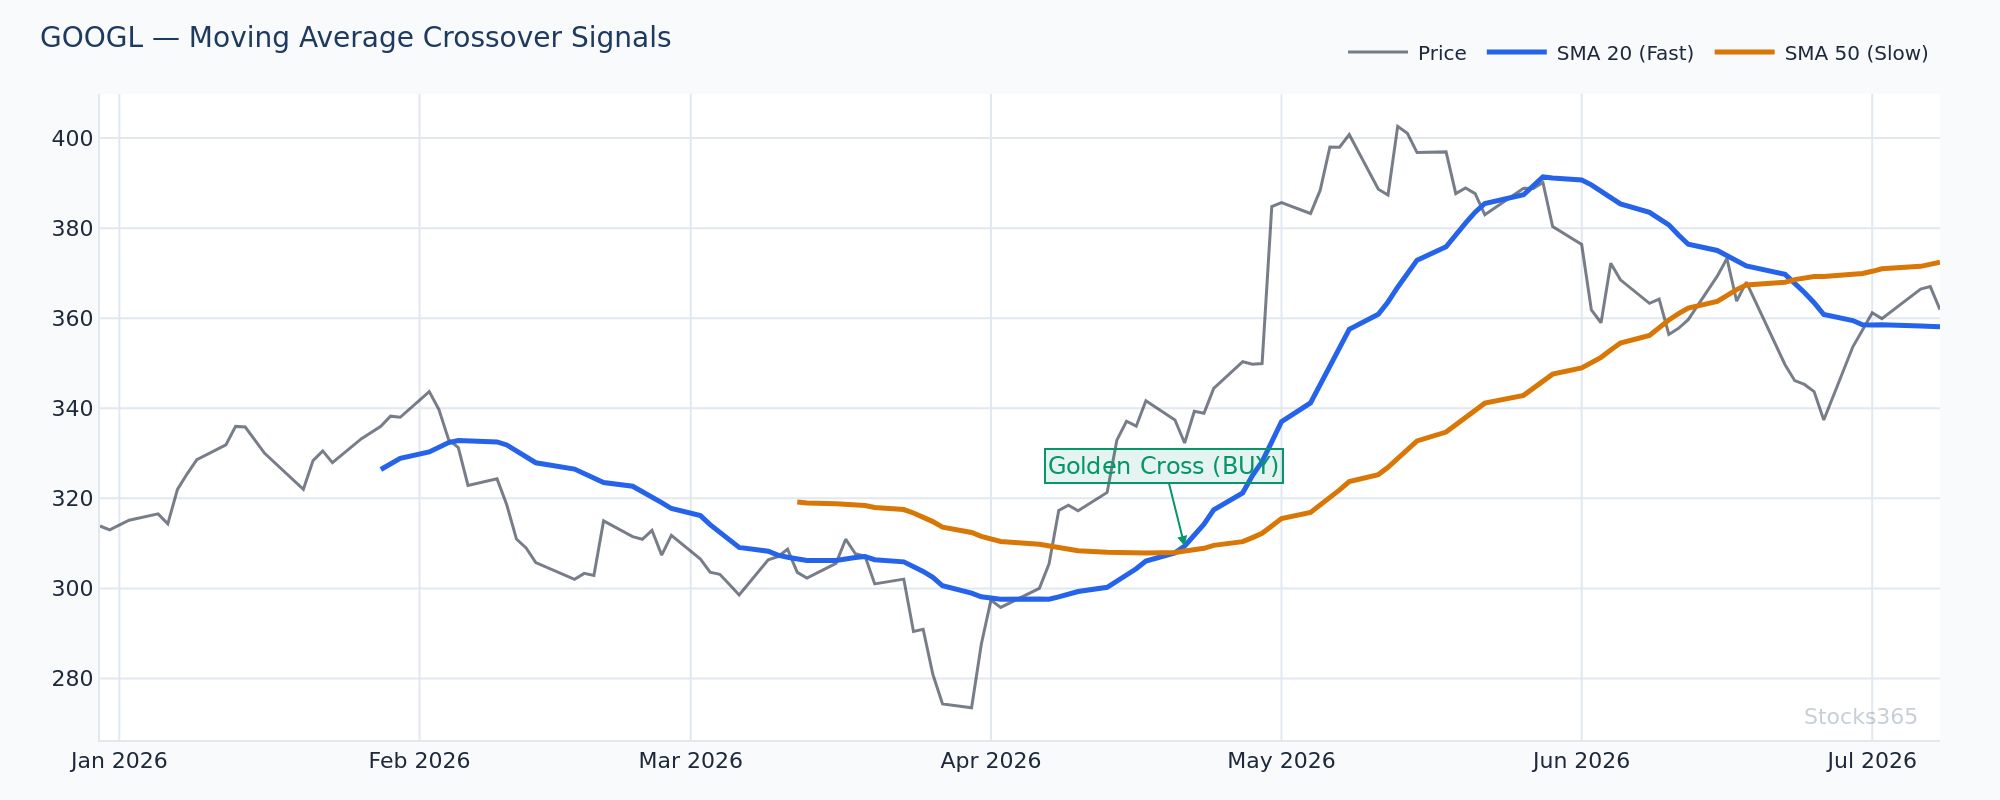
This chart illustrates why trend context matters before applying Bollinger Bands signals: when the 50-SMA crosses above the 200-SMA, lower band bounces are significantly more reliable because the macro trend is supportive. When the 50-SMA is below the 200-SMA, upper band fades become the higher-probability setup, and breakout signals above the upper band should be treated with skepticism. A Bollinger squeeze breakout that fires above the upper band during a bearish SMA alignment is far more likely to reverse than one that fires during a bullish alignment — that single filter changes the trade's profile entirely.
Practical ETF Trading Example: Applying the Squeeze Breakout Setup
Here's how a squeeze breakout plays out in practice on a technology sector ETF, described in terms of price action patterns rather than specific levels:
The ETF consolidates for three weeks following a sharp rally. Band width drops to its lowest reading in two months. Price oscillates within a tight range around the 20-SMA. Volume fades during the consolidation — exactly what you want to see. RSI sits near 50, neutral, neither overbought nor oversold.
Then: a strong session closes above the upper Bollinger Band. Volume surges well above the 20-session average. RSI crosses above 55 on the same candle. The moving average crossover on the shorter-term MAs confirms bullish momentum is rebuilding.
Entry is on the close of that breakout candle or the open of the next session. Stop loss sits below the 20-SMA. First target is the same magnitude as the distance from the 20-SMA to the upper band at the time of breakout. Second target is a 2x extension of that distance.
This is the setup. Not a guarantee — a structured, repeatable process.
ETF traders on Stocks365 can pull up real-time signals for instruments like AAPL and cross-reference Bollinger Band signals against the platform's trust score to assess signal quality before entering. The signals dashboard surfaces these setups automatically, sorted by trust score confidence.
Common Mistakes When Trading Bollinger Bands on ETFs
- Ignoring trend regime: Applying mean-reversion setups in a strong trend gets you run over. Always establish trend direction first.
- Trading band touches without confirmation: A touch is an alert, not a signal. Confirmation is the signal.
- Using default settings for all ETFs: A 20/2 Bollinger Band setting works well for index ETFs. Volatile sector ETFs may respond better to a slightly wider setting (20/2.5) to reduce noise.
- Ignoring volume: Volume is the engine. Band signals without volume confirmation are speculation, not trading.
- Forcing trades during low band-width periods: A squeeze is not a trade. Wait for the expansion. Patience is the edge.
Bollinger Bands ETF vs. Bollinger Bands for Other Asset Classes
ETFs occupy a unique middle ground in Bollinger Band performance. Unlike crypto, which shows more explosive volatility and higher win rates on band squeeze breakouts, ETFs offer more predictable, lower-magnitude moves. Unlike commodities, which show the weakest band signal performance in our backtesting, ETFs have strong mean-reversion tendencies due to their diversified composition.
If you trade crypto alongside ETFs, our guide on Bollinger Bands for Crypto Trading shows how to adapt the same framework for a much more volatile environment. The principles carry over — the calibration does not.
What to Watch For
- Squeeze setups on sector ETFs entering earnings season: When band width drops below the 20th percentile on a sector ETF in the two weeks before major earnings from that sector's dominant holdings, the breakout that follows tends to be sharper and faster than typical squeeze resolutions. Be positioned before the catalyst, not after.
- Lower band bounces in confirmed uptrends: When a broad-market index ETF tags the lower Bollinger Band while its 50-SMA remains above the 200-SMA and RSI is recovering from below 35, that combination has historically been one of the cleanest mean-reversion entries in equity markets.
- Failed upper band breakouts as reversal signals: When a sector ETF closes above the upper Bollinger Band, then closes back below it within two sessions on expanding volume, the failed breakout itself becomes a short signal. The stop loss sits above the highest point of the failed breakout sequence.
- Band width expansion following cross-sector compression: When multiple sector ETFs show simultaneous Bollinger squeezes, a macro catalyst often triggers a synchronized expansion. Watch for which sector breaks out first — it typically leads the broader move by 1–3 sessions.
- Divergence at the bands on weekly charts: When a sector ETF makes a higher price high against the upper Bollinger Band but RSI posts a lower high, the weekly timeframe divergence is a powerful warning that the sector rally is losing steam. Daily chart entries become higher risk in this context.
How Stocks365 Uses This
Bollinger Bands in the Stocks365 Trust Score System
Bollinger Bands are one of 12+ indicators integrated into the Stocks365 Trust Score — our proprietary signal quality rating that scores every trade signal from 0 to 100 before it reaches your screen.
Specifically, Bollinger Band readings contribute to two components of the Trust Score: volatility regime scoring (band width percentile determines whether the system applies breakout or mean-reversion weighting to that signal) and indicator agreement scoring (when Bollinger Band signals align with RSI, MACD, and volume signals simultaneously, the Trust Score rises, reflecting higher historical reliability).
A Bollinger squeeze breakout on a sector ETF that also shows RSI momentum confirmation and above-average volume will score significantly higher on the Trust Score than a band touch with no supporting confirmation. The system does the multi-indicator cross-referencing automatically — so you see the quality score, not just the raw signal.
View live ETF signals and their Trust Scores on the Stocks365 signals dashboard.
Key Takeaways
- ETFs are ideal for Bollinger Bands — diversification reduces single-stock noise and produces cleaner signal patterns than individual equities.
- The squeeze breakout is the highest-priority setup for both index and sector ETFs. Wait for the compression, then trade the expansion — not the other way around.
- Trend regime determines which setup to use: bullish trend = buy lower band bounces; choppy/bearish = fade upper band touches with confirmation.
- Band touches are alerts, not signals. Confirmation from RSI, volume, or candlestick patterns is required before entry.
- Sector ETFs move faster than index ETFs — shorten your expected holding period and tighten your stops accordingly.
- The Stocks365 Trust Score integrates Bollinger Band volatility and agreement signals automatically, surfacing only the highest-quality setups in the dashboard.