
Bollinger Bands Forex Trading: The Currency Pair Setups You Need
Most forex traders treat Bollinger Bands as a simple overbought/oversold tool. They see price touch the upper band and sell. They see it touch the lower band and buy. Then they wonder why they keep losing.
Bollinger Bands are a volatility and mean-reversion framework — not a buy/sell trigger. In forex, where major currency pairs can trend relentlessly for weeks, that distinction matters more than anywhere else. Getting it right separates profitable setups from expensive mistakes.
Stocks365 backtested 14,266 Bollinger Squeeze Breakout signals across asset classes and found an overall win rate of 49.5% — but the performance splits dramatically by market type, with forex coming in as the worst-performing asset class at 47.1%. That number tells you something important: Bollinger Bands in forex require a more refined approach, not a mechanical one. Understanding exactly when and how they work in currency markets is what this guide is about.
How Bollinger Bands Work in the Forex Context
Before diving into setups, you need the foundation. If you want the full mathematical breakdown, read How Bollinger Bands Work: Master the Math Behind It — it covers everything from standard deviation calculations to band width interpretation.
The short version: Bollinger Bands plot a 20-period simple moving average (the middle band) with an upper and lower band set two standard deviations away. In forex, the default 20-period setting on a 4-hour chart captures roughly three to four trading days of price action — a meaningful window for short-term setups.
Three core properties define how they behave in currency markets:
- Band Width — Narrow bands signal low volatility and compression. Wide bands signal high volatility and expansion. Forex pairs cycle between these states constantly.
- Band Walks — In a strong trend, price can ride the upper or lower band for extended periods. This is where most beginner traders get destroyed fading the move.
- Mean Reversion Pull — After extreme moves, price tends to snap back toward the 20-SMA. The middle band acts as a magnetic center in ranging markets.
Forex is unique because it operates 24 hours across multiple sessions — London, New York, Tokyo, Sydney. Volatility compresses during off-hours and expands at session opens. Bollinger Bands capture this rhythm naturally, making them especially readable on 1-hour and 4-hour timeframes for major pairs.
[CHART:bb_squeeze:EURUSD:Bollinger Band squeeze forming on EUR/USD 4-hour chart before London session open]This chart shows a classic compression setup where band width has narrowed significantly heading into a major session open — exactly the condition that precedes a directional breakout. When price finally breaks above the upper band with volume confirmation, the initial expansion move typically carries one to two ATR before the first meaningful pullback. If price breaks out but immediately reverses back inside the bands within one or two candles, treat that as a failed breakout and stand aside.
The Three Core Bollinger Bands Forex Setups
Setup 1: The Squeeze Breakout on Major Pairs
The squeeze is the most powerful Bollinger Bands forex setup. It works on the simple premise that low volatility precedes high volatility — always. When band width compresses to multi-week lows, a breakout is coming. The question is direction.
Here's the exact pattern to look for on currency pairs like EUR/USD, GBP/USD, and USD/JPY:
- Band width drops below the 20th percentile of its 125-period lookback (this is the squeeze trigger)
- Price coils inside a tight range, often forming a series of doji or inside candles
- A momentum indicator — MACD or RSI — begins showing directional bias before the breakout
- Price closes outside the upper or lower band on above-average volume
- The following candle holds above the breakout level
For a deeper dive into squeeze mechanics, Bollinger Band Squeeze: Master Low Volatility Setups covers the full methodology including band width percentile calculations.
The squeeze works best on major pairs during the London-New York overlap — typically between 8 AM and 12 PM EST. Liquidity is highest, spreads are tightest, and breakouts are more likely to follow through.
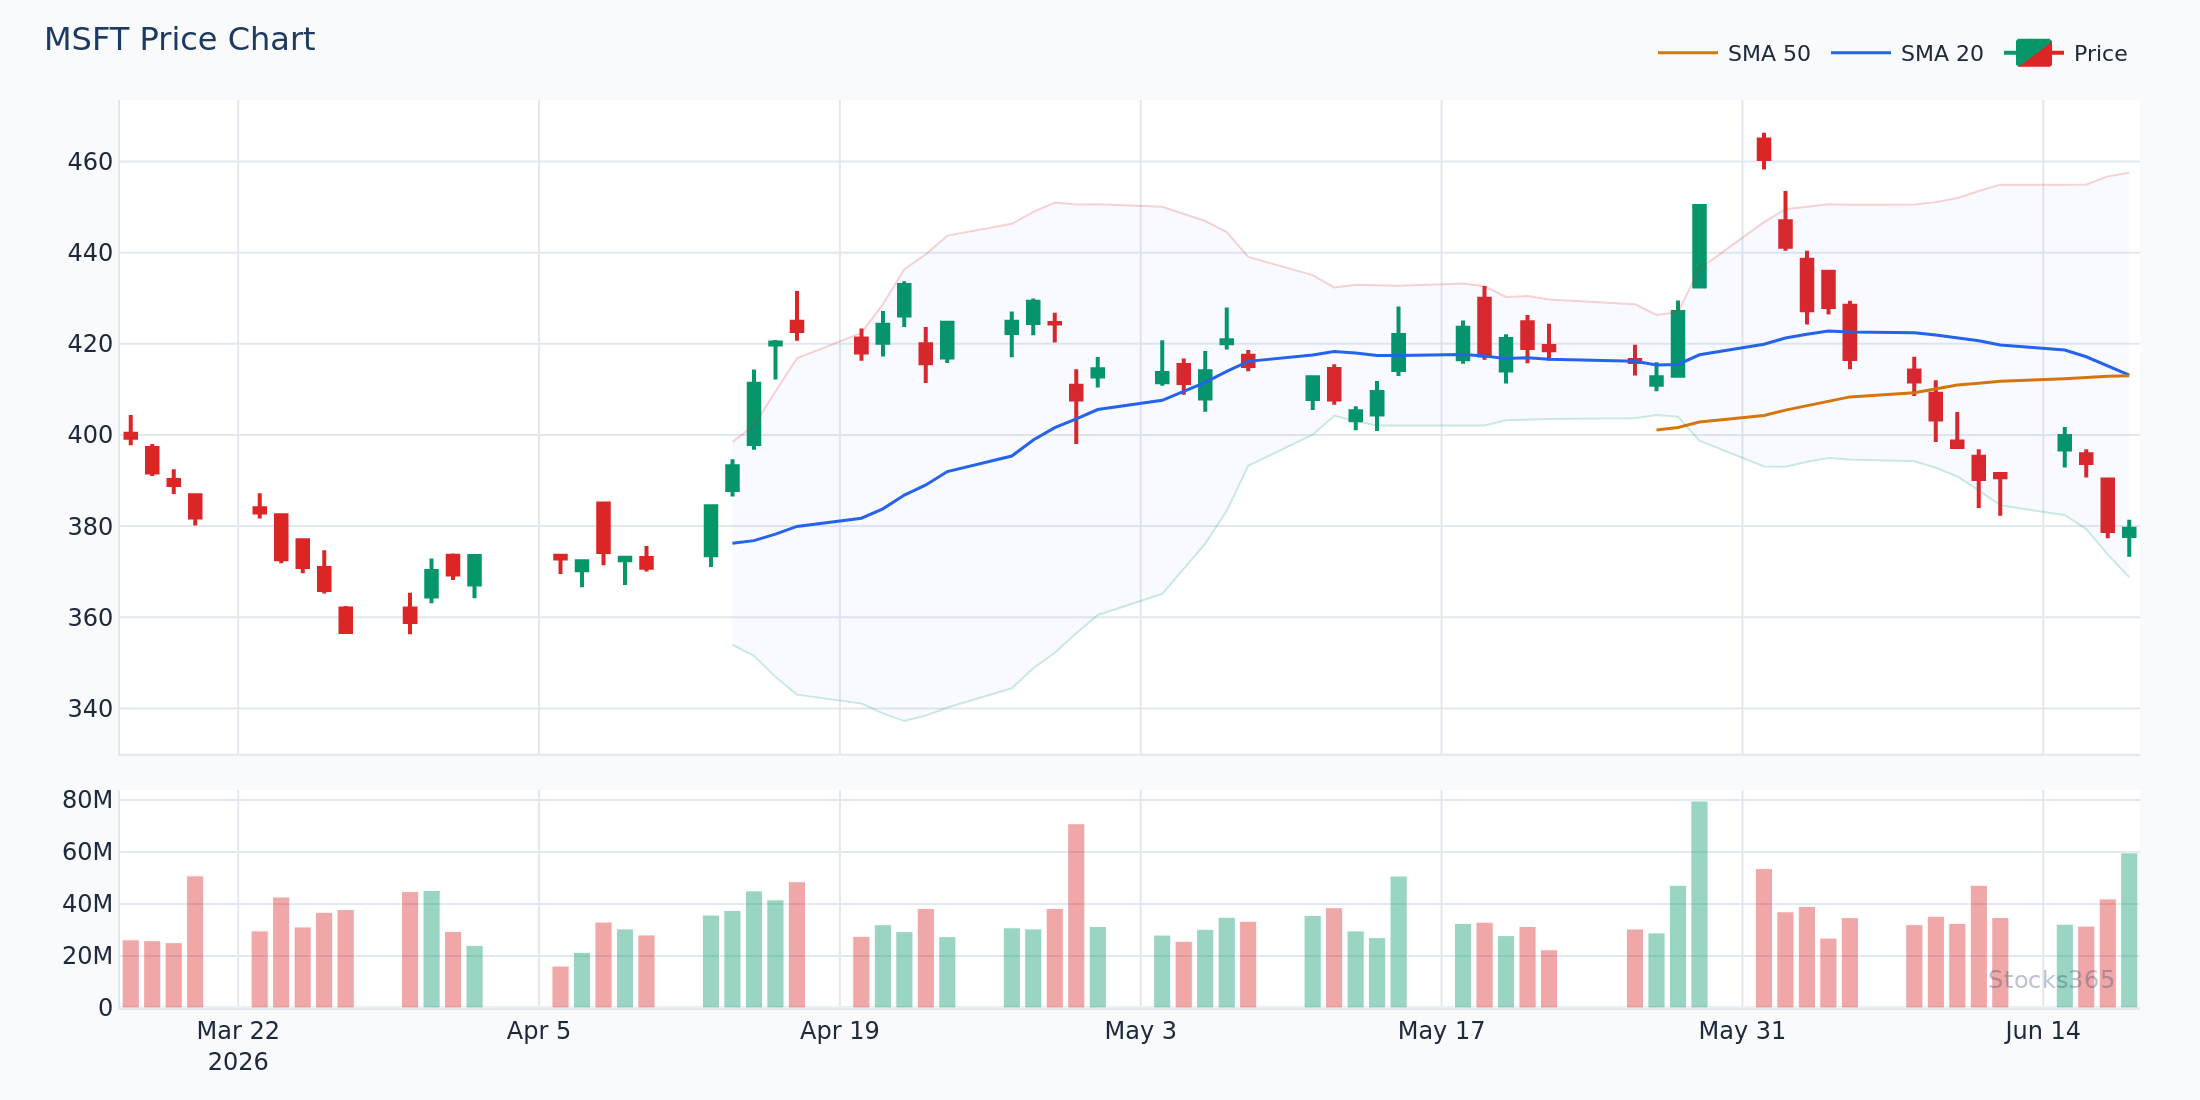
The setup above illustrates how a prolonged compression period resolves into a sharp directional move once the bands begin expanding. Confirmation arrives when the breakout candle closes fully outside the band — not just wicks through it. A failed signal occurs when price closes back inside the bands within two candles of the breakout, suggesting the move was a stop-hunt rather than genuine directional momentum.
Setup 2: Band Touch + Reversal in Ranging Markets
When a currency pair is ranging — think EUR/USD consolidating between key structural levels for several sessions — band touches become high-probability mean-reversion entries.
The setup:
- Identify a range: price has respected upper and lower boundaries for at least 10-15 candles on your timeframe
- Price touches or slightly penetrates the upper band (overbought territory in the range context)
- RSI is above 65 or the Stochastic Oscillator crosses below its signal line from above 80
- A bearish reversal candle forms at the band touch — engulfing, pin bar, or shooting star
- Entry on the next candle open, stop above the band touch candle's high
The same logic applies in reverse at the lower band. Price touches lower band, RSI drops below 35, bullish reversal candle forms, enter long.
Here's what most traders get wrong: they apply this mean-reversion setup in trending markets. When EUR/USD is in a defined uptrend, touching the upper Bollinger Band is not a sell signal — it's confirmation of strength. A band touch in a trend means price is accelerating, not exhausting. The classic beginner error is fading a band walk and getting steamrolled. Always determine market regime first. Is this a range or a trend? The answer dictates your entire approach.
Setup 3: The Double Band Strategy for Trending Pairs
For trending currency pairs — USD/JPY in a sustained dollar strength environment, or GBP/USD during a defined directional phase — the Double Bollinger Bands Strategy provides a structured framework to stay in the trend longer without chasing entries.
The core idea: plot two sets of Bollinger Bands — one at 2 standard deviations (standard) and one at 1 standard deviation. This creates three zones:
- Buy Zone: Between the 1SD upper band and 2SD upper band — price is trending up strongly
- Neutral Zone: Between the 1SD upper and 1SD lower bands — no clear trend bias
- Sell Zone: Between the 1SD lower band and 2SD lower band — price is trending down strongly
In an uptrending pair, enter longs when price retraces into the buy zone. Hold while price stays above the 1SD upper band. Exit when price closes back into the neutral zone. This approach keeps you aligned with the trend while giving precise entry and exit rules.
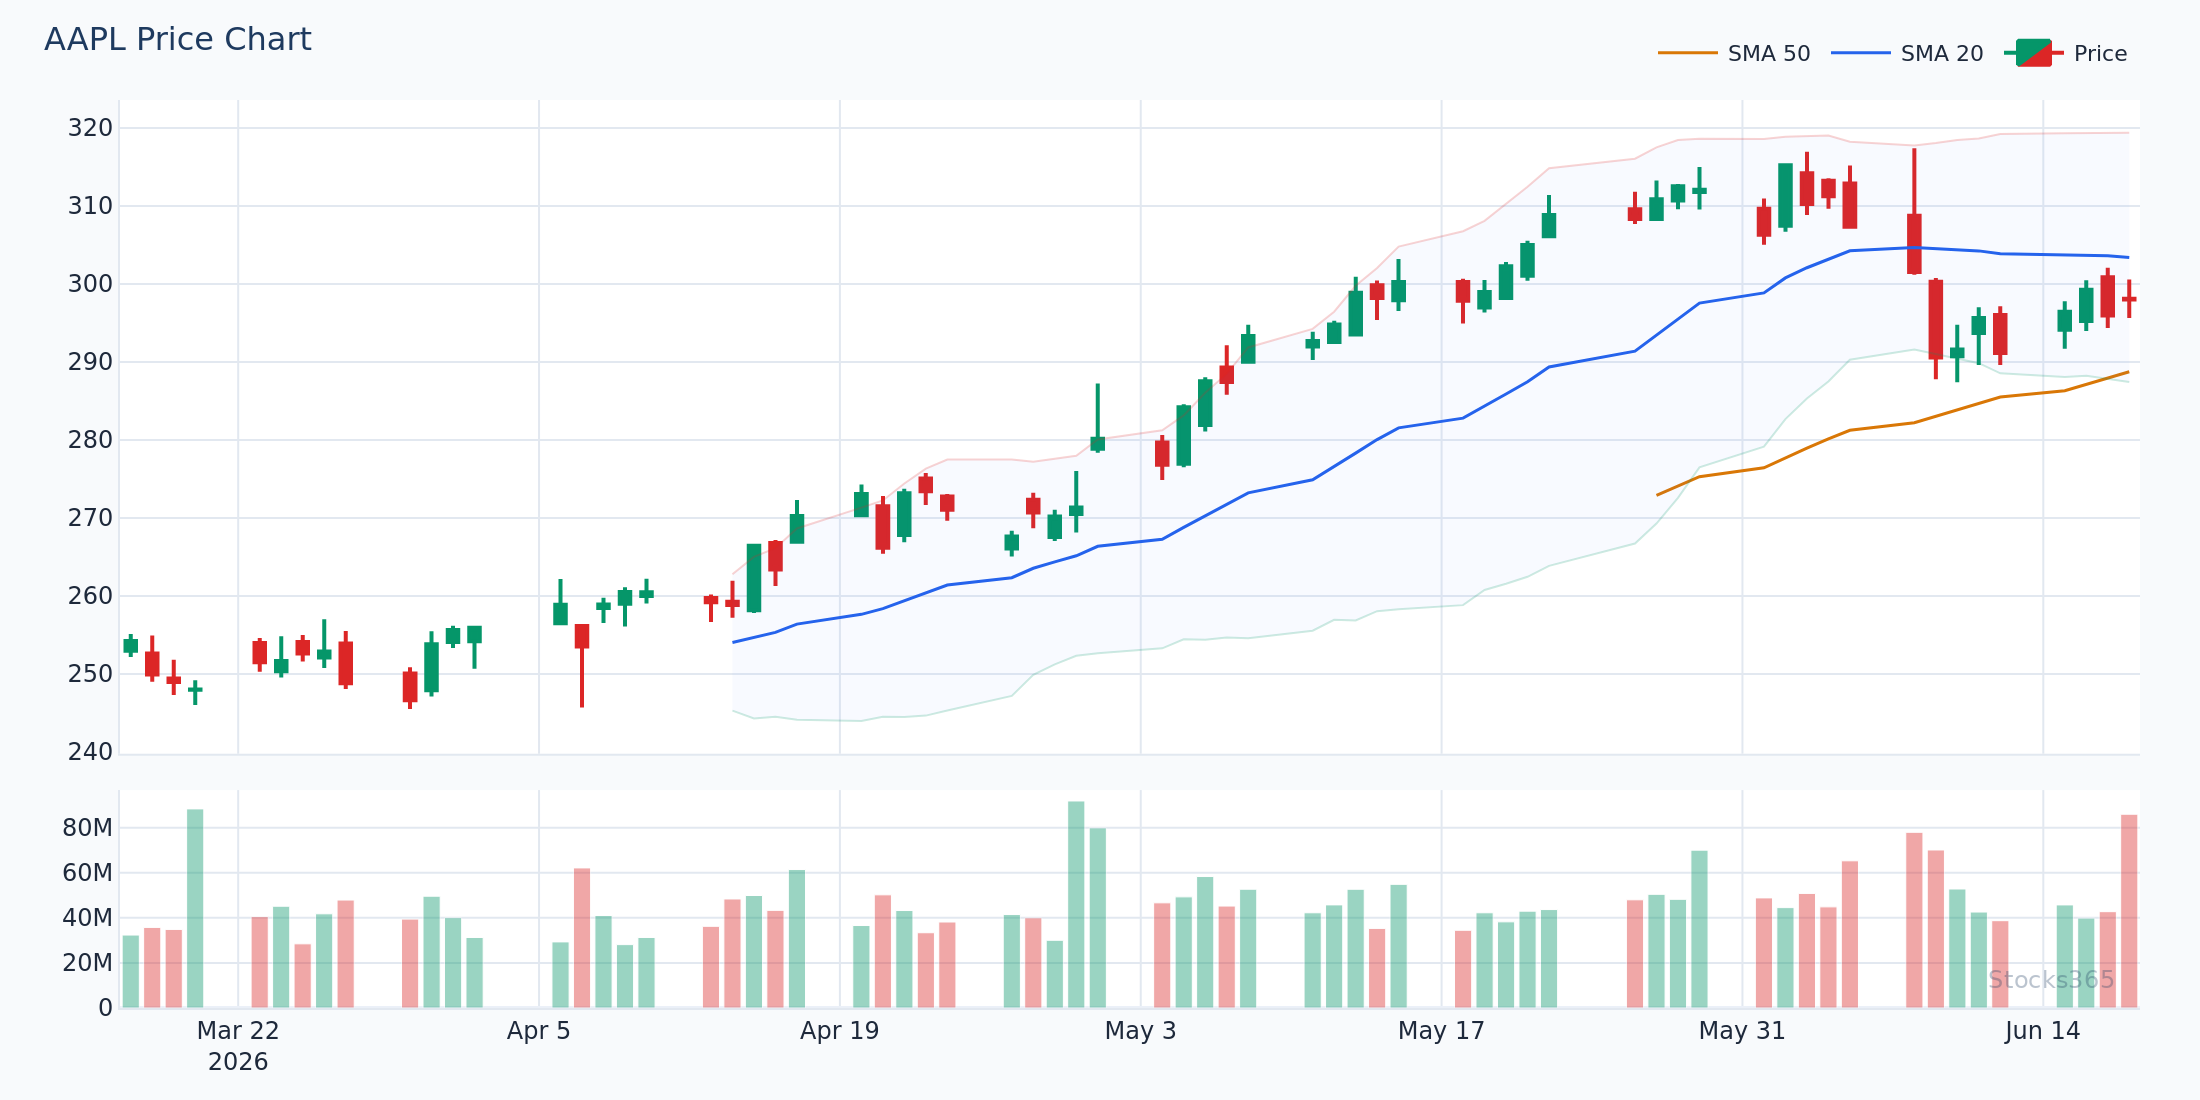
This pattern shows price respecting the buy zone through multiple pullbacks — each dip into the zone between the 1SD and 2SD upper bands held as support before continuation. The trade invalidates when price closes decisively below the 20-SMA (middle band), signaling a potential trend reversal rather than a routine pullback. Watch for confluence with a moving average crossover signal — a concept explored further in Golden Cross vs Death Cross: The Complete Market Guide.
Currency Pair Selection: Which Pairs Work Best
Not all currency pairs respond to Bollinger Bands the same way. Pair selection matters.
Major Pairs: EUR/USD, GBP/USD, USD/JPY
Majors are the sweet spot for Bollinger Bands forex strategies. High liquidity means cleaner price action, tighter spreads, and breakouts that follow through more reliably. The EUR/USD on a 4-hour chart is arguably the most Bollinger-friendly market on the planet. Band squeezes resolve cleanly, mean-reversion setups respect band levels, and the double band trend-following approach works across different volatility regimes.
Cross Pairs: EUR/GBP, GBP/JPY, EUR/JPY
Cross pairs offer opportunity but come with caveats. GBP/JPY — the "Dragon" — is notoriously volatile. Band touches on GBP/JPY require wider stops and smaller position sizes. EUR/GBP, by contrast, is one of the tightest-ranging pairs in forex, making it excellent for band-touch mean-reversion setups when it's consolidating.
Exotic Pairs: Use Caution
Exotic pairs like USD/TRY or USD/ZAR have wide spreads and gap risk that make Bollinger Band setups unreliable. The math works in theory. The execution kills you in practice.
Stick to majors and liquid crosses until you have consistency.
Combining Bollinger Bands with Other Forex Indicators
Bollinger Bands + RSI
The classic pairing. RSI confirms whether a band touch has genuine reversal momentum. When price touches the upper band AND RSI crosses back below 70, the probability of a mean-reversion move increases significantly. Read the full breakdown in RSI Indicator: The Complete Trading Guide for 2026.
One caveat worth noting from RSI Backtesting Results: Does RSI Actually Work? — RSI alone has modest standalone performance. The edge comes from combining it with price structure and volatility context, which is exactly what Bollinger Bands provide.
Bollinger Bands + MACD
Use MACD to confirm breakout direction during a squeeze. When band width compresses and MACD histogram starts expanding in one direction before the breakout, you have early directional bias. Enter on the breakout candle, not before. The MACD signal gives context; the band breakout gives the trigger.
Bollinger Bands + Stochastic for Ranging Markets
For the band-touch reversal setup in ranging markets, the Stochastic Oscillator is often more responsive than RSI. When price hits the upper band and Stochastic crosses bearishly from above 80, the confluence is tight and the reversal signal is high-quality.
Our research on BB + Stochastic Double Overbought signals (n=3,026) shows a 49.9% win rate with a profit factor of 0.91 across a 10-day holding period. In isolation, the numbers are marginal. But filtered for specific market regimes — ranging structure, defined support/resistance, liquid pairs — the signal quality improves materially. Check our research dashboard for the full breakdown by asset class and setup type.
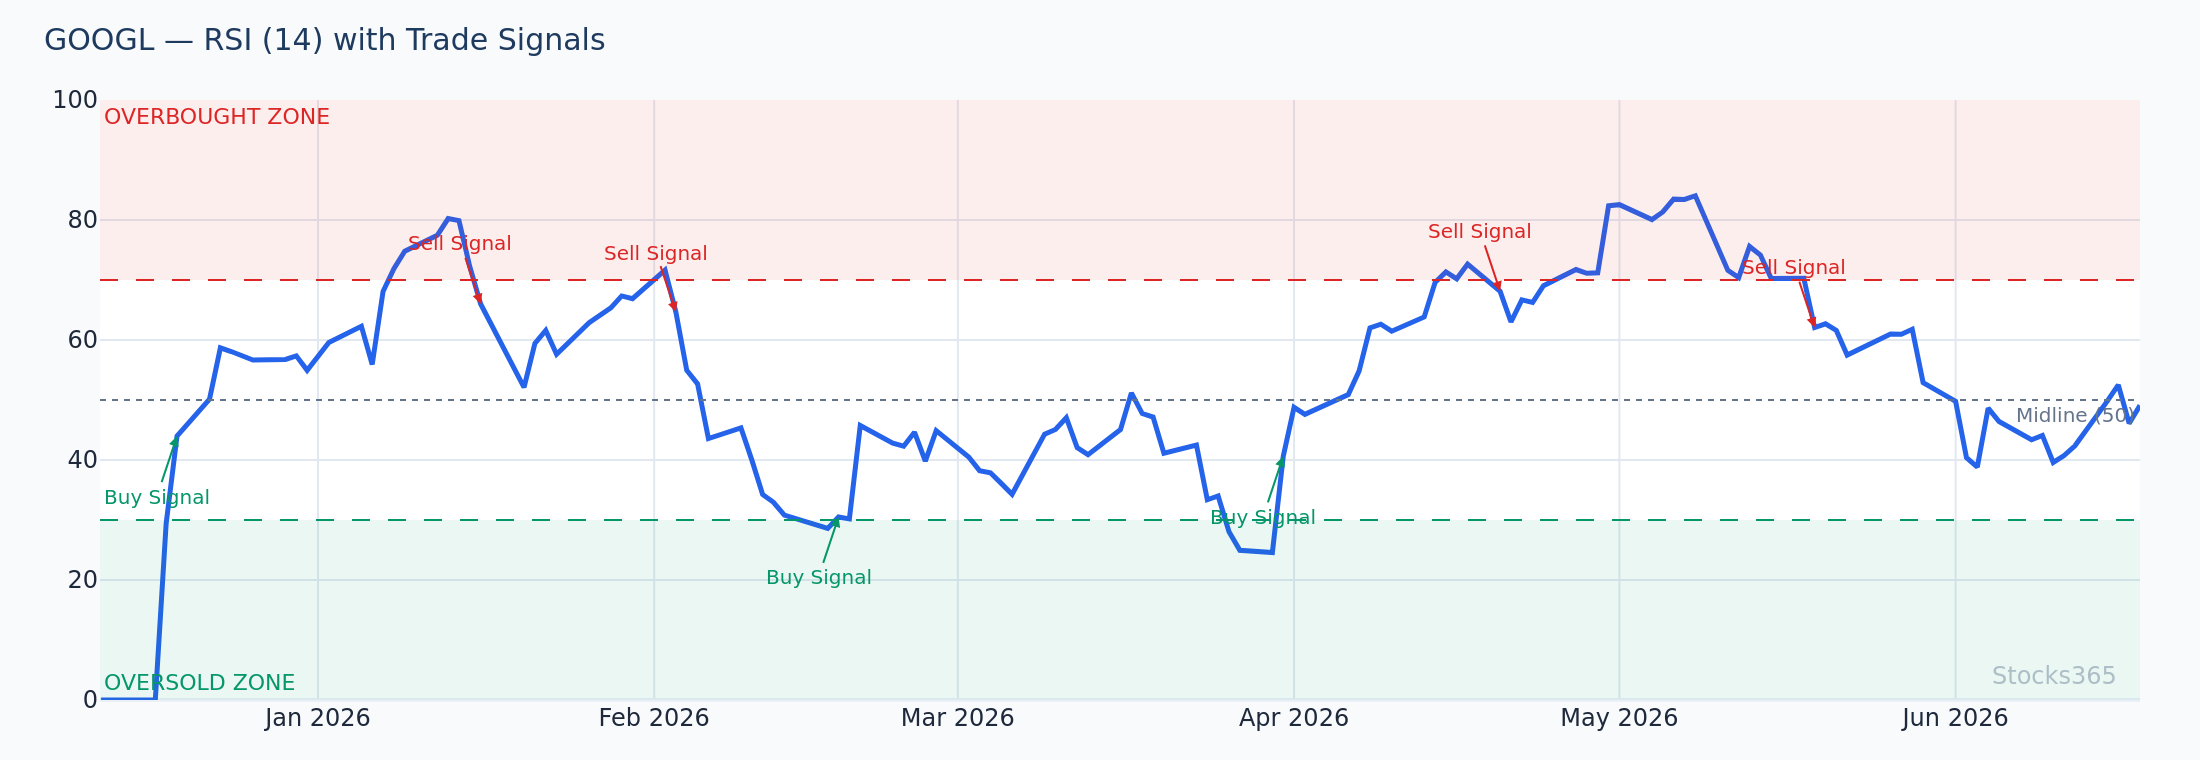
This chart illustrates how RSI divergence at a band touch — price makes a new high while RSI makes a lower high — flags exhaustion before the actual reversal. The divergence alone isn't a trigger, but when combined with a bearish reversal candle at the upper band, it creates a high-conviction short entry in a ranging market. The setup fails if price closes above the upper band by more than 0.5 ATR on the next session, suggesting trend continuation rather than reversal.
Timeframe Selection for Bollinger Bands Forex Trading
Timeframe is everything in forex. The same Bollinger Band setup that works on a 4-hour chart becomes noise on a 5-minute chart.
- 4-Hour Chart: Best for swing setups, squeeze breakouts, and double band trend-following. Filters out intraday noise while capturing multi-day moves.
- 1-Hour Chart: Good for intraday setups during London and New York sessions. Band touches at session-open levels can produce sharp reversals.
- Daily Chart: Best for identifying the macro regime — trending or ranging. Use daily bands to define the overall context, then drop to 4H for entry precision.
- 15-Minute and Below: Bollinger Bands generate too many false signals at these timeframes in forex. Spreads and slippage erode any edge that exists on paper.
The rule: use the daily chart to read the regime, 4-hour for setup identification, 1-hour for entry timing. Three timeframes. No more.
Risk Management for Bollinger Bands Forex Setups
The setup is only half the equation. Risk management determines whether you survive long enough to see the edge play out.
For squeeze breakouts: place your stop on the opposite side of the band at the time of entry. If you're entering a long on a break above the upper band, your stop goes below the middle band (20-SMA). This gives the trade room to develop without getting clipped by normal volatility.
For band-touch reversals: stop goes just beyond the band touch extreme — one ATR past the wick high for short entries, one ATR below the wick low for long entries.
Target sizing for forex Bollinger Band setups:
- Squeeze breakouts: target 2:1 reward-to-risk minimum. These moves can run 3-5 ATR after a prolonged compression, so don't take profits too early.
- Band-touch reversals: target the middle band (20-SMA) as the primary objective. Secondary target is the opposite band if range conditions are well-defined.
Risk 1% of capital per trade. Maximum. Forex leverage is brutal to the undisciplined.
What to Watch For
- Bollinger squeeze on EUR/USD 4H ahead of major economic releases — When band width drops below the 20th percentile of its 125-period range and a Fed or ECB announcement is within 24 hours, the subsequent breakout often produces a 2-3 ATR move. Wait for the candle to close outside the band before entering.
- Upper band touches on GBP/USD during extended consolidation phases — When the pair has been ranging for 10+ sessions and price touches the upper band with RSI crossing back below 70, the mean-reversion move typically targets the 20-SMA and sometimes the lower band. Requires a clear bearish reversal candle for confirmation.
- Double band buy zone entries on USD/JPY in established uptrends — When USD/JPY is trending with price consistently above the 20-SMA and pullbacks into the 1SD upper band zone hold, these dip entries align with trend continuation. Exit when price closes back below the middle band.
- Band width expansion after multi-week compression on cross pairs like EUR/JPY — When band width expands rapidly after a squeeze, the first major pullback to the expanding upper band (in an upside breakout) often provides a second entry for traders who missed the initial move.
- Failed band breakouts on low-liquidity exotic pairs — Price closing back inside the bands within two candles of a breakout signals a false move. This pattern — common on illiquid pairs during off-hours — is best avoided entirely; trade majors during peak sessions instead.
How Stocks365 Uses This
Bollinger Bands in the Stocks365 Trust Score System
Stocks365 integrates Bollinger Band analysis as one of 12+ technical indicators contributing to our proprietary Trust Score. Specifically, Bollinger Band signals feed into two scoring dimensions: the volatility regime component — which assesses whether a market is in compression or expansion — and the indicator agreement component, which measures confluence between Bollinger Band signals and momentum indicators like RSI and MACD.
When our system detects a Bollinger squeeze with concurrent MACD directional bias, the Trust Score for that signal increases. Conversely, a band-touch signal without momentum confirmation scores lower, flagging it as lower-conviction. This layered approach — rather than treating any single indicator as definitive — is what drives the signal quality you see on our signals dashboard. Every signal on Stocks365 carries a Trust Score that reflects this multi-indicator consensus, giving you a fast read on setup quality without manually checking each indicator yourself.
Key Takeaways
- Bollinger Bands in forex require regime identification first — trending markets demand different approaches than ranging markets. Never apply band-touch reversals in a trending pair.
- The squeeze breakout is the highest-quality setup on major pairs, particularly during high-liquidity sessions. Wait for a confirmed close outside the band before entering.
- Combine with RSI, MACD, or Stochastic for confirmation. Standalone Bollinger Band signals have modest win rates; confluence is where the edge lives.
- 4-hour and daily charts provide the most reliable signals in forex. Sub-hourly timeframes generate too much noise.
- Major pairs — EUR/USD, GBP/USD, USD/JPY — produce the cleanest Bollinger Band setups due to high liquidity and tight spreads.
- The Double Bollinger Bands Strategy provides a structured framework for staying in trending currency pairs longer without chasing entries.
- Risk management is non-negotiable: 1% per trade, stops placed at logical Bollinger Band levels, minimum 2:1 reward-to-risk on breakout trades.
Frequently Asked Questions
What are the best Bollinger Bands settings for forex trading?
The default settings — 20-period SMA with 2 standard deviations — work well for most forex applications on the 4-hour and daily chart. Some traders adjust to a 21-period SMA to align with Fibonacci numbers, but the difference is marginal. What matters more than tweaking settings is applying the correct setup type for the market regime: squeeze breakouts in trending conditions, band-touch reversals in ranging conditions.
Do Bollinger Bands work on all currency pairs?
They work best on major pairs — EUR/USD, GBP/USD, USD/JPY — where high liquidity produces clean price action and reliable band interactions. Liquid cross pairs like EUR/JPY and GBP/JPY also work, though the latter's high volatility requires wider stops. Exotic pairs with wide spreads and gap risk are poor candidates for Bollinger Band strategies regardless of how good the setup looks on paper.
What is a Bollinger Band squeeze in forex and why does it matter?
A Bollinger Band squeeze occurs when band width compresses to abnormally low levels — typically below the 20th percentile of its recent range. It signals that volatility has contracted sharply and a significant directional move is imminent. In forex, squeezes frequently occur ahead of major economic data releases (NFP, CPI, central bank decisions) and at key session opens. When the squeeze resolves, the breakout move often carries 2-3 ATR before a meaningful pullback, making it one of the highest-potential setups in currency trading.
Should I combine Bollinger Bands with RSI for forex trading?
Yes — this is one of the most effective combinations for forex. RSI confirms whether a band touch has genuine reversal momentum (look for RSI crossing back below 70 at upper band touches, or above 30 at lower band touches) and provides divergence signals that Bollinger Bands alone cannot show. For squeeze breakouts, MACD directional bias pre-breakout is often more useful than RSI. The key principle is using Bollinger Bands for volatility context and a momentum indicator for directional confirmation — never relying on either in isolation.
What is the best timeframe to use Bollinger Bands on forex charts?
The 4-hour chart is the sweet spot for most Bollinger Bands forex strategies. It filters out intraday noise, captures multi-day momentum moves, and aligns well with the natural rhythm of major forex sessions. Use the daily chart to establish the macro regime (trending vs. ranging) and the 4-hour chart for setup identification and entry timing. Timeframes below 1 hour generate excessive false signals in forex due to spread costs and intraday volatility patterns.