
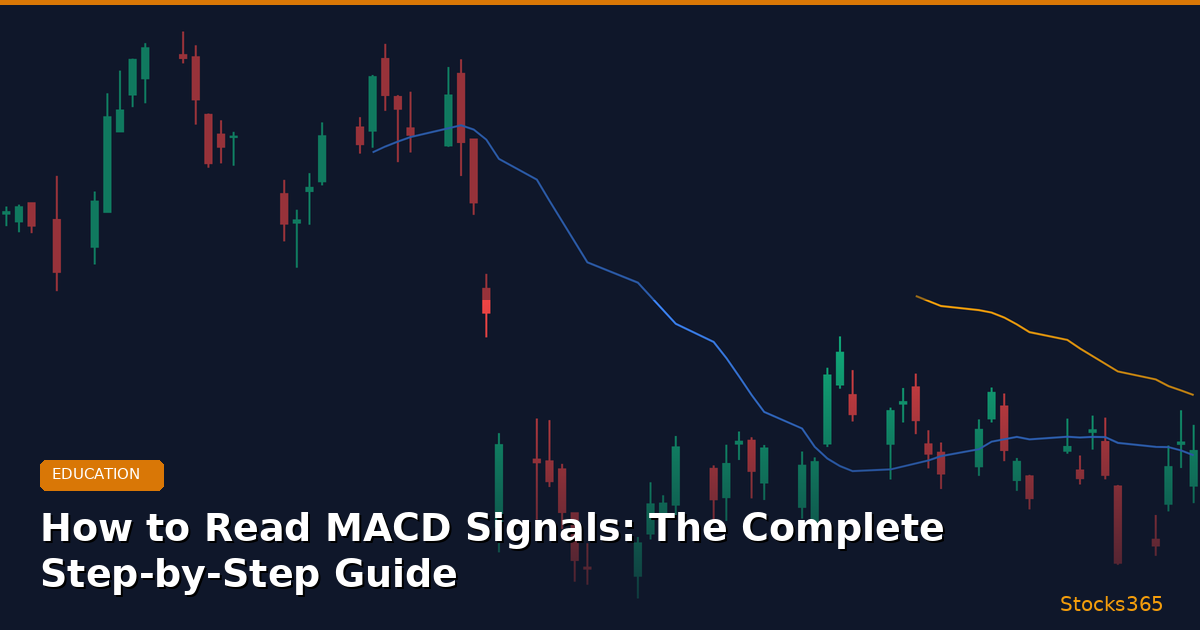
How to Read MACD Signals: A Complete Step-by-Step Guide
The Moving Average Convergence Divergence (MACD) is one of the most powerful and widely used technical indicators in trading. Whether you're analyzing stocks, crypto, or forex, knowing how to read MACD signals can dramatically improve your entry and exit timing. Yet despite its popularity, many traders misread MACD signals — or use them in isolation and wonder why they keep getting burned.
This guide breaks down every component of the MACD indicator from the ground up, with real trading examples, actionable signal interpretation, and tips for combining MACD with complementary tools like the RSI. By the end, you'll be reading MACD signals with genuine confidence.
- MACD consists of three parts: the MACD line, the Signal line, and the Histogram.
- Crossovers between the MACD and Signal lines are the most common trade triggers.
- Histogram bars reveal momentum strength — their size and direction matter as much as crossovers.
- MACD divergence is one of the most powerful leading signals in technical analysis.
- Combining MACD with RSI and volume confirmation dramatically reduces false signals.
- Stocks365's trust score helps you validate MACD signals with multi-indicator confluence.
What Is MACD? Understanding the Basics
Before you can read MACD signals, you need to understand what the indicator is actually measuring. MACD tracks the relationship between two exponential moving averages (EMAs) of a stock's price, revealing both trend direction and momentum shifts.
The standard MACD uses three settings, often written as (12, 26, 9):
- Fast EMA: 12-period exponential moving average
- Slow EMA: 26-period exponential moving average
- Signal Line: 9-period EMA of the MACD line itself
These three numbers produce the three visual components you'll see on any MACD chart:
The Three Components of a MACD Indicator
- MACD Line: Calculated as the 12-period EMA minus the 26-period EMA. When the fast EMA is above the slow EMA, the MACD line is positive. When below, it's negative.
- Signal Line: A 9-period EMA smoothed over the MACD line. It acts as a trigger for buy and sell signals.
- Histogram: The visual bar chart showing the difference between the MACD line and the Signal line. Expanding bars = increasing momentum. Shrinking bars = weakening momentum.
Step 1 — Reading the MACD Line and Signal Line Crossover
The most fundamental MACD signal is the crossover — and it comes in two forms: bullish and bearish.
Bullish MACD Crossover (Buy Signal)
A bullish crossover occurs when the MACD line crosses above the Signal line. This suggests upward momentum is accelerating and often precedes a price rally.
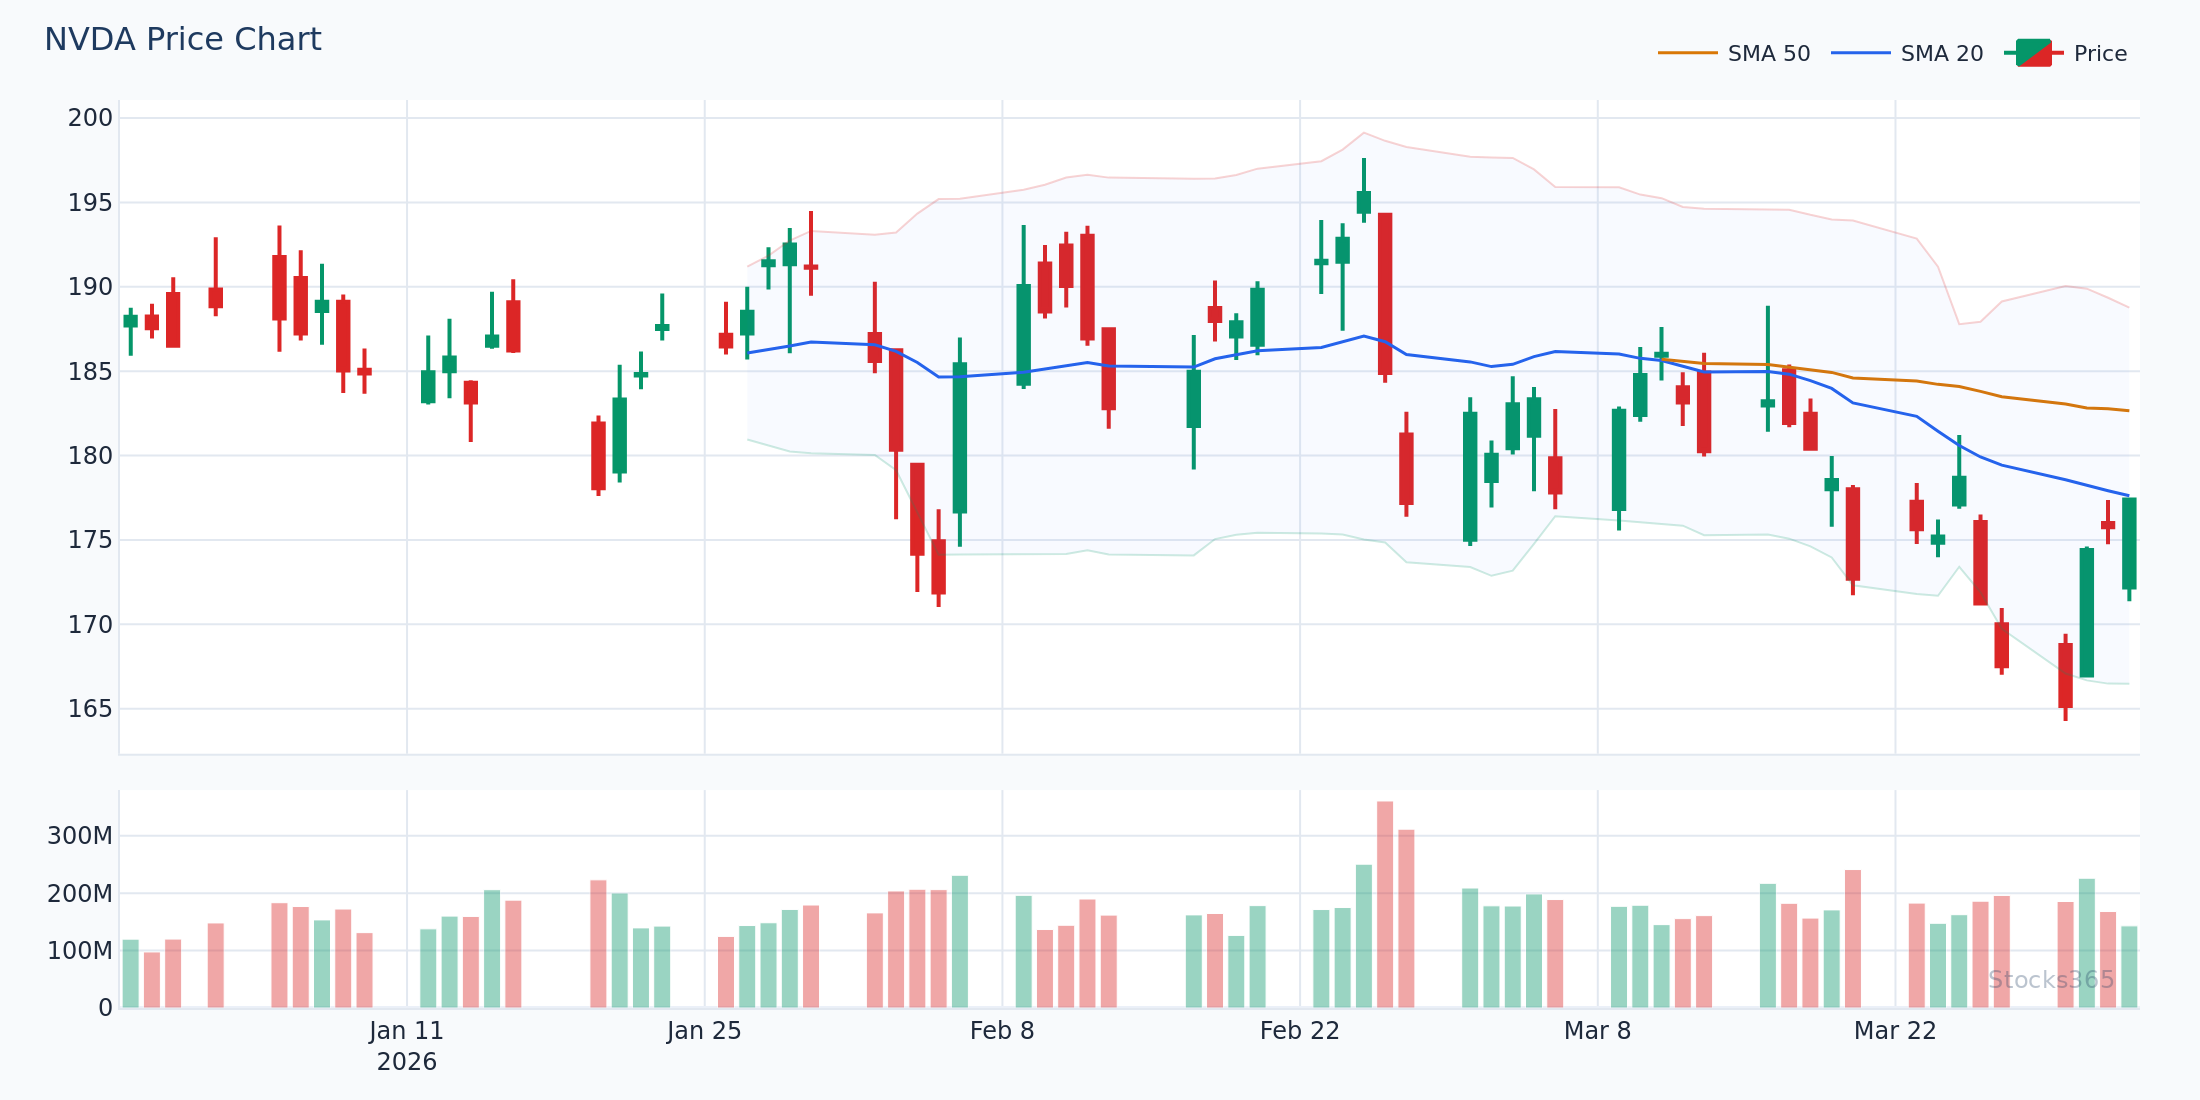
Real example: In early 2026, NVIDIA (NVDA) was consolidating around the $118 level after a pullback. The MACD line crossed above the Signal line while the histogram flipped from negative to positive. Traders who acted on this signal caught a move toward $134 over the following three weeks — a 13.5% gain.
"A bullish MACD crossover that occurs below the zero line — still in negative territory — is considered stronger than one that forms above it, because it signals a trend reversal rather than continuation."
Bearish MACD Crossover (Sell Signal)
A bearish crossover happens when the MACD line crosses below the Signal line. This signals that downward momentum is gaining strength and price may decline.
Real example: TSLA was trading near the $310 mark in Q1 2026 when its MACD line crossed below the Signal line. The histogram shifted from green to red. The subsequent drop brought TSLA down to the $278 area — traders who used the bearish crossover as a short or exit signal protected significant gains.
Step 2 — Interpreting the MACD Histogram
Most beginner traders focus only on crossovers and completely ignore the histogram — a critical mistake. The MACD histogram is where you read the strength of momentum, not just its direction.
How to Read Histogram Bars
- Growing green bars (above zero): Bullish momentum is strengthening. Price trend is likely to continue higher.
- Shrinking green bars: Bullish momentum is fading — consider tightening stop-losses or preparing for reversal.
- Growing red bars (below zero): Bearish momentum is intensifying. Price decline likely to continue.
- Shrinking red bars: Bearish momentum is weakening — a reversal or consolidation may be near.
Think of the histogram as a momentum speedometer. When bars are growing, the trend has fuel. When they start shrinking before the crossover even happens, that's your early warning system that momentum is shifting.
The Peak-and-Fade Pattern
One of the most actionable histogram readings is the peak-and-fade. When histogram bars reach their largest size and then start to shrink — even while price continues in the same direction — it signals that the move is losing steam. This often precedes a crossover by several candles, giving astute traders a head start.
Step 3 — Understanding the Zero Line
The zero line (or centerline) on the MACD is more important than most traders realize. It tells you whether the underlying trend is bullish or bearish in absolute terms.
- MACD line above zero: The 12-period EMA is above the 26-period EMA — bullish trend territory.
- MACD line below zero: The 12-period EMA is below the 26-period EMA — bearish trend territory.
Zero Line Crossovers
When the MACD line itself crosses the zero line, this is a trend confirmation signal — more lagging than Signal line crossovers, but more reliable for identifying genuine trend changes.
- MACD crosses above zero: Confirms a new bullish trend is underway.
- MACD crosses below zero: Confirms a new bearish trend has taken hold.
Professional traders often use Signal line crossovers for timing entries and zero line crossovers to confirm the trade direction. If they don't align, extra caution is warranted.
Step 4 — Reading MACD Divergence (The Most Powerful Signal)
MACD divergence occurs when price moves in one direction but the MACD indicator moves in the opposite direction. This disconnect is one of the most reliable leading signals in all of technical analysis — it suggests a reversal is approaching before it becomes obvious on price charts.
Bullish MACD Divergence
Price makes a lower low, but the MACD makes a higher low. This means that despite falling prices, momentum is actually improving beneath the surface — a classic pre-reversal warning.
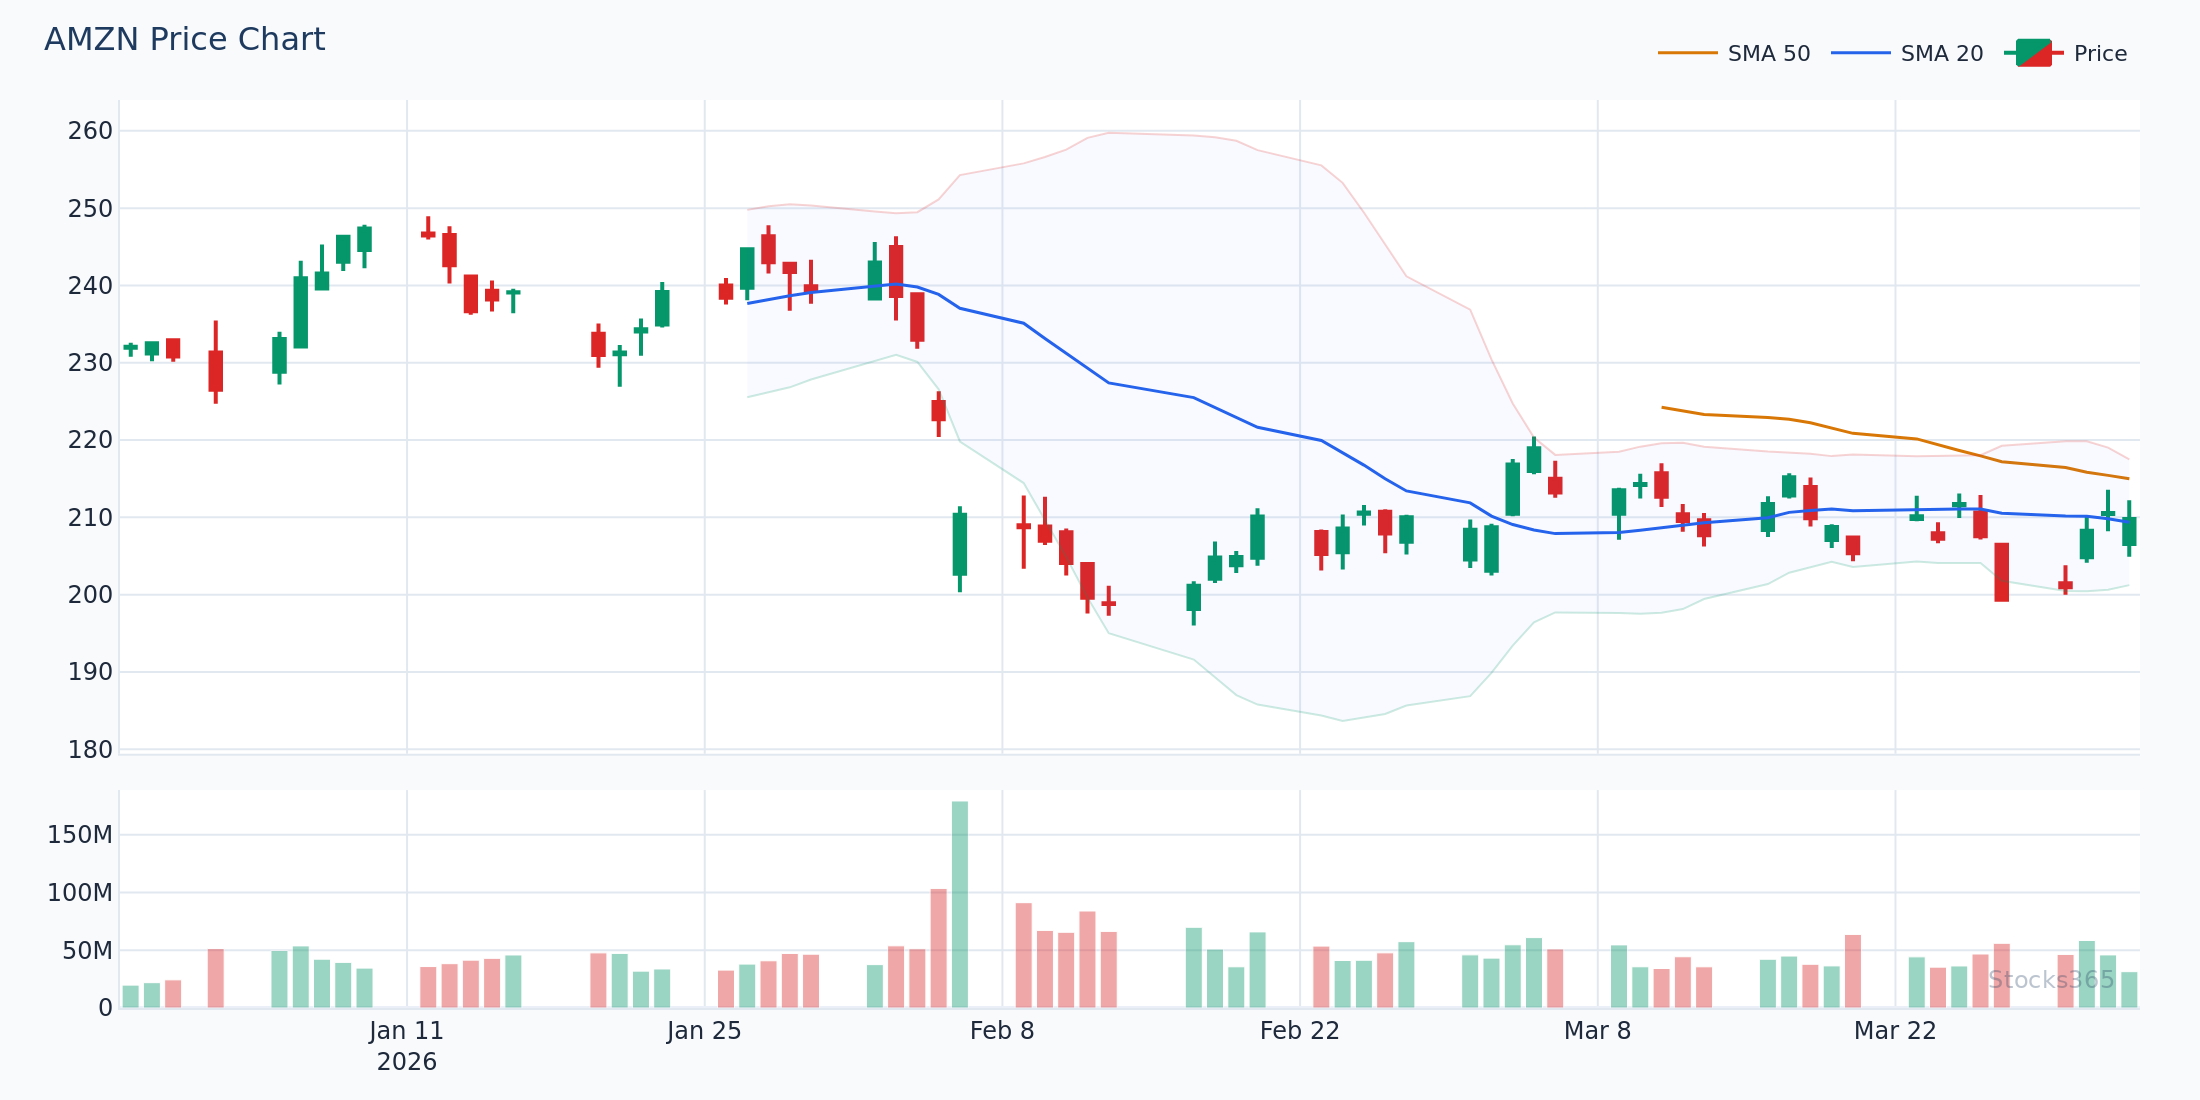
Example: In 2026, Amazon (AMZN) was retesting lows near the $185 level. Price printed a new low, but the MACD histogram was forming a clearly higher low. Traders who spotted this bullish divergence early were positioned ahead of a 17% recovery over the following six weeks.
Bearish MACD Divergence
Price makes a higher high, but MACD makes a lower high. Momentum is fading even as price climbs — often a signal of an impending sell-off.
This is essentially the same concept as RSI divergence. If you're already familiar with RSI divergence, you'll find MACD divergence intuitive — and using both indicators together for divergence confirmation is an extremely powerful strategy.
⚠️ Important: Divergence doesn't give you a precise entry point — it warns you a reversal may be coming. Always wait for a confirming crossover or candlestick pattern before entering a trade based purely on divergence.
For traders who want to go deeper on divergence-based strategies, Stocks365 also covers hidden RSI divergence — a more nuanced signal that even experienced traders often overlook.
Step 5 — Combining MACD With RSI for Higher-Probability Trades
MACD and RSI complement each other beautifully because they measure different things. MACD measures momentum and trend direction using moving averages, while RSI measures relative strength and overbought/oversold conditions using price velocity. Using them together filters out many of the false signals each produces on its own.
The MACD + RSI Confluence Strategy
- Bullish setup: MACD bullish crossover + RSI rising from oversold territory (below 30) = strong buy confirmation
- Bearish setup: MACD bearish crossover + RSI declining from overbought territory (above 70) = strong sell/short confirmation
- Neutral/avoid: MACD gives a signal but RSI is in the middle range (40-60) with no clear direction — lower conviction, consider waiting
New to RSI? Get up to speed quickly with Stocks365's complete beginner's guide to RSI, or dive into how to use RSI in trading for a step-by-step walkthrough of practical RSI strategies.
For traders who want to understand the mathematical foundations, our guide on how RSI is calculated explains the formula in plain English — which actually helps you better interpret what the indicator is telling you in real time.
Understanding RSI overbought and oversold levels is especially useful for MACD traders, since these extremes often coincide with the most reliable MACD crossover signals.
Step 6 — Avoiding Common MACD Mistakes
Even traders who understand the mechanics of MACD make these critical errors. Avoiding them will immediately improve your signal accuracy.
Mistake 1 — Trading Every Crossover in Choppy Markets
MACD crossovers are terrible in sideways, low-volatility markets. When price is chopping between a tight range, the MACD will generate constant false crossovers — known as "whipsaws." Always check the broader trend context before acting on a crossover.
Mistake 2 — Ignoring the Timeframe
A bullish MACD crossover on a 5-minute chart means something very different from one on a daily chart. Higher timeframe signals carry more weight. Many professional traders only take MACD signals that are confirmed on both the daily and weekly timeframes.
This is closely related to choosing the right settings — just as RSI settings need to match your trading style and timeframe, MACD settings should be adjusted for scalping (shorter periods) versus swing or position trading (standard or longer periods).
Mistake 3 — Using MACD as a Standalone System
No single indicator should be your entire strategy. MACD works best as one layer in a multi-indicator confluence approach. Volume, support/resistance levels, and oscillators like RSI or the Stochastic Oscillator all add valuable context.
Mistake 4 — Entering at the Crossover, Not Waiting for Confirmation
A crossover candle that hasn't closed yet can flip before the session ends. Always wait for the candle to close before confirming a MACD crossover signal — especially on lower timeframes where wicks and fakeouts are common.
How Stocks365 Uses MACD in Its Signal Engine
At Stocks365, MACD signals don't exist in a vacuum. Our signals dashboard integrates MACD crossovers, histogram momentum readings, and divergence patterns alongside RSI, volume analysis, and price action structure — all synthesized into a single, easy-to-read trust score.
The trust score tells you at a glance how many indicators are aligned for a given signal. A MACD bullish crossover with a trust score of 85+ means multiple independent signals are pointing in the same direction — a much higher-probability setup than a MACD signal in isolation.
For example, when checking a signal like AAPL's current signals, you'll see exactly how MACD, RSI, and other indicators are stacking up in real time — so you can make faster, more confident decisions without building the analysis from scratch every time.
MACD Settings: Should You Change the Default (12, 26, 9)?
The default MACD settings of 12, 26, and 9 were designed for daily charts and remain the most widely used settings across all markets. However, different strategies benefit from adjustments:
- Scalpers (1-15 min charts): Try (5, 13, 5) for faster signal generation
- Swing traders (daily charts): The default (12, 26, 9) works well for most swing setups
- Position traders (weekly charts): Consider (24, 52, 18) for smoother, longer-term trend signals
The key tradeoff: faster settings = more signals but more noise; slower settings = fewer signals but higher reliability. Always backtest any setting changes against your specific trading instruments before going live.
Quick Reference: MACD Signal Cheat Sheet
- ✅ MACD line crosses above Signal line → Bullish crossover — potential buy
- ❌ MACD line crosses below Signal line → Bearish crossover — potential sell/short
- 📈 Histogram bars growing (green) → Bullish momentum accelerating
- 📉 Histogram bars growing (red) → Bearish momentum accelerating
- ⚠️ Histogram bars shrinking → Momentum fading — watch for reversal
- 🔄 Price lower low + MACD higher low → Bullish divergence — reversal warning
- 🔄 Price higher high + MACD lower high → Bearish divergence — reversal warning
- ⬆️ MACD crosses above zero line → Trend confirmation: bullish
- ⬇️ MACD crosses below zero line → Trend confirmation: bearish
Frequently Asked Questions
What is the best MACD signal to use for beginners?
For beginners, the MACD Signal line crossover is the easiest to spot and act on. A bullish crossover (MACD line crossing above the Signal line) is a potential buy signal, while a bearish crossover (MACD line crossing below the Signal line) is a potential sell signal. Start with these on daily charts where signals are cleaner and less prone to noise than lower timeframes.
How reliable is MACD as a trading indicator?
MACD is a reliable momentum and trend indicator, but like all technical tools, it's not perfect. It tends to lag price slightly since it's built on moving averages, and it can produce false signals in choppy or sideways markets. Its reliability increases significantly when combined with complementary indicators like RSI, volume analysis, or support and resistance levels. Stocks365's trust score system helps by showing you when multiple signals align.
What's the difference between MACD divergence and a MACD crossover?
A MACD crossover is a current momentum signal — it tells you what is happening with price momentum right now. MACD divergence is a leading signal — it tells you that the current price trend and underlying momentum are out of sync, suggesting a reversal may be approaching. Divergence typically appears before a crossover and gives traders earlier warning, but it requires confirmation before acting on it.
Can I use MACD for day trading?
Yes, MACD can be used for day trading, but you'll need to adjust the settings. The default (12, 26, 9) is calibrated for daily charts. For 5-minute or 15-minute charts, shorter settings like (5, 13, 5) generate signals faster. Keep in mind that lower timeframe MACD signals are noisier and generate more false signals — always combine with volume and a higher timeframe trend bias to filter trades effectively.
How is MACD different from RSI?
MACD and RSI measure different things. MACD is a trend-following momentum indicator that tracks the relationship between two EMAs — it tells you which direction momentum is heading and how strong it is. RSI is an oscillator that measures the speed and magnitude of price changes on a scale from 0 to 100 — it tells you whether a stock is overbought or oversold. Because they measure different dimensions of price behavior, they complement each other well and are most powerful when used together. Learn more in our RSI vs Stochastic Oscillator guide.