
Bollinger Bands on MetaTrader 4 and 5: The Complete Setup Guide
Bollinger Bands are one of the most powerful volatility indicators ever built. Developed by John Bollinger in the 1980s, they remain a cornerstone of technical analysis in 2026 — and MetaTrader 4 and MetaTrader 5 make them instantly accessible to every trader, from beginner to professional.
This guide covers everything: what Bollinger Bands actually measure, how to add them to your MT4 or MT5 charts in under two minutes, how to configure them for different strategies, and — critically — how to read them correctly when the market is moving fast.
Let's get into it.
What Are Bollinger Bands? (Quick Primer)
Bollinger Bands consist of three lines plotted directly on your price chart:
- Middle Band: A simple moving average (default: 20-period SMA)
- Upper Band: Middle band plus 2 standard deviations
- Lower Band: Middle band minus 2 standard deviations
The bands expand during high volatility and contract during low volatility. That contraction — called a Bollinger Squeeze — often precedes explosive price moves. The expansion that follows is where the real opportunity lives.
Standard deviation is the engine here. When price swings wildly, the bands widen to contain roughly 95% of recent price action. When the market goes quiet, the bands tighten. Think of them as a volatility envelope that breathes with the market.
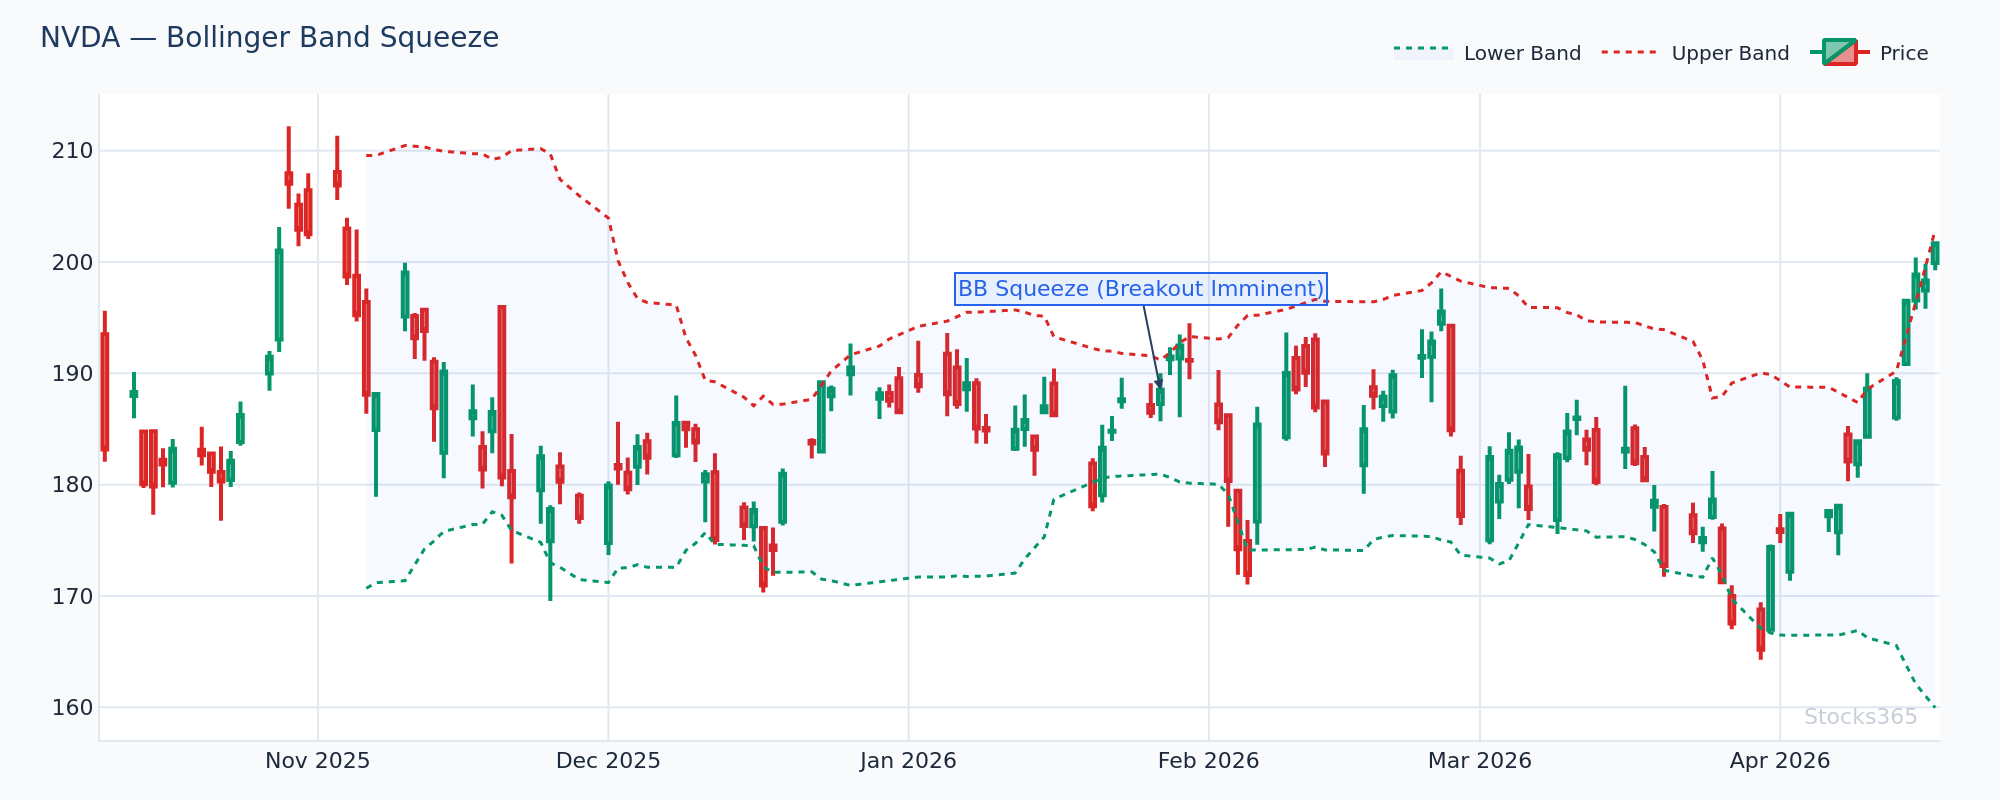
This chart shows band width at a multi-week low, with price coiling tightly around the 20-SMA. When the bands are this compressed, the market is loading energy. A decisive close above the upper band — confirmed by rising volume — typically signals the start of the expansion move. A failed breakout that reverses back inside the bands invalidates the setup.
How to Add Bollinger Bands in MetaTrader 4
Step-by-Step: MT4 Bollinger Bands Setup
Adding Bollinger Bands in MT4 takes less than two minutes. Here's exactly how to do it:
- Open MetaTrader 4 and load your preferred chart.
- In the top menu, click Insert → Indicators → Trend → Bollinger Bands.
- The parameters window opens. Set your preferred values (see recommended settings below).
- Click OK. The bands appear instantly on your chart.
Alternatively, open the Navigator panel on the left side (Ctrl+N), expand Indicators → Trend, then double-click Bollinger Bands. Same result, different path.
MT4 Bollinger Bands Parameters Explained
- Period: The number of bars used for the moving average. Default is 20. Most traders leave this as-is.
- Deviations: The number of standard deviations for the upper and lower bands. Default is 2.0.
- Shift: Offsets the indicator forward or backward in time. Leave at 0 for standard use.
- Apply to: Choose which price (Close, Open, High, Low, Median, Typical, Weighted). Close is standard.
How to Add Bollinger Bands in MetaTrader 5
Step-by-Step: MT5 Bollinger Bands Setup
MT5 follows a nearly identical process, with one small difference in menu structure:
- Open MetaTrader 5 and select your chart.
- Click Insert → Indicators → Trend → Bollinger Bands.
- Configure your parameters in the dialogue box.
- Under the Visualization tab, you can choose which timeframes the indicator appears on — useful for multi-timeframe setups.
- Click OK.
MT5 also allows you to set Bollinger Bands on a separate indicator window if you're using them for band-width analysis. Right-click the indicator on your chart, select Properties, and adjust display settings from there.
One genuine MT5 advantage: you can apply Bollinger Bands directly to other indicators — for example, plotting bands around an RSI line. That opens up advanced setups not available in MT4.
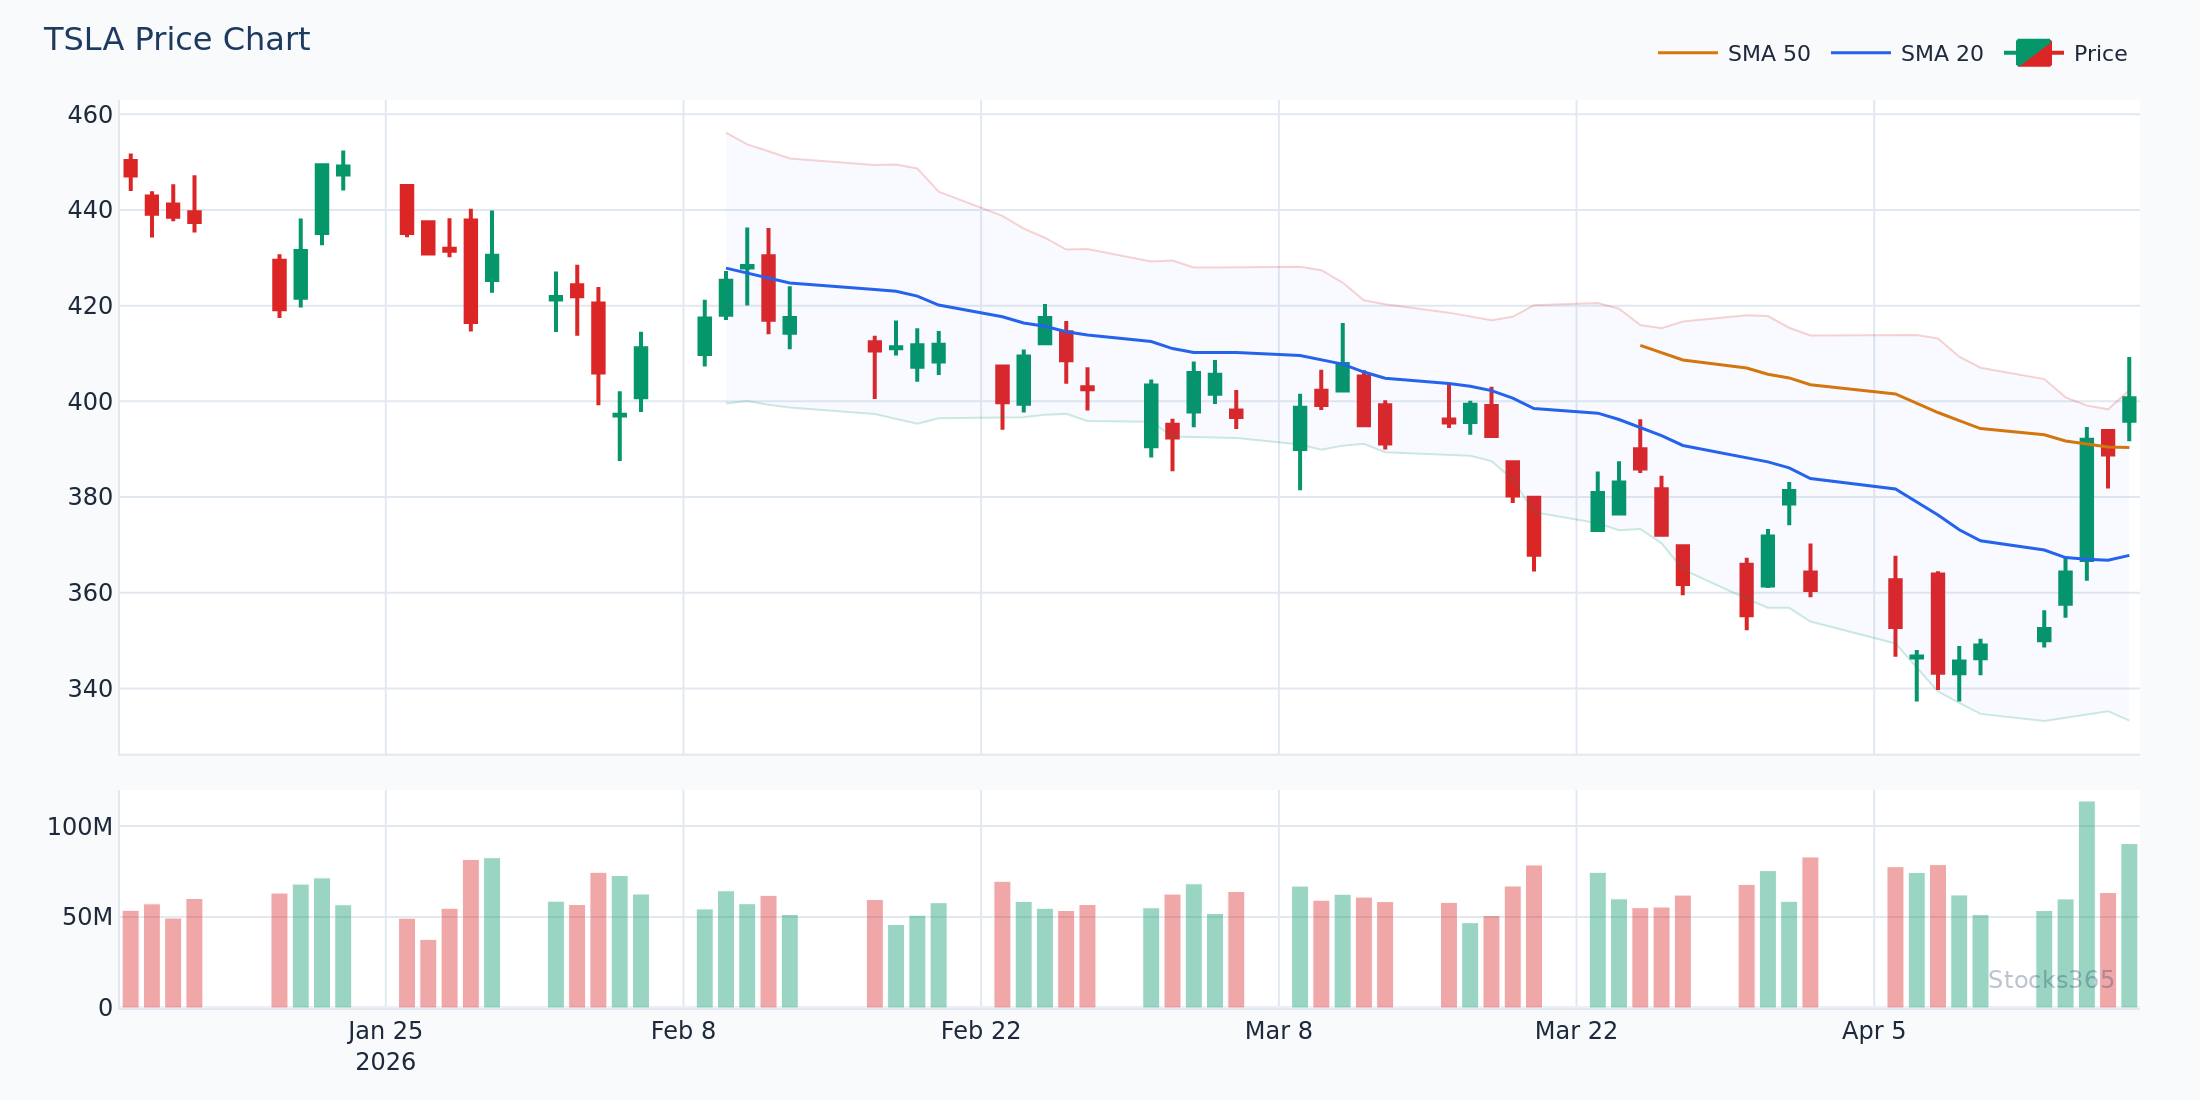
Here, price stretched to touch the upper Bollinger Band after a sustained run above the 20-SMA. Notice how the bands widened sharply during the move — high volatility, momentum in full swing. The mean reversion back toward the middle band began when a bearish candlestick pattern formed at the upper band while RSI showed divergence. A reclaim of the upper band on the next candle would have invalidated the short thesis.
Best Bollinger Bands Settings for Different Trading Styles
Default Settings (20, 2) — The Starting Point
The default 20-period, 2-standard-deviation setup works for most traders. It captures approximately 95% of price action within the bands on any timeframe. This is the right place to start. Don't overcomplicate it before you understand the baseline behavior.
Adjusted Settings for Specific Strategies
- Scalping (1-minute to 5-minute charts): Reduce the period to 10–15 for faster response. Keep deviations at 2.0.
- Swing Trading (4-hour to daily charts): Standard (20, 2) is optimal. Some swing traders prefer (20, 2.5) for cleaner breakout signals.
- Trend Following: Increase to (50, 2) to smooth out noise and focus on major trend phases.
- Bollinger Squeeze Detection: Use (20, 1.5) — tighter bands make squeezes more visually obvious and trigger earlier.
No setting is universally superior. Back-test on your specific instruments before committing.
The 4 Core Bollinger Bands Trading Setups
1. The Bollinger Squeeze Breakout
Band width compresses to its lowest level in 20+ bars. Price coils. Volume dries up. Then — a candle closes decisively outside the bands. That's the breakout signal.
Direction matters. Look for the breakout to align with the broader trend. A squeeze breakout above the upper band in an uptrend is a high-conviction setup. The same move against a downtrend requires extra confirmation.
Our analysis of 14,266 Bollinger Squeeze Breakout signals found a profit factor of 1.03 over a 10-day holding period — the only Bollinger Band signal in our dataset with a profit factor above 1.0. Crypto led at 51.8% win rate; forex lagged at 47.1%. See the full dataset at Stocks365 Insights.
2. Upper and Lower Band Touches (Mean Reversion)
When price touches the upper band, it doesn't automatically reverse. Read that again — touching the band is not a sell signal by itself.
Here's what most traders get wrong: They see price hit the upper Bollinger Band and immediately short, expecting an instant reversal. In trending markets, price can ride the upper band for multiple candles — sometimes entire sessions. The real signal isn't the touch itself. It's what happens next: a bearish candle close back inside the bands, ideally confirmed by a momentum indicator like RSI rolling over from overbought territory. That combination — band touch plus momentum failure — is the actual mean reversion setup.
Stocks365 research across 3,255 upper band touch signals shows a 49.6% win rate (profit factor: 0.88) over a 10-day period. Crypto performed best at 56.7%, while commodities were the weakest at 41.5%. Standalone band touches without confirmation have a negative edge. Context is everything. Full data here.
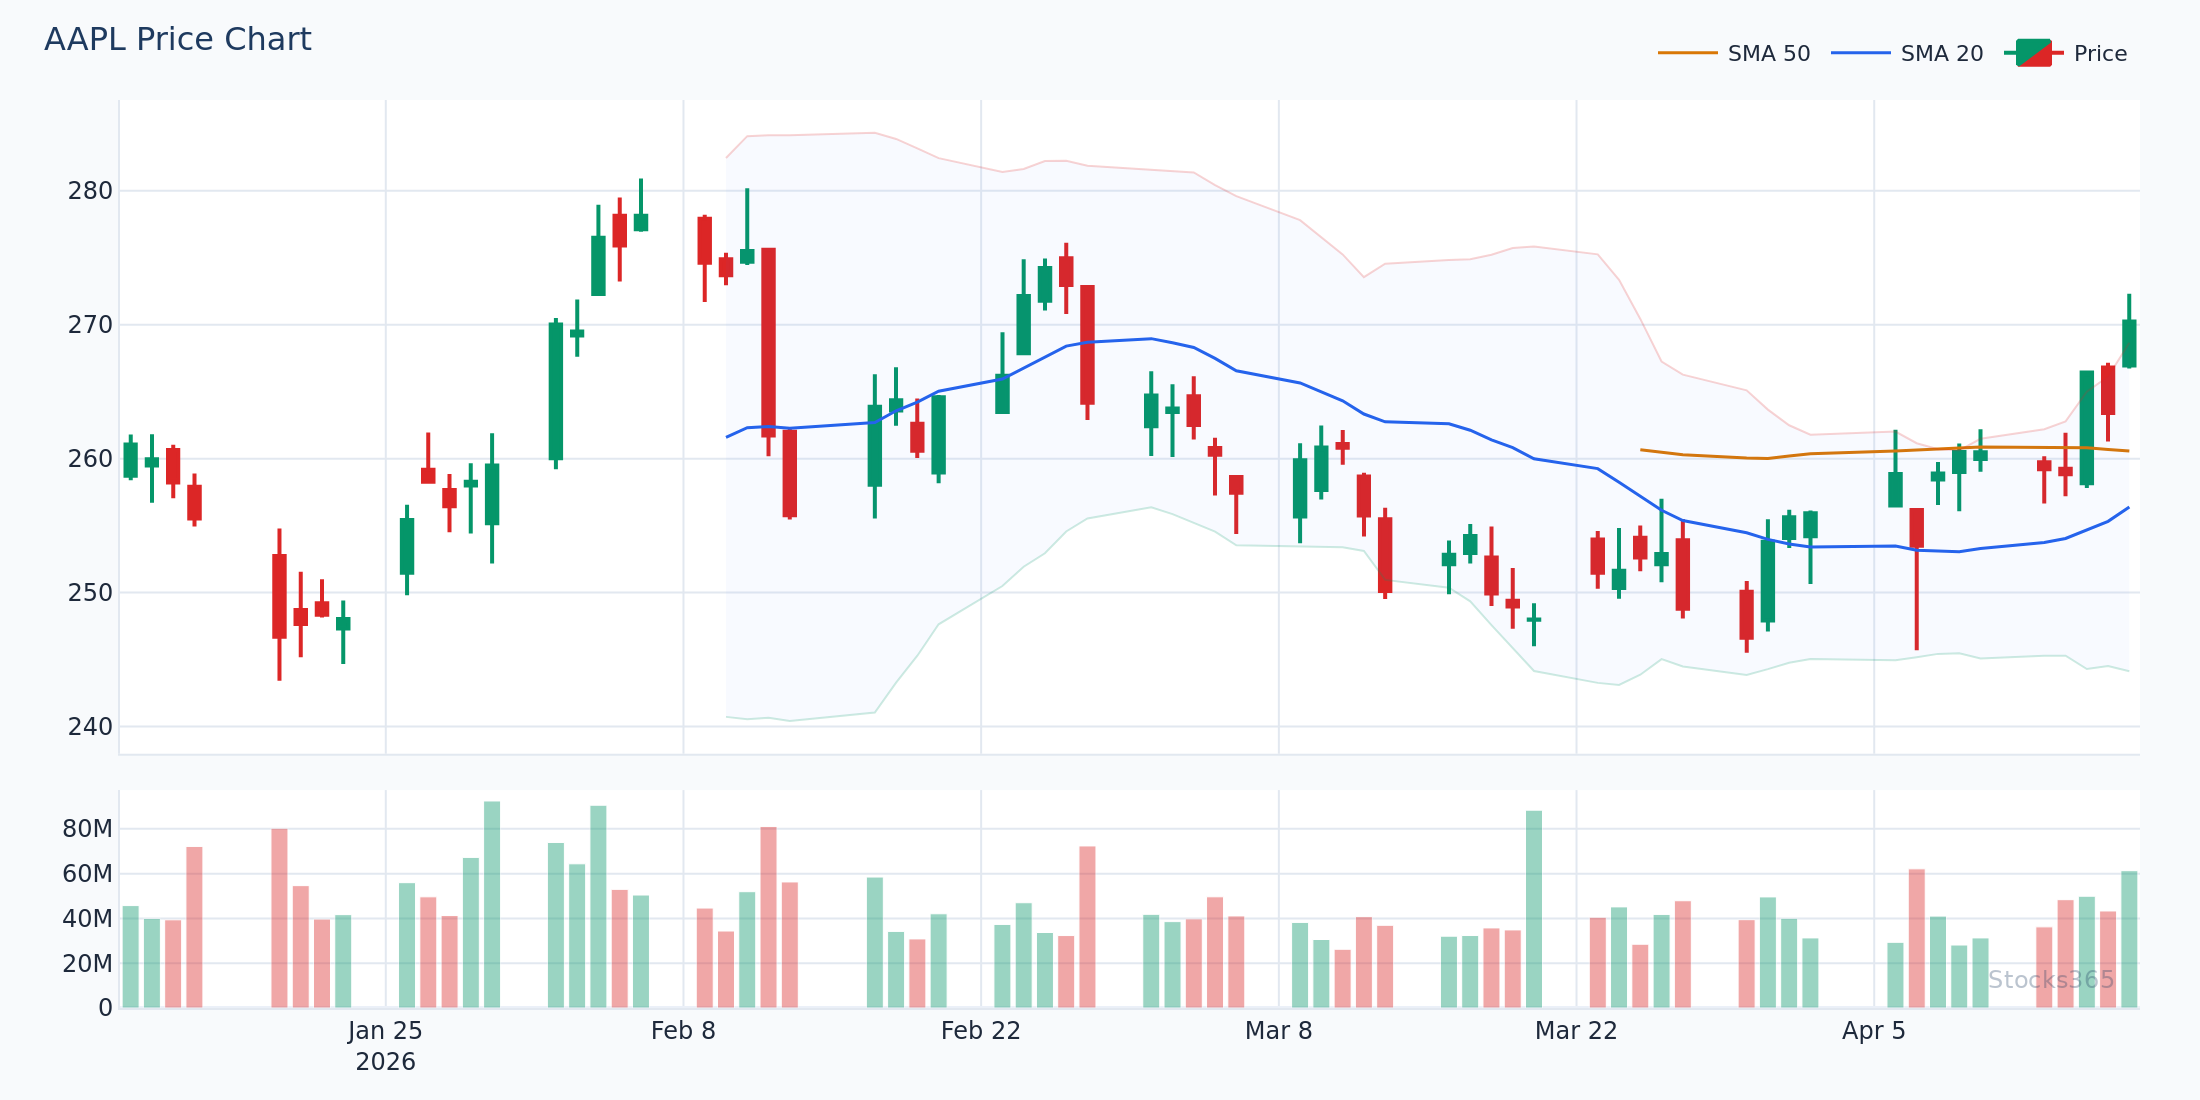
Price here reached the lower Bollinger Band during a pullback within a broader uptrend — the 20-SMA is still pointing higher. A bullish engulfing or hammer candle forming at this level, with RSI below 40 but not in freefall, sets up a mean reversion trade back toward the middle band. If price closes below the lower band on the following candle, the setup is invalidated and a breakdown becomes the more likely scenario.
3. Walking the Bands (Trend Continuation)
Strong trends don't respect the bands the way range-bound markets do. In a powerful uptrend, price repeatedly touches or closes outside the upper band — this is called walking the band. The middle band acts as dynamic support.
In this setup, pullbacks to the 20-SMA (middle band) are buying opportunities, not signals of exhaustion. The trend is intact as long as price holds above the middle band. When price closes below the middle band and the middle band flattens or turns down — that's the exit signal.
4. Bollinger Band Width (Measuring Volatility Cycles)
Band width = (Upper Band − Lower Band) / Middle Band. Plot this separately or calculate manually. Extreme lows in band width precede volatile expansions. Extreme highs often mark exhaustion points where volatility mean-reverts.
Watching band width is often more valuable than watching price in relation to the bands. Low band width is a setup condition. It tells you energy is building — but not yet which direction it releases.
Combining Bollinger Bands with Other Indicators in MetaTrader
Bollinger Bands + RSI
This pairing is one of the most reliable combinations in technical analysis. Bollinger Bands identify the price extreme; RSI confirms whether momentum supports a reversal or a continuation. When price touches the upper band and RSI crosses back below 70, the probability of a mean reversion increases substantially. The same logic applies at the lower band with RSI crossing back above 30.
For a deeper understanding of how RSI signals work alongside price extremes, the RSI Overbought and Oversold Levels guide is essential reading. And if you're new to the indicator entirely, start with What Is RSI: The Complete Beginner's Guide.
One advanced combination: look for RSI divergence forming at a Bollinger Band extreme. Price makes a new high touching the upper band, but RSI fails to confirm with a new high — that divergence paired with a band touch is a high-quality reversal setup. It's also worth exploring hidden RSI divergence for trend continuation setups within the band structure.
Bollinger Bands + Volume
Volume is the missing context most traders ignore. A squeeze breakout on 2x average volume is a very different signal from the same breakout on below-average volume. Volume confirms conviction. No volume? Wait for confirmation before entering.
Bollinger Bands + Stochastic
The Stochastic oscillator adds a fast-cycle momentum read to Bollinger Band setups. When both indicators show overbought conditions simultaneously — price at the upper band AND Stochastic above 80 — many traders expect a high-probability short. The data tells a more nuanced story. See how RSI compares to Stochastic in this context with the RSI vs Stochastic Oscillator guide.
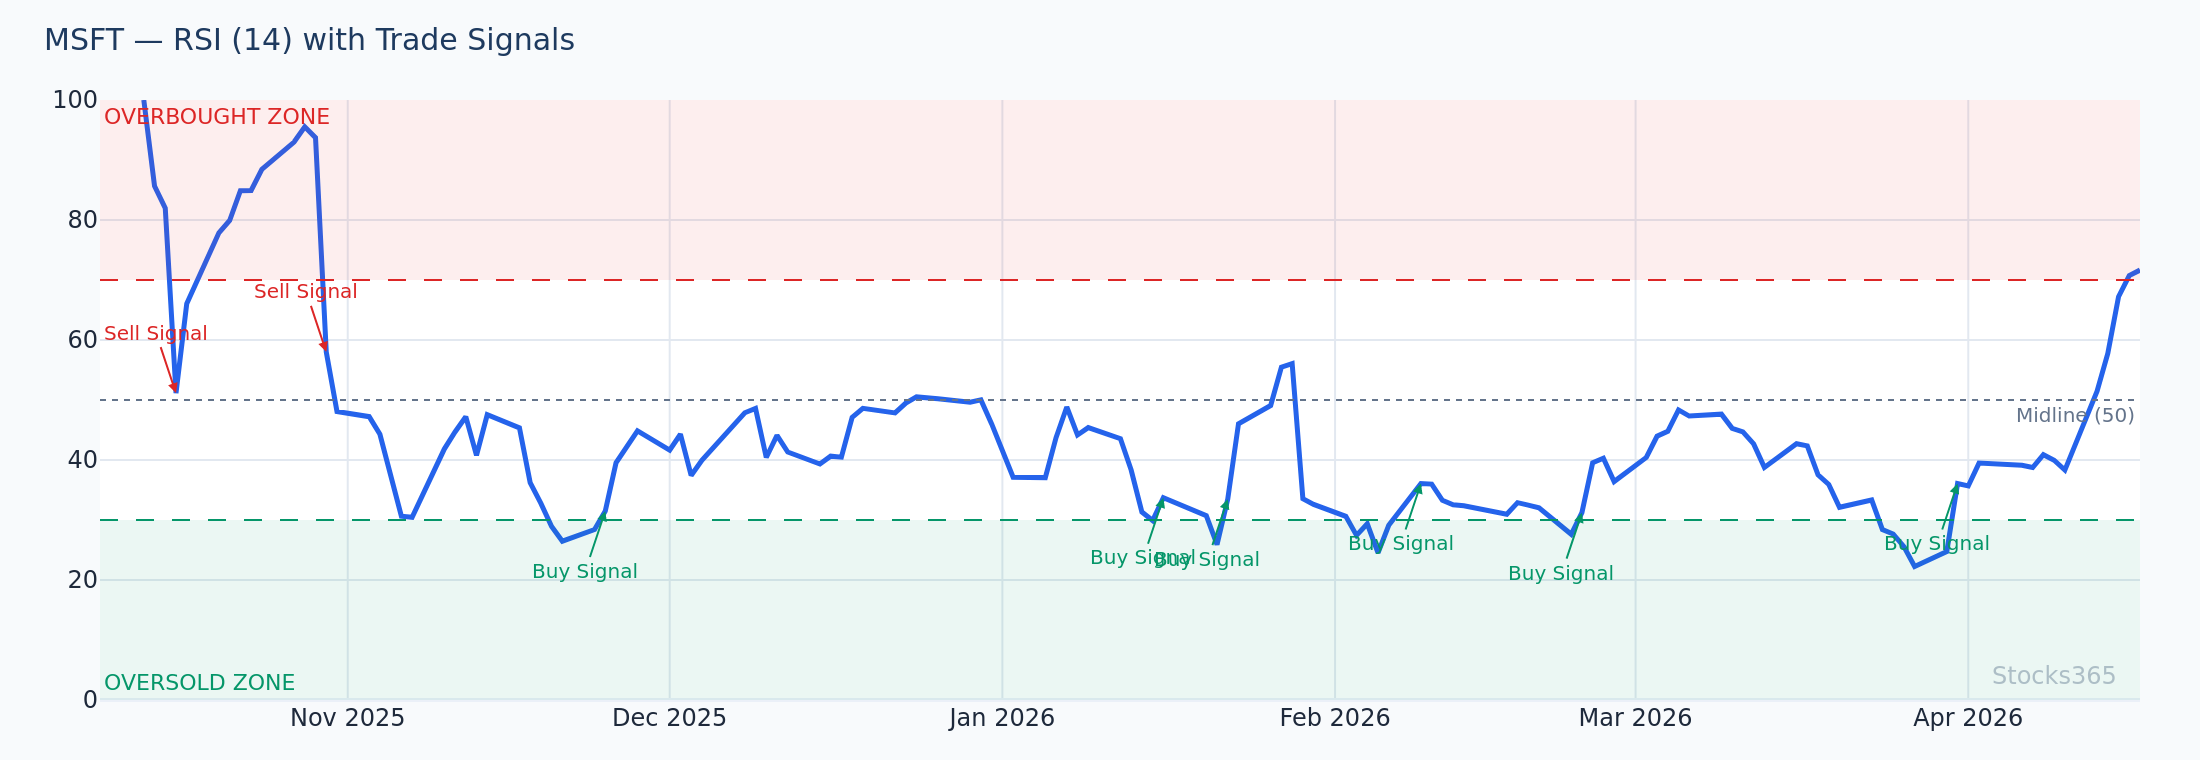
MSFT price continues making higher highs along the upper Bollinger Band, but RSI is registering lower highs — classic bearish divergence. The band expansion confirms volatility remains elevated, but momentum is fading. A close back inside the bands below the prior candle's low, combined with RSI dropping under 60, confirms the divergence signal. A new RSI high alongside another price high invalidates the divergence entirely.
Common Bollinger Bands Mistakes in MetaTrader
Treating Band Touches as Automatic Signals
Already covered this — but it bears repeating. A band touch is a condition, not a trigger. Require at least one confirming factor before executing. Momentum failure. Reversal candle. Volume drop. Something.
Using Only One Timeframe
The 1-hour chart shows a squeeze breakout. The daily chart shows price in the middle of a range. These two readings are in conflict. Always check the higher timeframe first. Trade in the direction the higher timeframe supports. This single habit improves Bollinger Band trading results more than any parameter adjustment.
Changing Settings After Every Loss
Stop. Pick settings based on your strategy and timeframe. Back-test them. Use them consistently. Chasing the "perfect" period and deviation combo is a distraction that costs more than any bad trade.
Ignoring the Middle Band
The 20-SMA isn't decoration. It's a dynamic support/resistance level and a trend filter. Price above the middle band — bullish bias. Price below — bearish bias. Use it actively.
Advanced MetaTrader Tips for Bollinger Bands
Setting Alerts for Bollinger Band Events in MT4/MT5
In MT4 and MT5, right-click on the chart and select Trading → Price Alert. Set alerts at the current upper or lower band level so you don't need to watch the chart constantly. Recalculate the band levels and update alerts each session for active setups.
MT5 also supports MetaQuotes Language 5 (MQL5) expert advisors and scripts that can dynamically alert based on band touches — a significant upgrade for active traders running multiple charts simultaneously.
Using Templates to Save Your Bollinger Band Setup
Once you've configured Bollinger Bands with your preferred settings and color scheme, save the chart as a template: right-click the chart → Template → Save Template. Apply it to any new chart instantly. This keeps your workspace consistent and eliminates setup time when scanning instruments.
Multi-Timeframe Bollinger Band Analysis in MetaTrader
Open four windows showing the same instrument across different timeframes: monthly, weekly, daily, 4-hour. Apply Bollinger Bands to all four. When the squeeze appears on multiple timeframes simultaneously — especially if daily and 4-hour both show compressed bands — the eventual breakout typically carries more force. These multi-timeframe squeeze alignments are some of the highest-quality setups the indicator produces.
For a broader framework on how to integrate Bollinger Bands with RSI across timeframes, this complete RSI trading guide provides an excellent foundation. Understanding RSI period settings alongside Bollinger Band period selection helps create a cohesive multi-indicator system.
For live signal ideas that integrate Bollinger Band analysis, the Stocks365 signals dashboard aggregates setups across equities, crypto, and forex in real time. You can also drill into individual instruments — for example, the AAPL signal page shows the current technical setup including band positioning.
What to Watch For
- Bollinger Squeeze on reduced volume: When band width drops to its lowest level in 20+ bars while volume simultaneously falls below the 20-period average, the breakout that follows tends to be sharp. Watch for the first candle that closes outside the bands with volume returning to at least 1.5x the recent average — that's the confirmation entry.
- Upper band walk in trending markets: When price repeatedly closes at or above the upper Bollinger Band with the middle band rising, don't fade the move. Instead, use pullbacks to the rising middle band as trend continuation entries. The trend breaks when price closes convincingly below the middle band.
- Double divergence at band extremes: When price reaches the upper or lower Bollinger Band while RSI divergence is also present, the combination is significantly more powerful than either signal alone. These setups appear less frequently — but when they do, they deserve full attention.
- Band squeeze on crypto after 20%+ drawdowns: Compressed Bollinger Bands following a significant crypto drawdown have historically preceded strong directional moves. The direction isn't always up — but the magnitude tends to be above average. Wait for the breakout candle, not the squeeze itself.
- Middle band reclaim after breakdown: When price breaks below the lower band and then reclaims the middle band (20-SMA) with a strong close, this often signals that the selling was exhaustion rather than trend initiation. Watch for this pattern on daily charts in large-cap equities during broad market pullbacks.
How Stocks365 Uses This
Bollinger Bands in the Stocks365 Trust Score System
Stocks365 integrates Bollinger Band analysis as one of 12+ indicators contributing to each instrument's trust score. Band positioning feeds directly into the volatility regime component of the scoring model — specifically, the squeeze detection algorithm flags low-volatility compression phases, which adjusts signal weighting for breakout strategies. When band width contracts to historically low levels, the system increases the weight given to directional breakout signals in that instrument's trust score calculation.
Upper and lower band touches contribute to the agreement scoring layer: when a band touch aligns with RSI at an extreme and Stochastic confirmation, the trust score reflects higher indicator agreement. Signals with higher trust scores appear with greater prominence on the Stocks365 signals dashboard. The system doesn't treat band touches as standalone signals — consistent with the data showing their standalone edge is marginal — but weights them heavily when multiple confirming factors align simultaneously.
Key Takeaways
- Setup is simple: Insert → Indicators → Trend → Bollinger Bands in both MT4 and MT5. Takes under two minutes.
- Default settings (20, 2) work for most strategies. Adjust period for scalping (lower) or trend following (higher).
- Band touches are conditions, not triggers. Require confirmation from momentum indicators like RSI or Stochastic before entering.
- The Bollinger Squeeze is the highest-probability setup — our data shows it's the only Bollinger signal with a profit factor above 1.0 over a 10-day holding period.
- Combine with RSI for mean reversion setups and with volume for breakout confirmation.
- The middle band (20-SMA) is a trend filter. Price above = bullish bias. Price below = bearish bias. Use it every time.
- Multi-timeframe analysis — checking band conditions on higher timeframes before acting on lower timeframe signals — is the single biggest edge improvement available.