
Bollinger Bands Options Trading: How to Profit from Volatility
Volatility is the lifeblood of options trading. Without it, premiums collapse and directional bets become expensive guesses. Bollinger Bands cut through the noise and show you exactly when volatility is contracting, when it's expanding, and — critically — when options pricing is about to shift dramatically.
This guide covers the specific setups, strategies, and confirmation signals that make Bollinger Bands one of the most powerful tools in an options trader's toolkit.
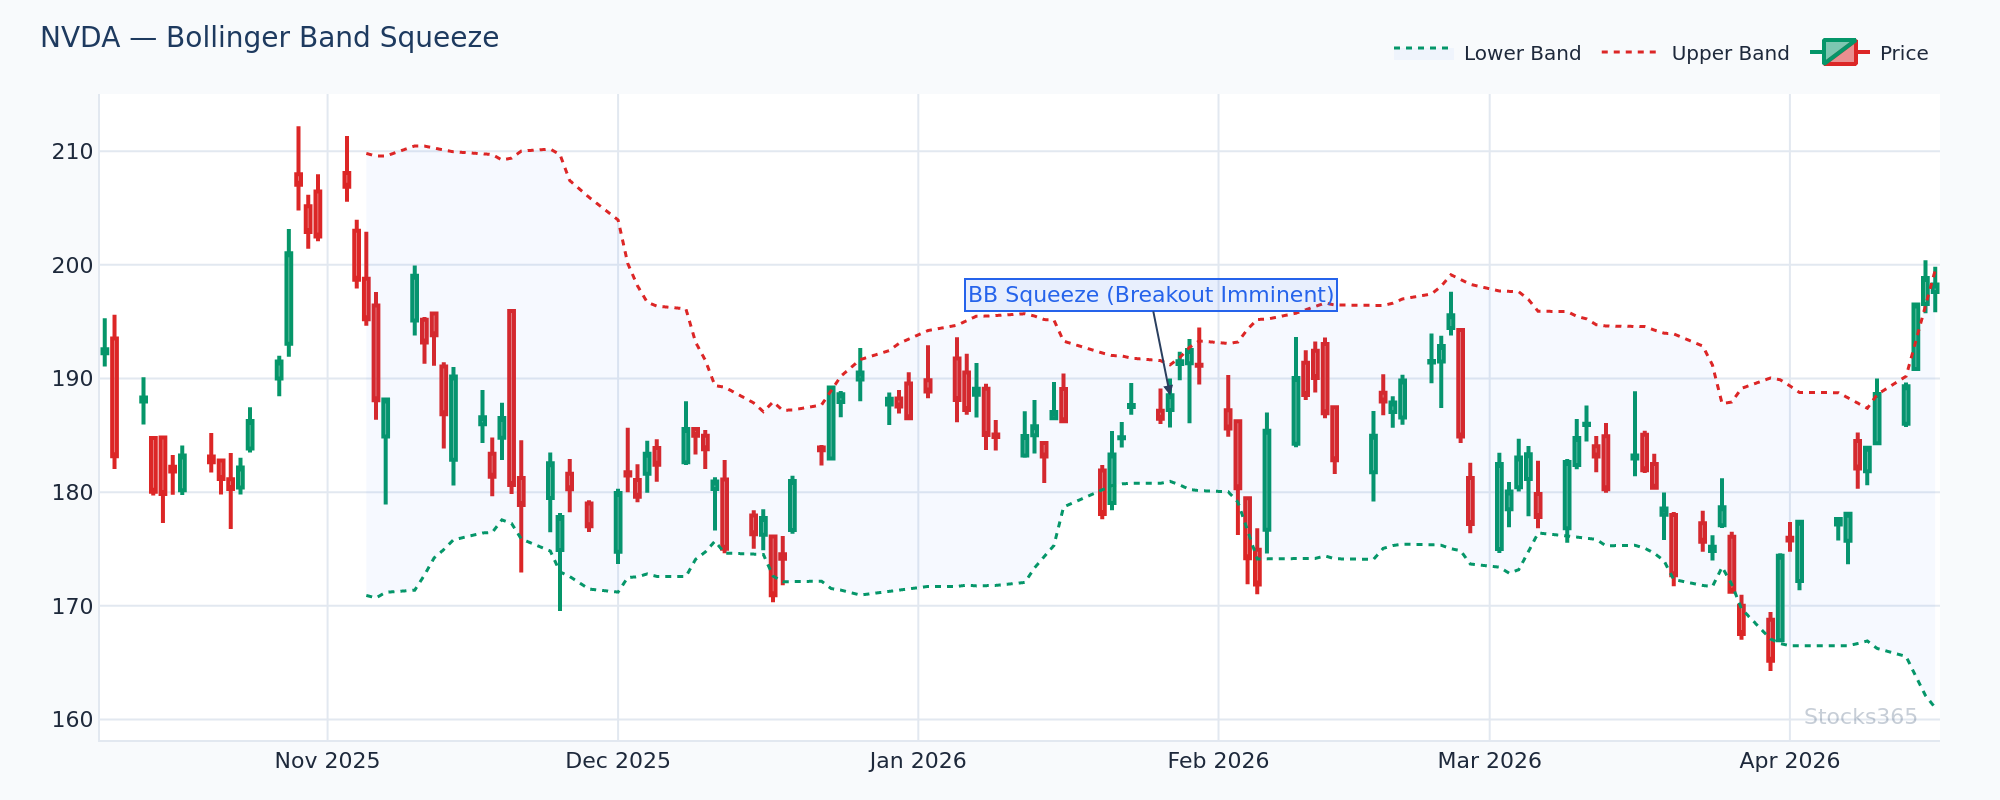
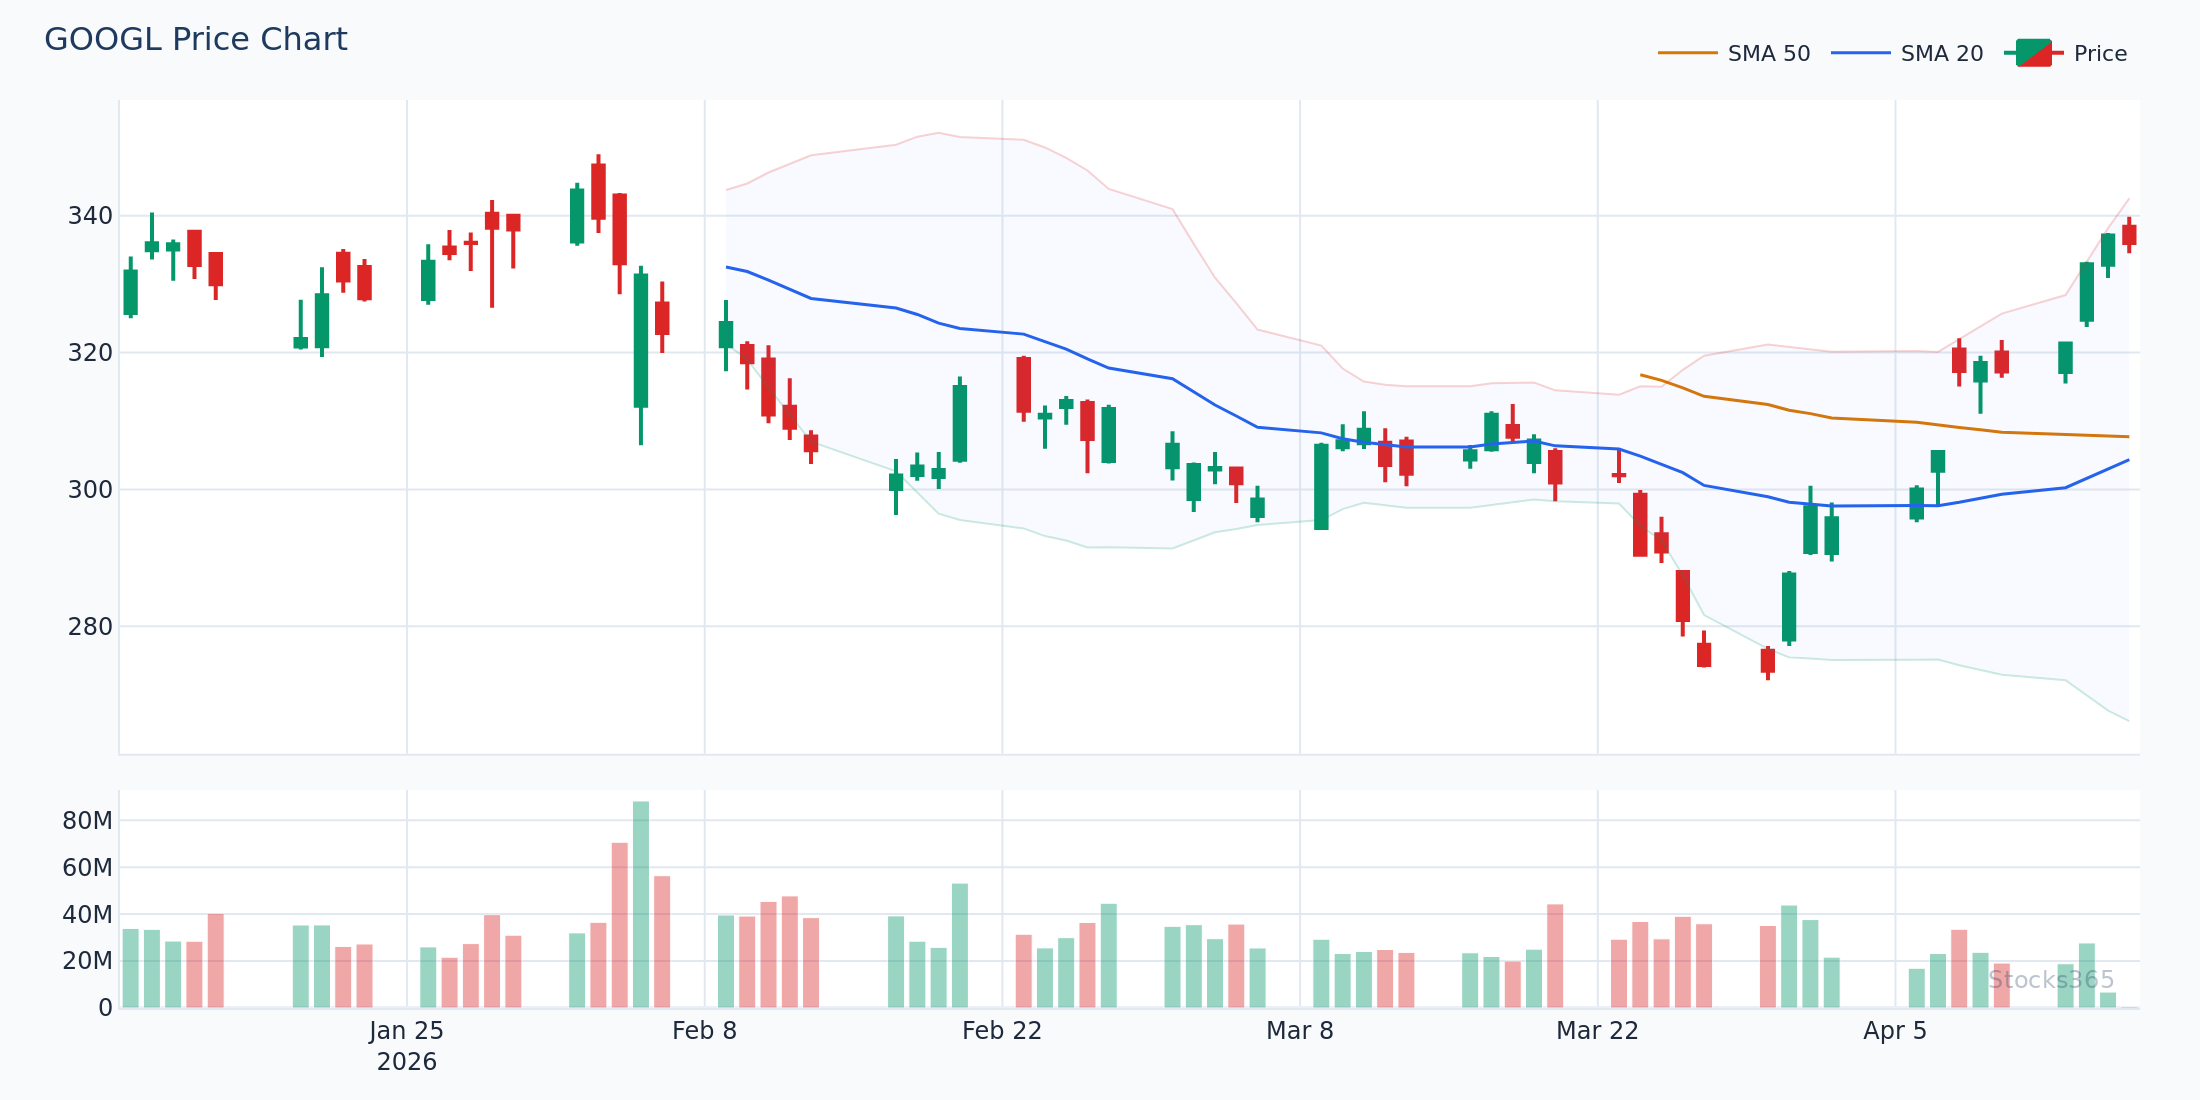
This chart shows band width compressing to a multi-month low, signaling low realized volatility. When the squeeze resolves, the initial breakout candle confirms direction. A failed breakout — where price re-enters the bands within 2-3 sessions — invalidates the setup and often triggers a reversal in the opposite direction.
What Are Bollinger Bands? (A Quick Foundation)
John Bollinger developed Bollinger Bands in the 1980s, but the concept is timeless: a 20-period simple moving average flanked by two bands set at ±2 standard deviations from that average. The bands expand when price action is volatile and contract when it's calm.
Three components. One powerful signal system.
- Middle Band: 20-period SMA — the baseline trend anchor
- Upper Band: +2 standard deviations — statistical resistance in ranging markets
- Lower Band: -2 standard deviations — statistical support in ranging markets
For options traders, the most critical insight is this: Bollinger Bands are a direct visual representation of historical volatility. When bands are wide, realized volatility is high. When they're narrow, it's compressed. That compression-expansion cycle maps almost perfectly onto how implied volatility (IV) behaves — which is what options pricing is built on.
Why Bollinger Bands Work Differently for Options vs. Equity Traders
Equity traders use Bollinger Bands to time entries and exits. Options traders use them to time volatility exposure — and that's a fundamentally different game.
Here's what most traders get wrong: they trade band touches like stock traders, buying when price hits the lower band and selling when it hits the upper band — then wonder why their options lose money even when they're directionally correct. The problem isn't direction. It's timing relative to IV expansion and contraction. If you buy a call option right as price touches the upper band during a volatility expansion, you're buying premium at its most expensive moment. Even a continued move higher can result in a loss as IV collapses after the move — a phenomenon known as volatility crush.
The edge in Bollinger Bands options trading comes from understanding when to buy premium versus when to sell it.
The Four Core Bollinger Bands Options Strategies
1. The Squeeze Breakout — Buy Premium Before the Explosion
The Bollinger Squeeze is the single most powerful setup for options buyers. It occurs when band width compresses to a multi-month or multi-year low, indicating that realized volatility has collapsed. This compression almost always precedes a significant expansion.
The logic is mechanical: low volatility leads to underpriced options (low IV), which means you're buying premium cheap — right before the market moves and IV explodes higher. That's a double profit driver: the directional move and the IV expansion both work in your favor.
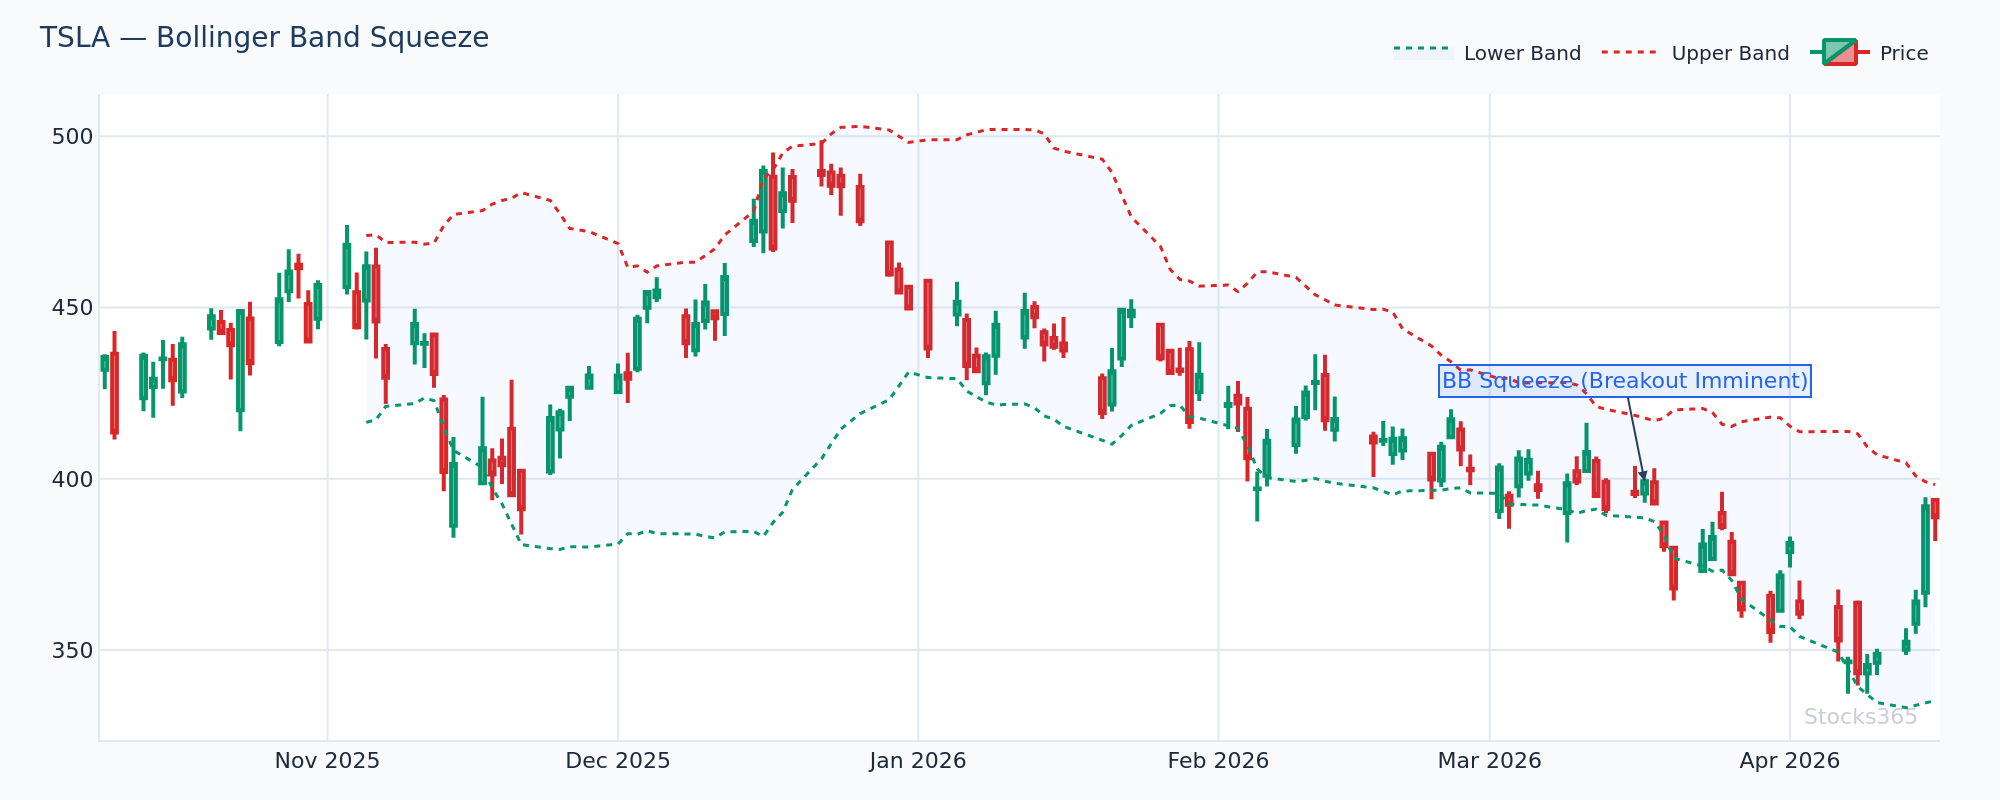
In this setup, band width has compressed to its lowest reading in six months, with price coiling inside a tight range. The breakout candle closes decisively above the upper band on elevated volume — confirming direction. If volume fails to confirm the breakout or price closes back inside the bands within two sessions, the setup is invalidated and a fade play becomes valid.
Options play: Buy ATM (at-the-money) calls or puts depending on directional bias, or buy a straddle if direction is unclear. Target exits before the next earnings event or within 10-15 days, as IV will begin contracting after the initial expansion.
Confirmation signals to stack with the squeeze:
- Volume surges 1.5x–2x the 20-day average on the breakout candle
- Price breaks and closes above the upper band (bullish) or below the lower band (bearish)
- RSI breaks above 55 (bullish breakout) or below 45 (bearish breakout) — a momentum confirmation that avoids false squeezes
- Bandwidth (BW) indicator rising from a sub-10th percentile reading
Our analysis of 14,266 Bollinger Squeeze Breakout signals found a profit factor of 1.03 over a 10-day holding period — the only Bollinger Band signal in our dataset that shows positive expectancy. Crypto led all asset classes at a 51.8% win rate, while forex lagged at 47.1%. See the full breakdown at Stocks365 Insights.
2. The Band Ride — Sell Premium Against Exhaustion
When a strong trend is in place, price will literally ride the upper or lower Bollinger Band for extended periods. This isn't a reversal signal — it's confirmation of momentum. But it is a prime setup for premium sellers who want to fade eventual exhaustion.
The setup: price has closed outside the bands for 3+ consecutive sessions, RSI is stretched above 75 or below 25, and volume on the most recent sessions is declining. This pattern suggests the trend is losing fuel.
Options play: Sell out-of-the-money call spreads (bear call spread) when price is riding the upper band, or sell OTM put spreads (bull put spread) when riding the lower band. Defined-risk structures are essential here — you're fading momentum, which can continue further than expected.
3. Mean Reversion Play — Fade the Band Touch with Confirmation
In ranging, non-trending markets, price touching the upper or lower Bollinger Band represents a statistically significant deviation from the mean. The 2-standard-deviation bands contain approximately 95% of all price action by design. A touch is a signal. But a touch alone is not enough.
Stocks365 research across 3,255 upper band touch signals found a win rate of just 49.6% with a profit factor of 0.88 — below breakeven on its own. Crypto performed best at 56.7%, while commodities showed the worst results at 41.5%. The data is clear: band touches without confirmation filters are a losing strategy.
This chart captures a textbook mean reversion setup: price touches the upper band while forming a bearish engulfing candle, and RSI simultaneously shows a lower high — a classic bearish divergence. The middle band (20-SMA) acts as the first target for the reversion. Invalidation occurs if price closes above the upper band on the following session.
Confirmation filters that transform band touches into high-probability setups:
- RSI divergence: Price makes a higher high at the band, but RSI makes a lower high — bearish divergence confirms exhaustion. Learn more about this signal in our guide to RSI Divergence: Bullish & Bearish Signals.
- Reversal candle pattern: A bearish engulfing, shooting star, or doji at the upper band adds candlestick confirmation
- Volume contraction: Volume declining on the band touch signals weakening conviction
- Stochastic crossover: Stochastic dropping below 80 from overbought territory confirms the reversal
Options play: Buy ATM puts (upper band fade) or ATM calls (lower band fade) when 2-3 confirmations align. Target the middle band as the first exit — that's typically a 1.5x–2x return on a weekly option, depending on strike and days to expiration.
4. The Double Band Squeeze with Oscillator Confirmation
This is the advanced version of the squeeze play, and it's the setup professional volatility traders hunt. It combines the Bollinger Squeeze with an oscillator reaching extreme readings — a rare alignment that signals both directional conviction and volatility potential.
When the Bollinger Bands compress and the Stochastic Oscillator simultaneously reaches overbought or oversold extremes within that compressed range, the eventual breakout tends to be sharper and more sustained.
For traders who want to combine oscillator signals with Bollinger Bands, our RSI vs Stochastic Oscillator guide explains exactly when each oscillator adds the most value — and it's not always the one you'd expect.
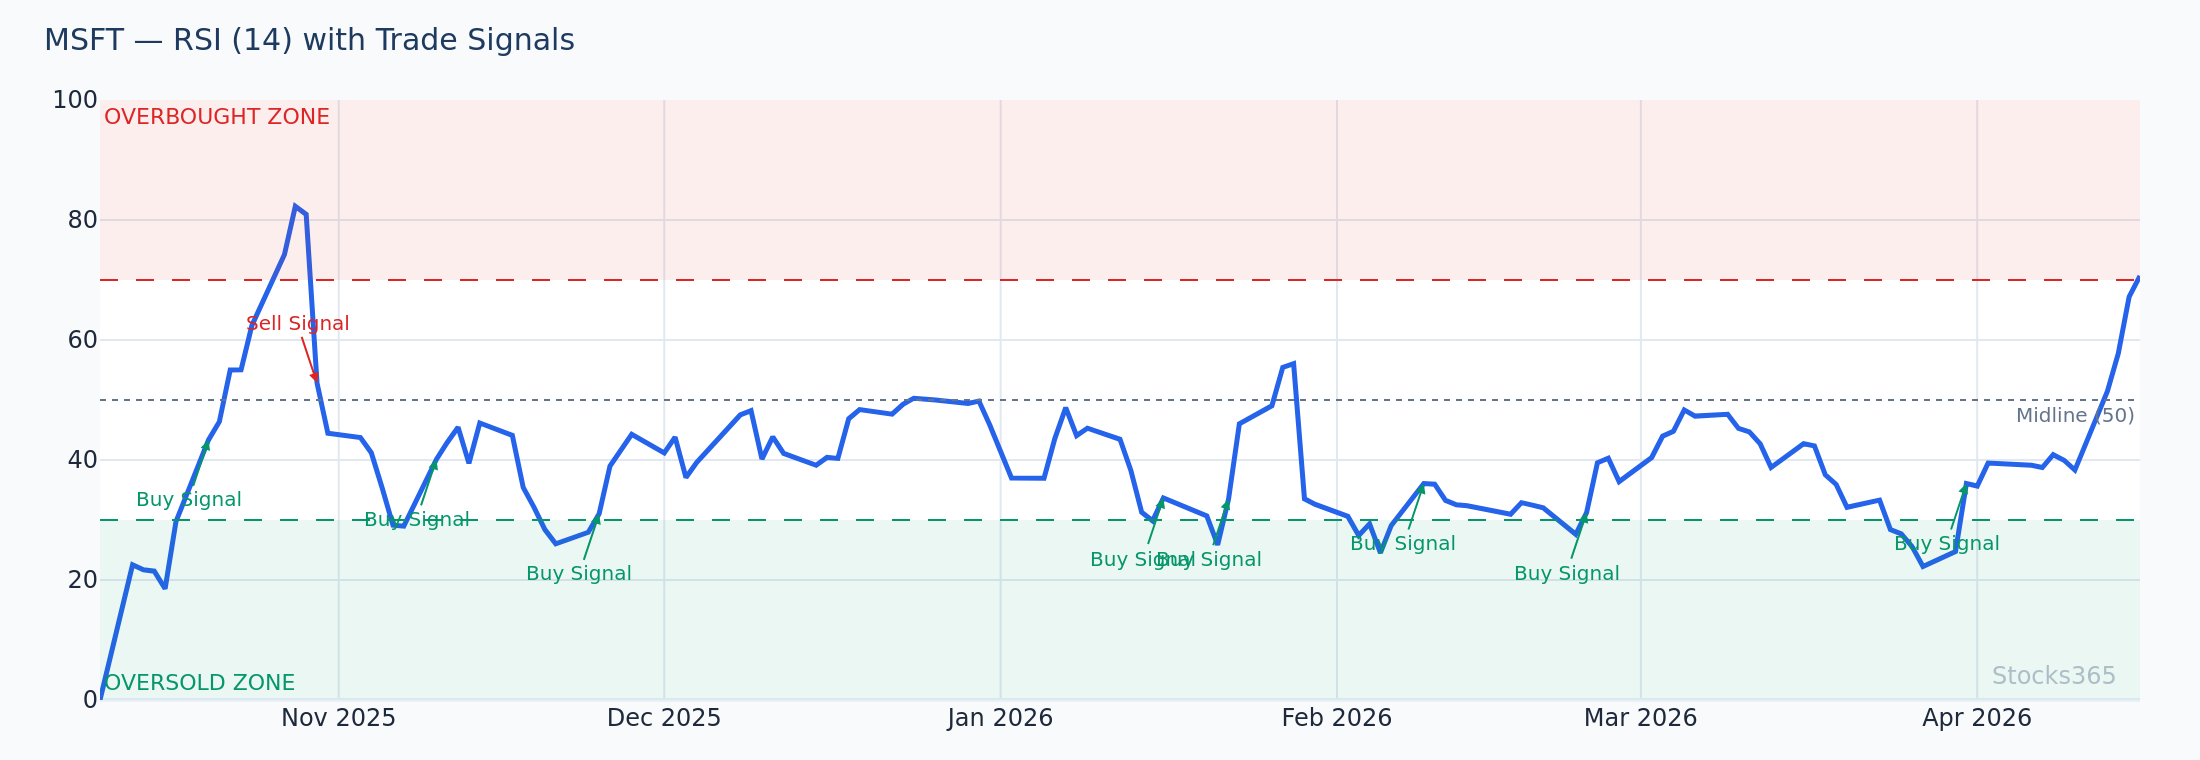
This chart shows RSI compressed between 45 and 55 while Bollinger Band width sits in the bottom 15th percentile — a dual compression signal. When RSI breaks decisively above 60 in tandem with a band expansion, the move typically extends for 5-10 trading sessions. A RSI failure back below 50 within two sessions of the breakout is the primary invalidation signal.
Implied Volatility vs. Historical Volatility: The Options Layer
Bollinger Bands measure historical (realized) volatility. Options are priced on implied volatility. These two aren't the same — but they're correlated, and that correlation is your edge.
When Bollinger Band width is at multi-month lows, implied volatility is typically also compressed. This creates a window where options are cheap relative to their historical norms. This is the ideal environment to be a premium buyer — straddles, strangles, or long calls and puts on the expected breakout direction.
Conversely, when bands are wide and IV is elevated, options are expensive. This is the environment to sell premium — iron condors, covered calls, or credit spreads. Wide bands eventually mean-revert. So does elevated IV. Both forces work in the premium seller's favor.
The regime matters more than the signal.
What to Watch For
- Bollinger Squeeze on tech stocks: When band width drops below the 20th percentile on daily charts, the subsequent expansion typically produces a 2–3 ATR move. Long straddles entered during sub-10th percentile squeeze conditions historically offer the best risk/reward for premium buyers.
- Upper band touches with RSI divergence on large-cap equities: When price makes a new high at the upper band but RSI prints a lower high, the mean-reversion probability increases significantly — especially when this occurs after a 15%+ run without a meaningful pullback. Check for this pattern on the Stocks365 signals dashboard.
- Band expansion post-earnings on mega-cap tech: When bands expand sharply following an earnings reaction, IV crush follows within 3-5 sessions. This is the worst time to buy premium — and the best time to sell it via short-duration credit spreads.
- Lower band touches in confirmed uptrends: In stocks where price has made a series of higher highs and higher lows over the past 3 months, a touch of the lower Bollinger Band during a pullback — combined with RSI dropping below 40 but not 30 — often marks a high-probability continuation entry. Read more about RSI levels in our guide to RSI overbought and oversold signals.
- Crypto squeeze breakouts: Bollinger Squeeze breakouts in crypto assets show the strongest historical performance of any asset class. When major crypto assets form a squeeze on both the daily and 4-hour timeframes simultaneously, the alignment often precedes outsized moves — the kind that makes long straddles profitable even with elevated entry premiums.
Combining Bollinger Bands with RSI for Options Timing
Bollinger Bands show where volatility is. RSI shows when momentum is exhausted. Together, they form a complete timing system for options entries.
The core framework:
- Bollinger Bands identify the volatility regime (buy premium in squeeze, sell premium in expansion)
- RSI confirms directional bias and exhaustion signals at band extremes
- The combination filters out the majority of false signals that either indicator generates alone
For traders new to RSI, our complete beginner's guide to RSI covers the foundational concepts. If you're already familiar with RSI basics, the RSI settings guide explains how to optimize period settings for different options strategies and timeframes.
Advanced traders should also explore hidden RSI divergence — a continuation signal that fires inside Bollinger Bands during trend retracements and is one of the highest-conviction entry triggers available.
Price tags the lower Bollinger Band while RSI simultaneously drops to the 30–35 zone — not oversold enough to signal panic, but stretched enough to indicate a retracement in a broader uptrend. The next session's close back above the 20-SMA confirms the bounce. Failure to reclaim the 20-SMA within three sessions invalidates the setup and signals deeper weakness.
Risk Management for Bollinger Bands Options Plays
Options decay fast. That changes the risk management math completely.
For premium buyers in squeeze breakouts:
- Use options with 21–45 days to expiration (DTE) — enough time for the move to develop without excessive theta decay
- Risk no more than 2-3% of account per trade on long premium plays
- Set a hard stop at 50% of premium paid — if the move doesn't happen within 5 sessions, exit
- Take partial profits (50-75% of position) when the first ATR target is reached
For premium sellers in band-expansion environments:
- Use credit spreads rather than naked options — define your maximum risk
- Sell options with 7-21 DTE to maximize theta capture
- Set a stop at 2x the credit received — a standard premium-selling risk rule
- Avoid selling premium into earnings — IV behavior becomes unpredictable
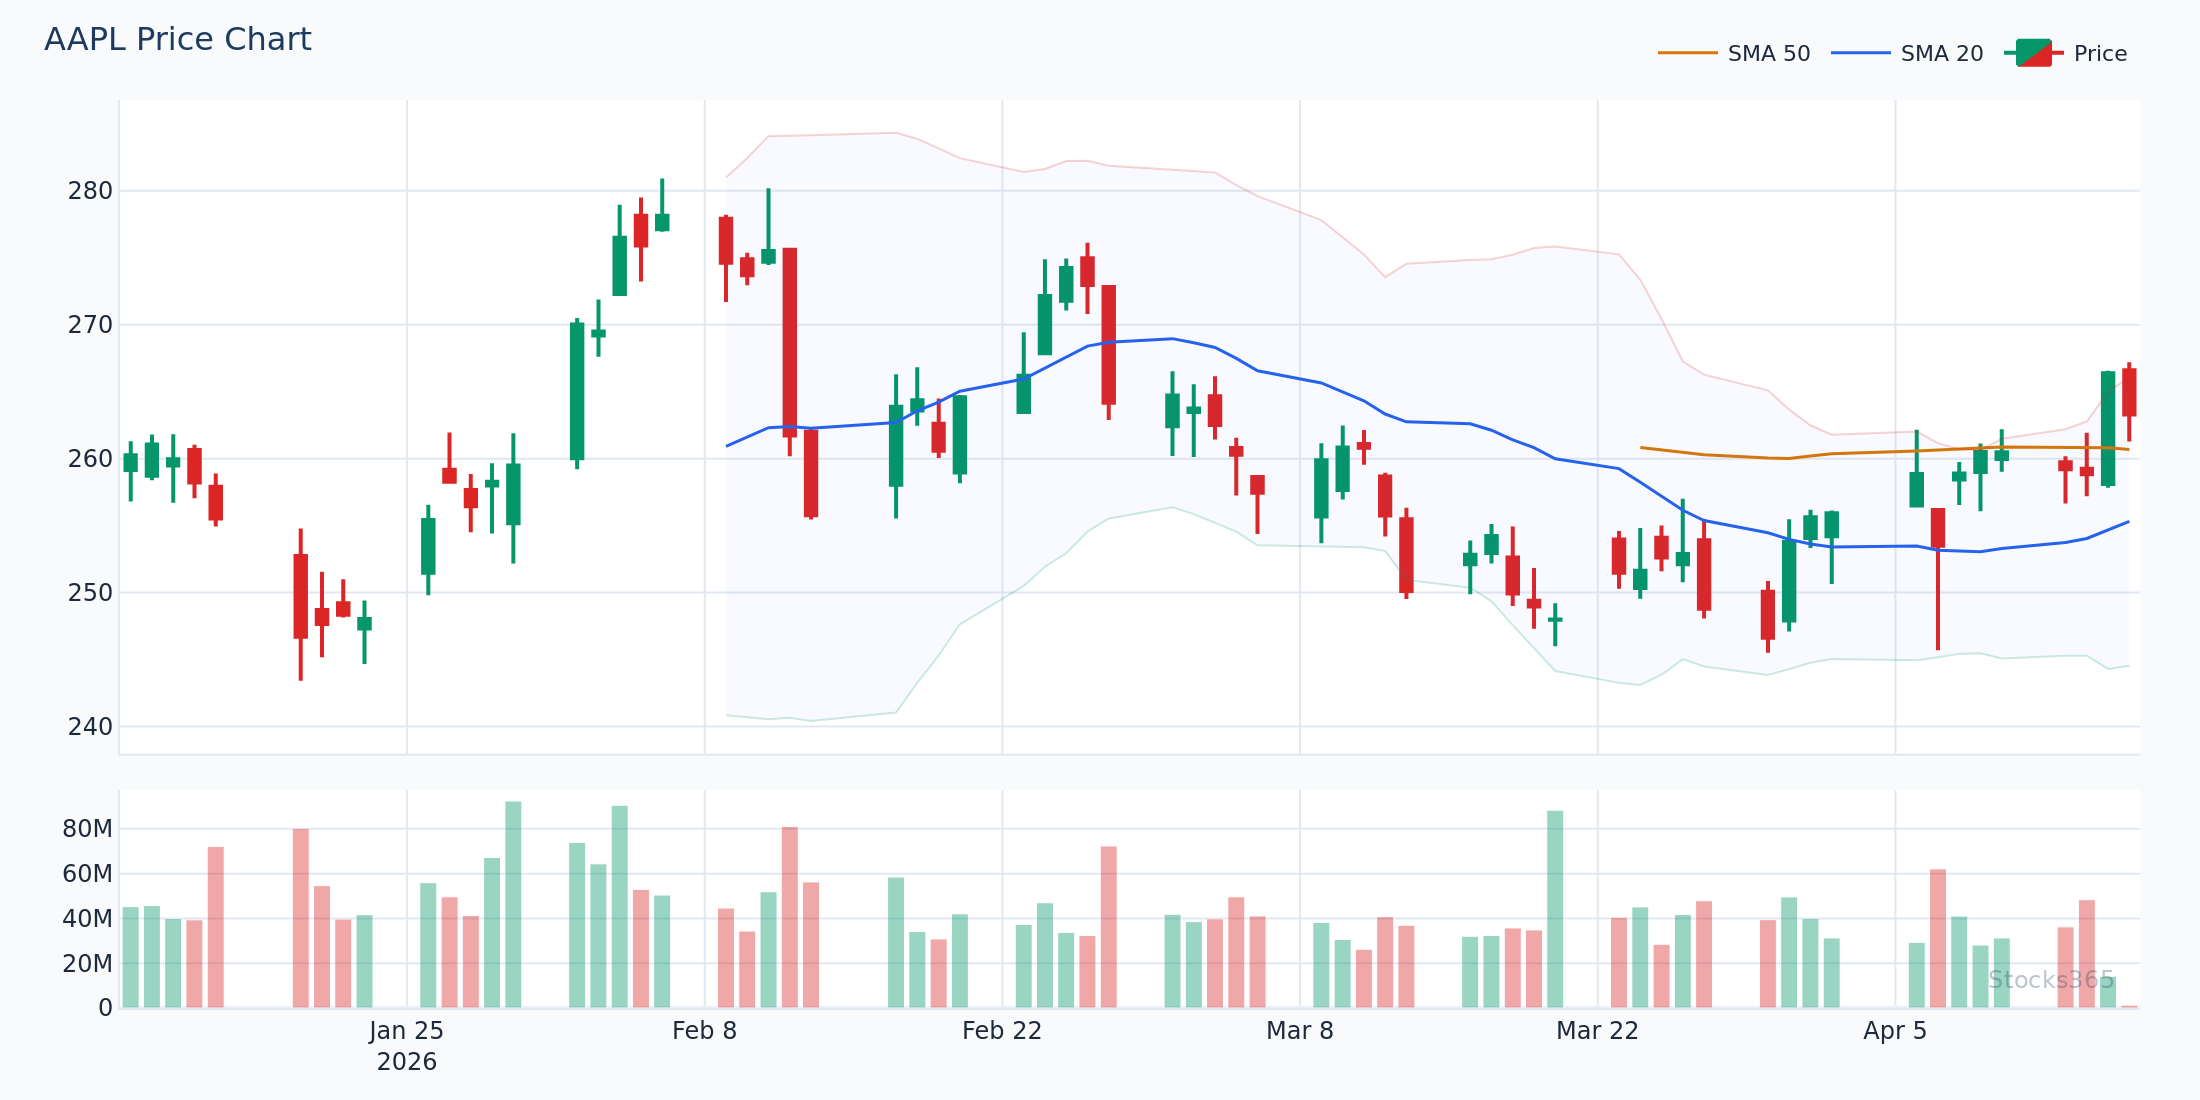
Track your setups systematically. Signals on individual stocks like AAPL show you the current Bollinger Band configuration, trust score, and signal history — reducing the manual chart-scanning time significantly.
Timeframe Selection for Bollinger Bands Options Trading
Timeframe determines everything in options trading. The squeeze on a weekly chart is far more powerful than a squeeze on a 5-minute chart — and the options strategy changes accordingly.
- Daily chart squeezes: Target weekly or monthly options (21-45 DTE). These setups produce the largest moves and justify long premium strategies.
- 4-hour chart squeezes: Target weekly options (7-14 DTE). Faster resolution, more frequent signals, but smaller typical moves.
- Weekly chart squeezes: Rare, but extremely powerful. When the weekly Bollinger Bands compress, use 60-90 DTE options — the move can take 4-8 weeks to fully develop.
Align your option expiration with the timeframe of the squeeze. Mismatched expirations are one of the top reasons technically-correct Bollinger Bands calls still result in losing options trades.
How Stocks365 Uses Bollinger Bands
Bollinger Bands are one of 12+ technical indicators integrated into the Stocks365 Trust Score system. Within the platform, Bollinger Band signals contribute primarily to the volatility regime scoring layer — which determines whether a stock is in a low-volatility (squeeze) or high-volatility (expansion) state at the time of signal generation.
When a Bollinger Squeeze is detected, the Trust Score weights momentum and breakout confirmation signals more heavily, since the squeeze context changes the probability distribution of directional signals. A breakout signal during a squeeze carries a different weight than the same breakout signal during an already-expanded band environment.
The Trust Score also cross-references Bollinger Band configuration with RSI regime, volume profile, and trend direction to produce a composite signal agreement score — giving traders a single, synthesized view of whether multiple indicators are aligned or in conflict. Explore signal data for individual instruments at Stocks365 Dashboard, or dive into the full research dataset at Stocks365 Insights.
Key Takeaways
- Bollinger Bands measure realized volatility — wide bands mean high volatility, narrow bands mean compression. This maps directly onto options implied volatility behavior.
- The Squeeze Breakout is the highest-probability Bollinger Band signal for options buyers. Buy cheap premium during compressions, before IV expands.
- Band touches alone have sub-breakeven win rates — Stocks365 data shows a 49.6% win rate and 0.88 profit factor on raw upper band touches across 3,255 signals. Confirmation filters are non-negotiable.
- Sell premium in band-expansion environments — high IV and wide bands favor credit strategies like iron condors and credit spreads.
- Combine with RSI for exhaustion confirmation at band extremes. Divergence signals at the upper or lower band are among the highest-conviction reversal triggers available.
- Match option DTE to chart timeframe — a daily squeeze needs 21-45 DTE options. Mismatched expirations destroy otherwise valid setups.
- Crypto leads performance on Bollinger Band signals across all categories — squeeze breakouts show a 51.8% win rate in crypto versus 47.1% in forex.
| # | Strategy | Type | Win Rate | Sharpe | PF | N | Status |
|---|---|---|---|---|---|---|---|
| #1 | Bollinger Squeeze Breakout | volatility | 49.5% | 0.04 | 1.03 | 14,266 | TEST |