
Bollinger Bands RSI Strategy: Why This Combination Works
Most indicators fail in isolation. Bollinger Bands tell you where price is relative to volatility. RSI tells you how strong the move behind that price is. Combine them, and you get a filter that removes a massive percentage of false signals.
That's the core of the Bollinger Bands RSI strategy — not complexity, but confirmation.
Stocks365 backtested 3,255 Bollinger Upper Band Touch signals across multiple asset classes and found a 49.6% win rate overall, with crypto leading at 56.7% and commodities lagging at 41.5%. Those raw numbers tell a story: the setup alone isn't enough. RSI is the filter that separates the winners from the noise. You can explore the full methodology on our research dashboard.
This article covers everything — the mechanics, the exact entry and exit rules, the common mistakes, and how to read the setup in real time.
Understanding the Two Indicators Before Combining Them
Don't skip this. Traders who rush to the rules without understanding the logic will misapply the strategy at the worst possible moment.
How Bollinger Bands Function as a Volatility Map
Bollinger Bands consist of three lines: a 20-period simple moving average (the middle band), and two outer bands placed two standard deviations above and below. When volatility expands, the bands widen. When volatility contracts, they squeeze together.
Price touching the upper band doesn't automatically mean sell. Price touching the lower band doesn't automatically mean buy. What matters is why price is at that band — and that's exactly where RSI steps in.
For a deeper breakdown of the math powering these bands, read our guide on How Bollinger Bands Work: Master the Math Behind It.
What RSI Actually Measures
The Relative Strength Index (RSI) measures the speed and magnitude of recent price changes on a 0–100 scale. Readings above 70 traditionally signal overbought conditions. Readings below 30 signal oversold. But context is everything.
RSI trending above 60 during a strong uptrend is a sign of momentum, not exhaustion. RSI dropping to 28 during a panic selloff can mean capitulation — or it can mean more pain is coming. The RSI Indicator: The Complete Trading Guide for 2026 covers every scenario in detail.
The Core Bollinger Bands RSI Strategy Setup
The strategy works on any timeframe but performs most consistently on the daily and 4-hour charts. Here are the exact parameters to use before you look at a single signal.
Indicator Settings
- Bollinger Bands: 20-period SMA, 2 standard deviations
- RSI: 14-period, standard settings
- Volume filter (optional but recommended): 20-period average volume for confirmation
Long Entry Rules (Bullish Setup)
All four conditions must align. Not three. All four.
- Price touches or closes at the lower Bollinger Band
- RSI is at or below 30 (oversold territory)
- RSI begins to curl upward — the turn matters more than the absolute level
- The next candle closes back inside the bands (confirmation candle)
The confirmation candle is non-negotiable. Entering before the close of that candle puts you in front of a pattern that hasn't confirmed yet. That's how traders get trapped in falling knives.
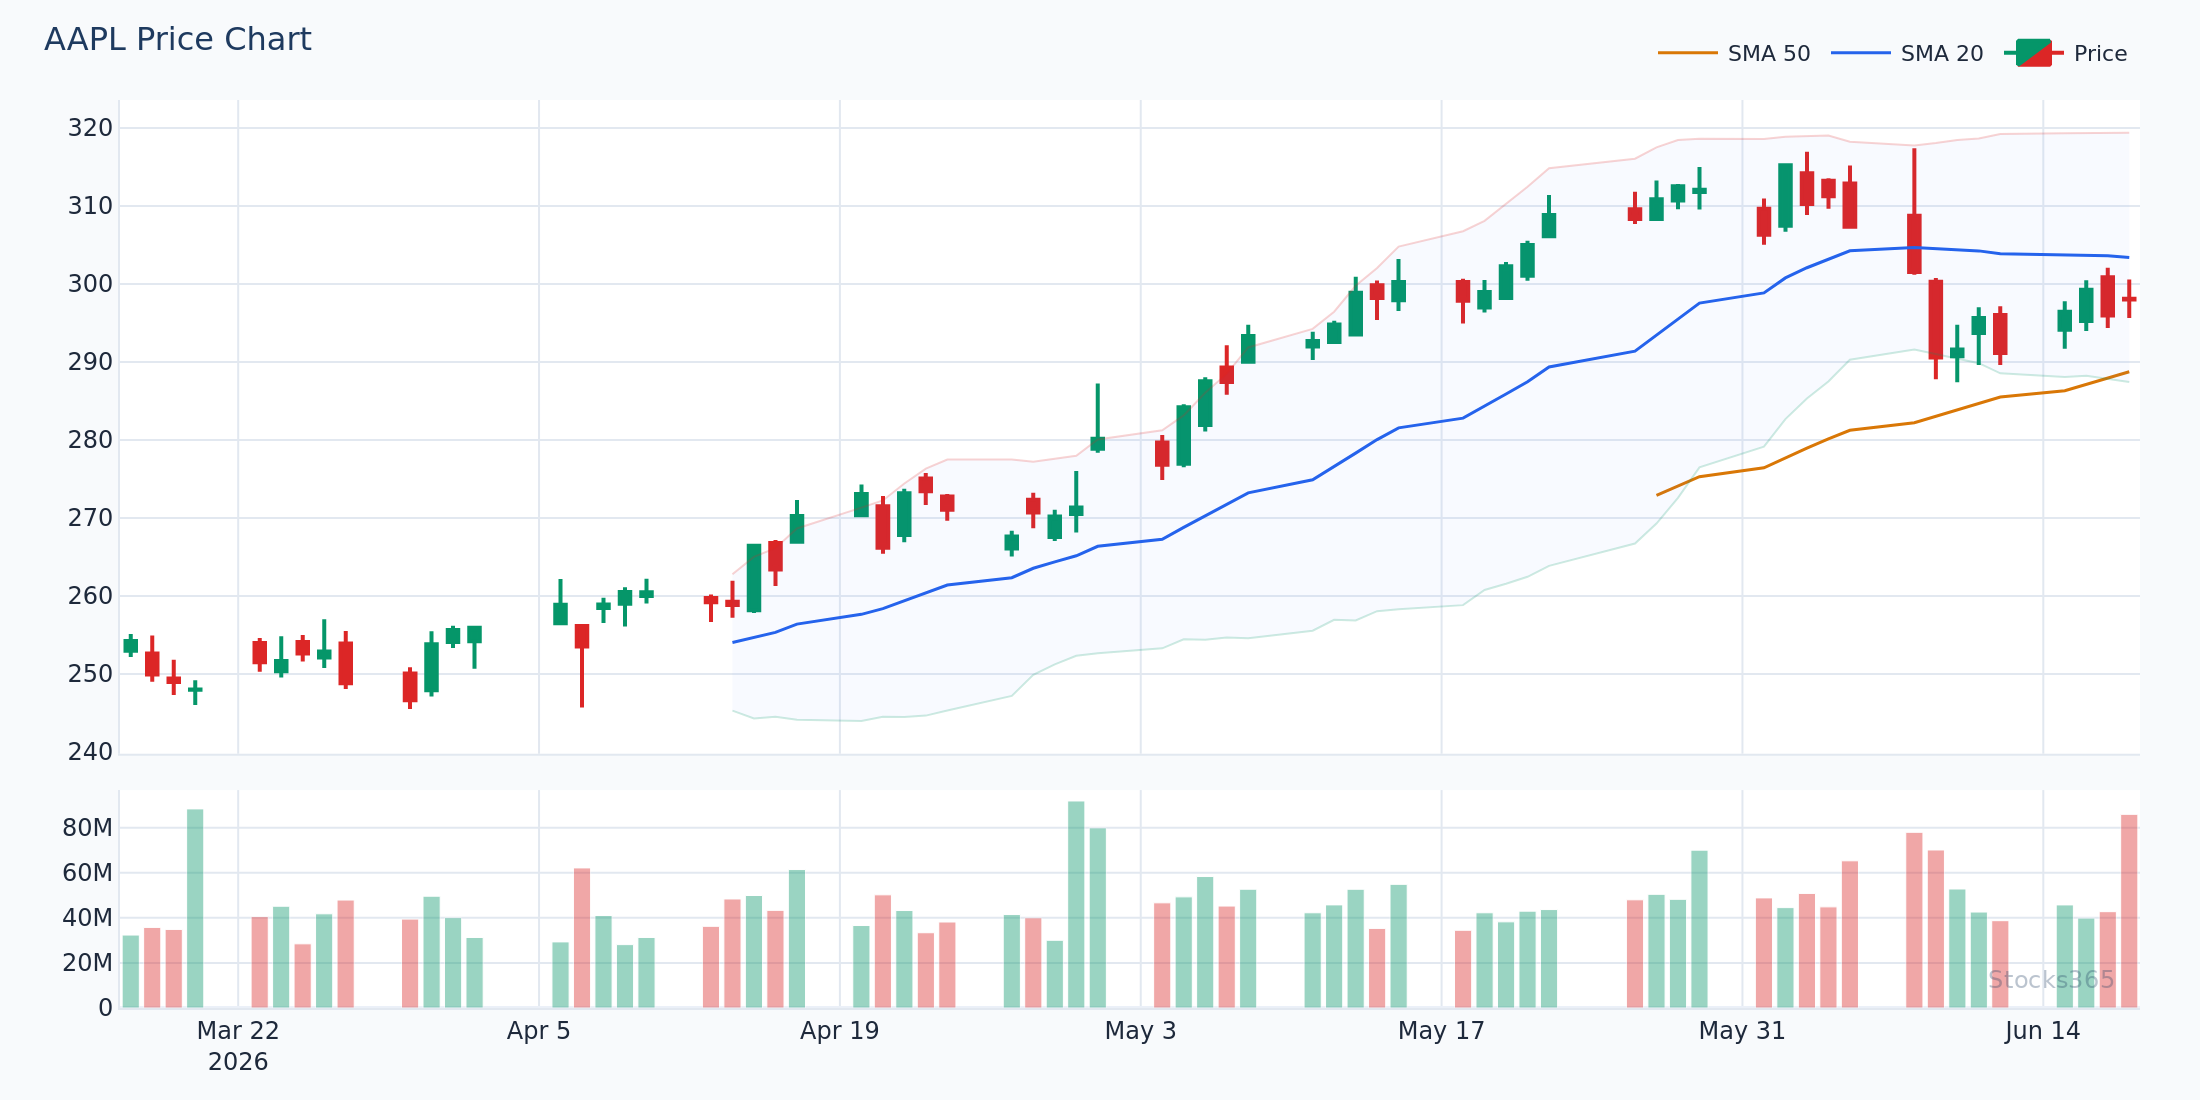
This setup shows price compressing against the lower band while RSI dips under 30 — a classic mean-reversion trigger. When the following candle closes back inside the bands with RSI turning upward, the entry is confirmed. If price continues to close below the lower band for two or more consecutive sessions, the setup is invalid and the position should not be taken.
Short Entry Rules (Bearish Setup)
- Price touches or closes at the upper Bollinger Band
- RSI is at or above 70 (overbought territory)
- RSI begins to roll over — look for a lower high on the RSI line
- The next candle closes back inside the bands (confirmation candle)
Same logic applies. Wait for the candle to close. Patience is the strategy.
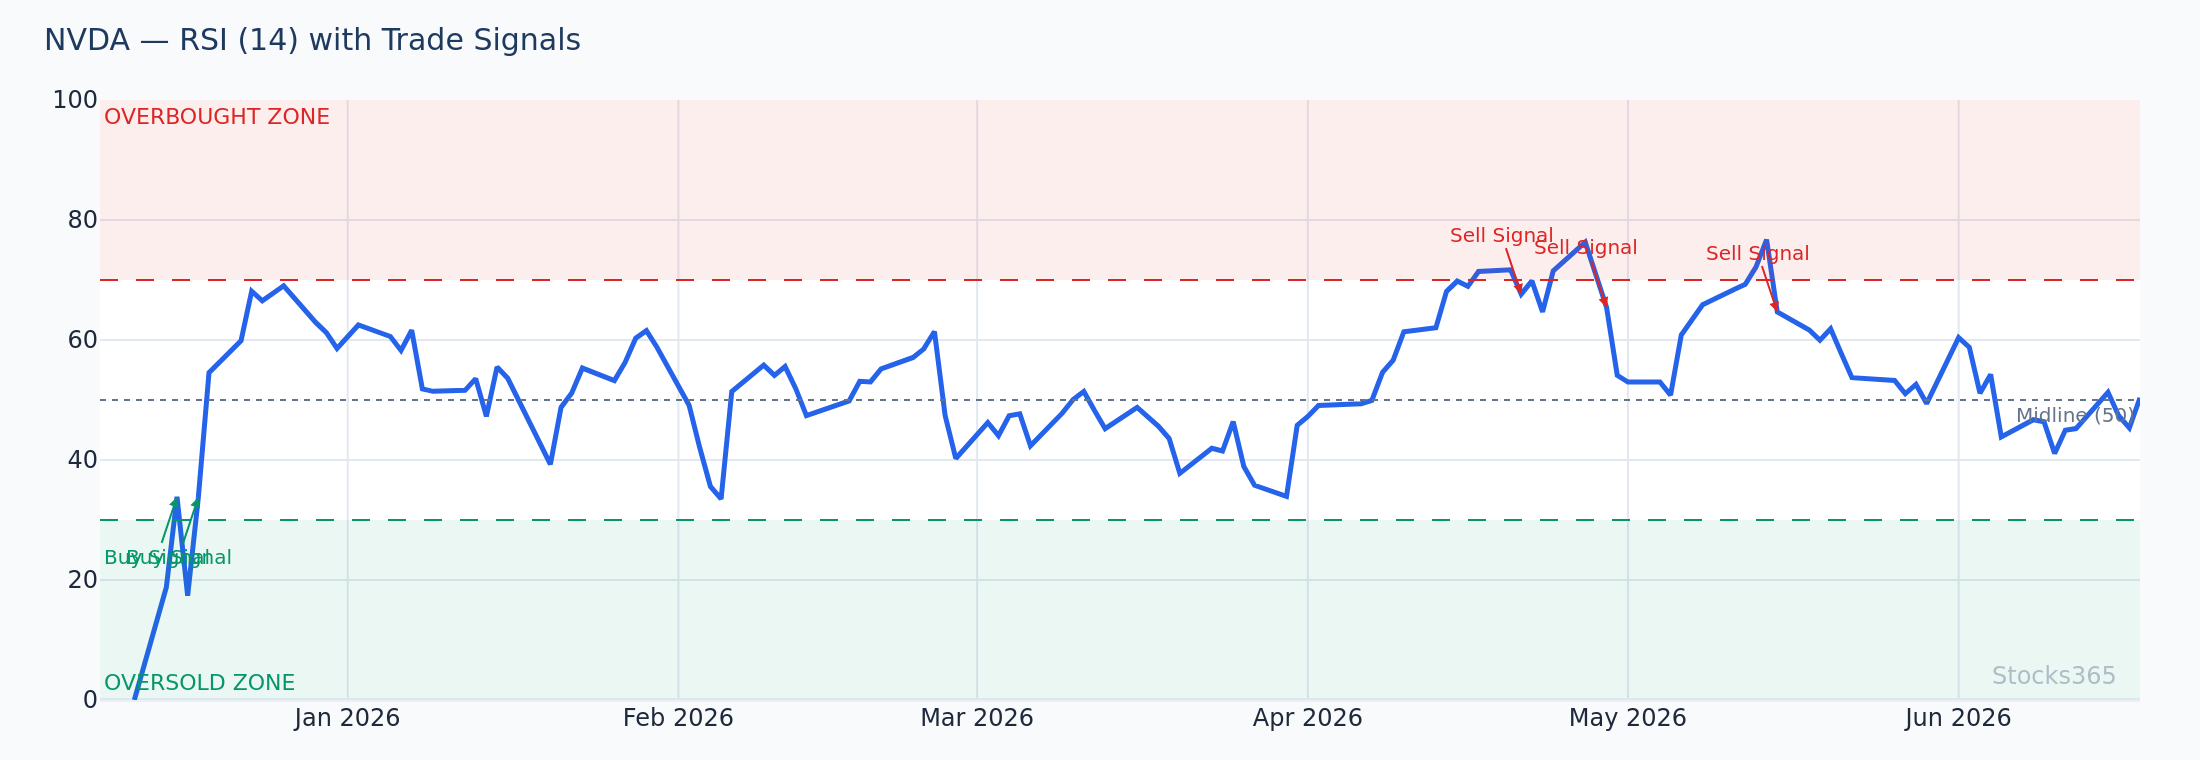
Here, RSI peaks above 70 and begins forming a lower high while price tests the upper band — a textbook bearish signal in this strategy. The confirmation comes when the candlestick closes back inside the bands, ideally with a bearish engulfing or shooting star pattern. A sustained close above the upper band with RSI remaining elevated above 75 invalidates the short thesis entirely.
Exit Rules: When to Take Profit and When to Cut Losses
Entry rules get the attention. Exit rules determine whether you actually make money.
Profit Targets for Long Trades
- Primary target: The 20-period SMA (middle Bollinger Band) — this is the natural mean-reversion target and where most moves stall
- Extended target: The upper Bollinger Band — only valid when RSI is trending above 50 and momentum is clearly shifting
- Partial exit approach: Close 50–60% of the position at the middle band, let the remainder ride toward the upper band with a trailing stop
Stop Loss Placement
- For longs: Place the stop below the lowest wick of the signal candle, not the close. Give the trade room to breathe.
- For shorts: Place the stop above the highest wick of the signal candle
- Maximum stop: 1.5x ATR from entry. If the structure requires a wider stop, skip the trade.
When to Exit Early
Exit early when RSI fails to follow through. If you're in a long trade and RSI stalls below 45 without reaching 50, the momentum isn't there. That's the market telling you something. Listen.
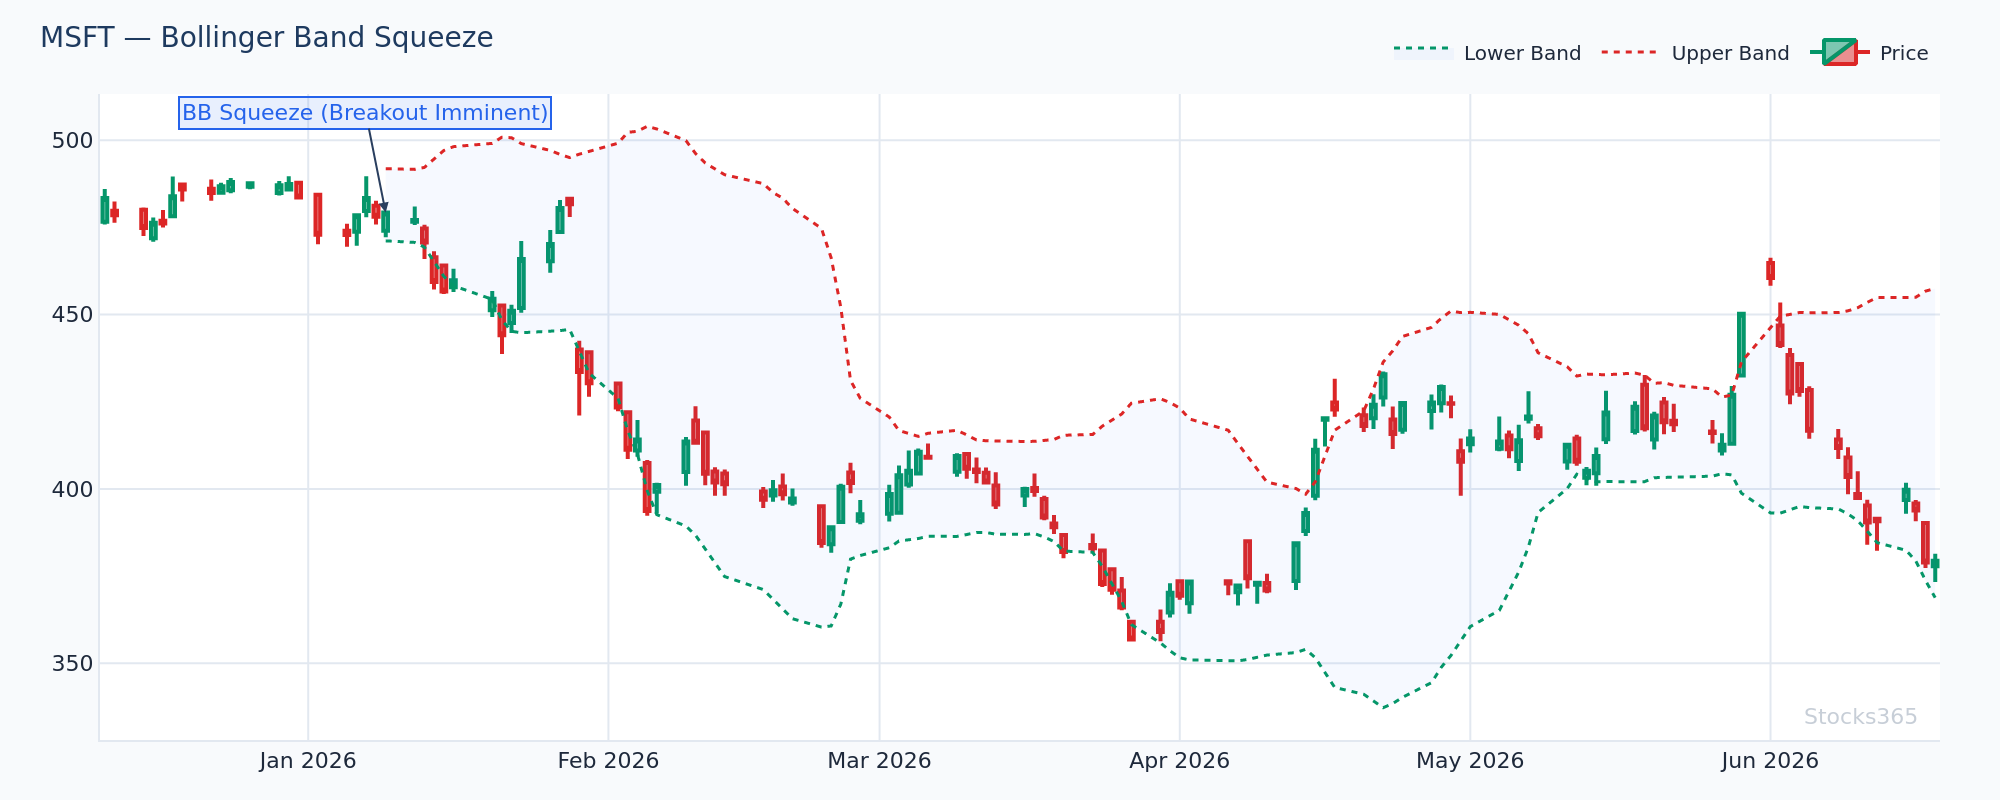
This chart illustrates a band squeeze — where the bands contract sharply before a directional expansion. The breakout direction becomes more reliable when RSI confirms the move: above 55 for bullish breakouts, below 45 for bearish ones. When price breaks out but RSI diverges — moving opposite to price — treat the breakout with extreme skepticism and wait for a retest. The Bollinger Band Squeeze guide covers this pattern in full detail.
Here's What Most Traders Get Wrong
Most traders see price hit the lower Bollinger Band and RSI below 30, and they buy immediately. They think the signal is complete. It isn't.
The lower band and RSI below 30 is a condition, not a signal. In downtrending markets, price walks the lower band for sessions — sometimes weeks. RSI can stay below 30 for an extended period during sustained selling pressure. The confirmation candle closing back inside the bands is what transforms a condition into an actionable signal.
Without confirmation, you're catching falling knives with a technical-sounding excuse.
The same logic applies on the short side. RSI above 70 during a momentum-driven rally can persist far longer than most traders expect. The edge isn't selling RSI 70 — it's selling RSI when it breaks back below 70 after the upper band rejection. That one detail is the difference between trading the strategy and trading a misconception of it.
When This Strategy Works — and When It Doesn't
No strategy works everywhere. The Bollinger Bands RSI strategy is a mean-reversion approach at its core. That means it performs best in range-bound and mildly trending environments. It struggles in strong trending markets where price persistently walks the bands.
Best Market Conditions
- Sideways or oscillating price action with identifiable highs and lows
- Moderate volatility — not too compressed (pre-breakout), not too expanded (post-news spike)
- Higher-liquidity assets where band touches reflect genuine supply/demand imbalances
Conditions Where This Strategy Underperforms
- Strong directional trends — price walking the upper or lower band without reverting
- Major news catalysts — bands expand violently, RSI readings become unreliable for 1–3 sessions
- Illiquid assets — band touches can be manufactured by low volume
Our analysis of 3,042 RSI Momentum Shift signals (n=3,042) found a 51.9% win rate on stocks versus just 39.2% on crypto. The implication is direct: this strategy's mean-reversion logic has historically been more reliable on equities with predictable institutional participation patterns than on assets driven by sentiment-heavy retail flows. Apply that data to your asset selection, not just your chart setup.
Adding RSI Divergence for Higher-Probability Entries
This is the upgrade most traders never apply. Regular RSI divergence — where price makes a new low but RSI makes a higher low — dramatically increases the probability of a successful lower band bounce.
When you see price at the lower Bollinger Band and RSI below 30 and bullish RSI divergence, you're stacking three independent confirming signals. That's a high-conviction setup, not just a mechanical entry. For the more advanced version of this, Hidden RSI Divergence is worth studying — it catches continuation moves that most traders miss entirely.
This setup displays price printing a lower low at the band while RSI forms a higher low — classic bullish divergence. The combination of band location, RSI oversold reading, and divergence creates a three-layered confirmation structure. If price then closes back inside the band on the next candle, this becomes one of the cleanest setups in this strategy. Divergence that disappears on the confirmation candle — with RSI dropping further — cancels the trade.
Combining With Trendlines for Directional Bias
The Bollinger Bands RSI strategy performs better when you overlay trendline context. A lower band touch in an uptrend is a buy-the-dip opportunity. A lower band touch in a downtrend is a potential dead-cat bounce — handle with care.
RSI trendlines add a second layer. When a descending RSI trendline breaks upward at the same time price bounces from the lower band, that trendline break acts as a momentum trigger, not just a level. The RSI Trendline Strategy guide explains exactly how to draw these lines and use them for entry timing.
Want to go even further? The Golden Cross vs Death Cross framework gives you the macro trend direction that should frame every Bollinger Bands RSI trade you take.
Comparing Bollinger Bands RSI to Similar Strategies
The logical alternative is the Bollinger Bands Stochastic combination. Both use a band indicator with a momentum oscillator. The difference is sensitivity — Stochastic is faster and noisier. RSI provides cleaner signals with fewer whipsaws on the daily timeframe.
That said, if you trade intraday and need faster signals, the Stochastic may complement band analysis better. See How to Read the Stochastic Oscillator to compare the two approaches directly. The RSI Backtesting Results article also puts hard numbers behind what RSI actually delivers — essential reading before committing capital to any RSI-based approach.
What to Watch For
- Lower band touches with RSI divergence in large-cap stocks during broad market pullbacks. When the S&P 500 corrects 5–8% and individual large-cap names reach their lower bands with RSI divergence forming, these are historically among the cleanest mean-reversion setups in this strategy.
- Upper band rejections on crypto after parabolic moves. When a crypto asset extends more than two standard deviations above its 20-SMA and RSI simultaneously peaks above 75 before rolling, the band rejection tends to be sharper and faster than in equities — the 56.7% win rate on crypto band touches reflects this dynamic.
- Band squeezes on tech stocks preceding earnings. When Bollinger Band width compresses below its 20th percentile on a major tech name into a catalyst event, the post-squeeze expansion frequently produces moves of 2–3 ATR. RSI direction on the breakout candle helps determine whether to trade the long or short side of that expansion.
- RSI trendline breaks coinciding with middle band reclaims. When price reclaims the 20-SMA (middle band) from below at the same time a descending RSI trendline breaks upward, the combination signals momentum shift with structural support — a layered entry that tends to produce cleaner risk/reward than either signal alone.
- Failed upper band breakouts with declining volume. When price pushes above the upper band on declining volume and RSI fails to exceed its previous peak (forming a bearish divergence), the subsequent re-entry inside the bands often accelerates quickly. Volume divergence plus RSI divergence plus band overextension is the short setup to prioritize.
How Stocks365 Uses This
Stocks365 Trust Score Integration
The Bollinger Bands RSI combination is one of more than 12 technical indicators embedded in the Stocks365 Trust Score system. Specifically, Bollinger Band position contributes to the volatility and mean-reversion scoring layer, while RSI readings feed into the momentum agreement component. When both indicators align — band touch plus RSI extreme plus directional confirmation — the Trust Score reflects elevated agreement across the momentum and volatility axes, producing a higher-confidence signal rating.
This isn't a simple two-factor check. The system weights these signals against trend regime, volume context, and cross-asset correlation before assigning a Trust Score. A lower band touch with RSI below 30 in a confirmed downtrend scores differently than the identical setup in a sideways consolidation. That context-awareness is what separates mechanical screening from intelligent signal generation.
You can see these Trust Scores live for any stock on the Signals Dashboard, or drill into individual names like AAPL signals to see exactly how each indicator layer is contributing to the current score.
Key Takeaways
Summary: Bollinger Bands RSI Strategy
- The strategy works by combining Bollinger Band position (volatility context) with RSI readings (momentum strength) — neither indicator is sufficient alone
- Long entries require: lower band touch, RSI at or below 30, RSI turning up, confirmation candle closing inside the bands
- Short entries require: upper band touch, RSI at or above 70, RSI rolling over, confirmation candle closing inside the bands
- The confirmation candle is mandatory — entering before it closes is the single most common mistake
- Primary profit target for mean-reversion longs and shorts is the 20-SMA middle band; extended target is the opposite band
- RSI divergence at band extremes significantly increases setup quality — layer it in when present
- The strategy performs best on equities in range-bound conditions; crypto shows stronger results on band touches, but with higher variance
- Trendline context on both price and RSI improves directional bias and entry timing