
Bollinger Bands Swing Trading: How to Capture Multi-Day Moves
Swing trading is a game of patience and precision. You're not scalping ticks or holding through earnings seasons — you're hunting for the 3-to-10-day moves that make up the bulk of tradeable price action. Bollinger Bands were practically built for this timeframe.
Most traders use them wrong. Here's how to use them right.
Across 14,266 Bollinger Squeeze Breakout signals backtested by Stocks365, this setup produced a profit factor of 1.03 over a 10-day holding period — with crypto leading at 51.8% win rate and forex lagging at 47.1%. That edge is real, but it's narrow. The setups that turn that narrow edge into consistent profits are what this guide covers.
What Are Bollinger Bands and Why They Work for Swing Trading
Bollinger Bands consist of three lines: a 20-period simple moving average in the center, and two bands plotted two standard deviations above and below that average. The bands expand when volatility rises and contract when markets quiet down.
For a deeper look at the math behind the indicator, read our guide on How Bollinger Bands Work: Master the Math Behind It.
The reason Bollinger Bands pair so well with swing trading is simple: standard deviation is a mean-reverting measure. Price doesn't stay two standard deviations away from its mean for long. Eventually, it snaps back. That snap — and sometimes that extended trend — is exactly what swing traders are trying to ride.
Two primary setups emerge from this behavior:
- Mean reversion: Price touches the outer band and reverts toward the middle band (the 20-SMA).
- Trend continuation (Squeeze Breakout): Bands contract to unusually tight levels, then price breaks out and rides the new outer band.
Both work. Both also fail under specific conditions. Knowing which environment you're in changes everything.
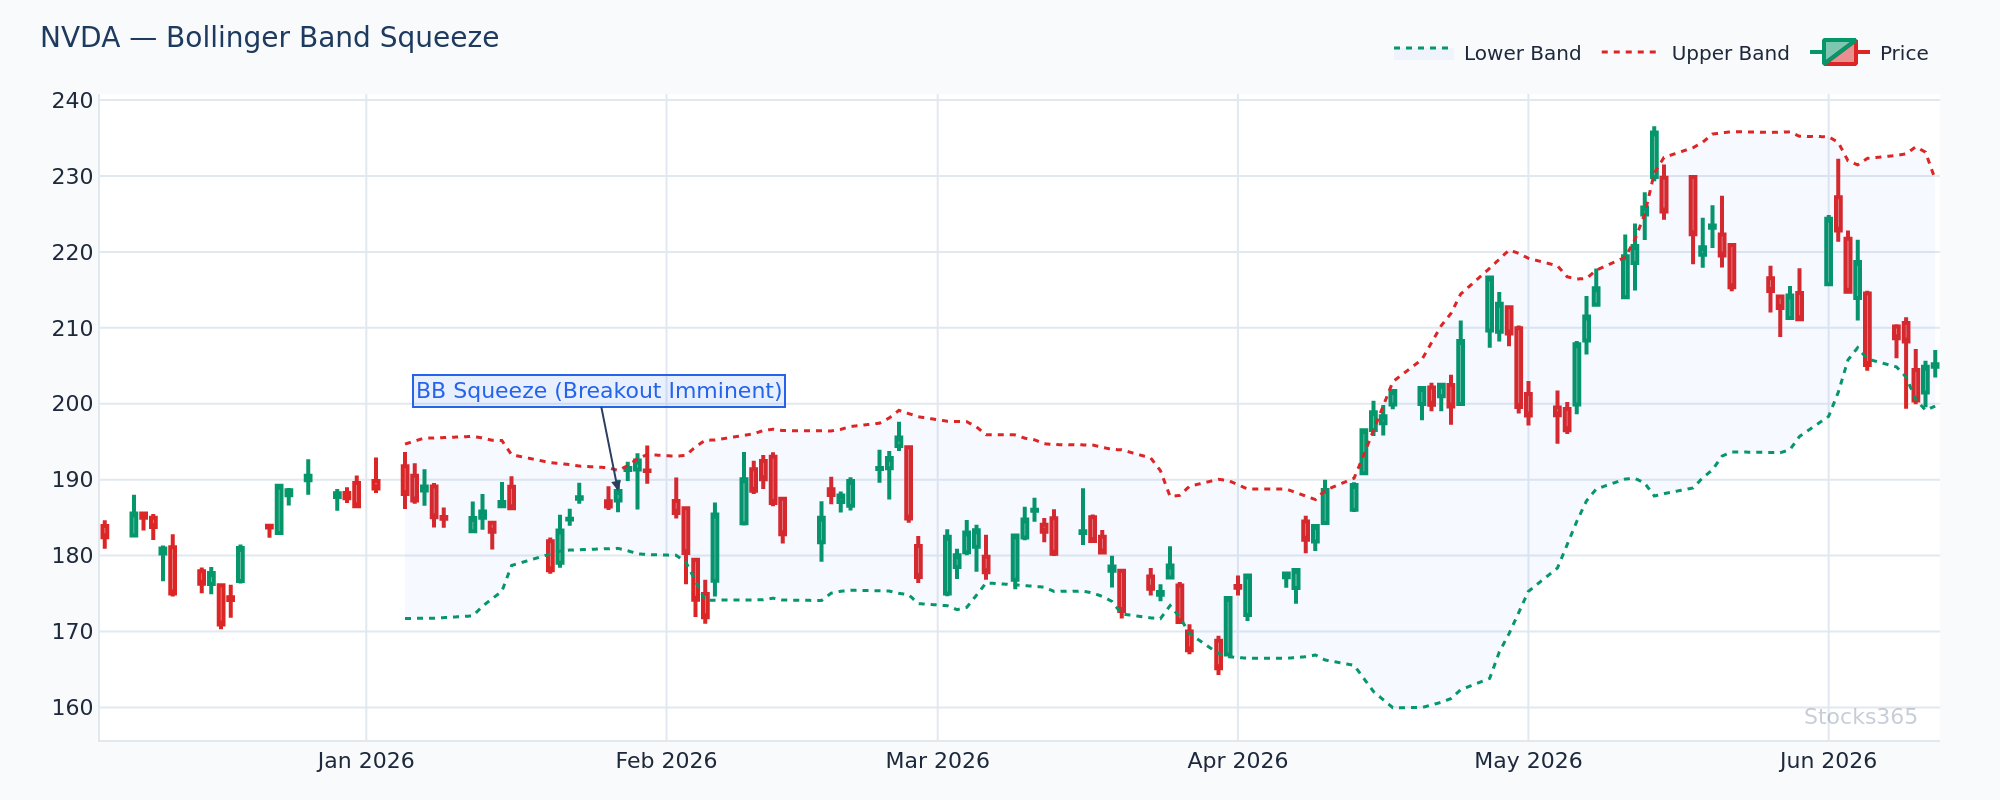
This chart shows NVDA's band width compressing to multi-week lows before a directional expansion. When the bands tighten this dramatically, price is coiling energy — the breakout candle that follows often closes well beyond the upper or lower band on elevated volume. The pattern is invalidated if price breaks out but then immediately re-enters the bands within one or two candles, signaling a false break rather than a genuine expansion.
The Bollinger Band Squeeze: Your Primary Swing Setup
The squeeze is the highest-probability swing setup Bollinger Bands produce. It's also the most misunderstood.
Here's what most traders get wrong: They watch the squeeze and buy the moment bands start widening. That's premature. A squeeze tells you a move is coming — it doesn't tell you which direction. Entering before confirmation is gambling, not trading. Wait for a decisive close outside the bands on volume that's at least 1.5x the 20-day average. That close is your trigger.
How to Identify a Valid Squeeze Setup
- Band width drops to its lowest level in 20+ trading sessions — this is the compression phase.
- Price consolidates within a tight range, often forming a flat base or triangle pattern inside the bands.
- Volume dries up during the compression (average daily volume drops noticeably).
- A breakout candle closes outside the band with volume surging 1.5x to 2x above the 20-day average.
- The initial breakout direction is confirmed by the next candle not fully reversing the move.
For a dedicated deep-dive on this setup, including band width percentile thresholds, read our full guide on the Bollinger Band Squeeze: Master Low Volatility Setups.
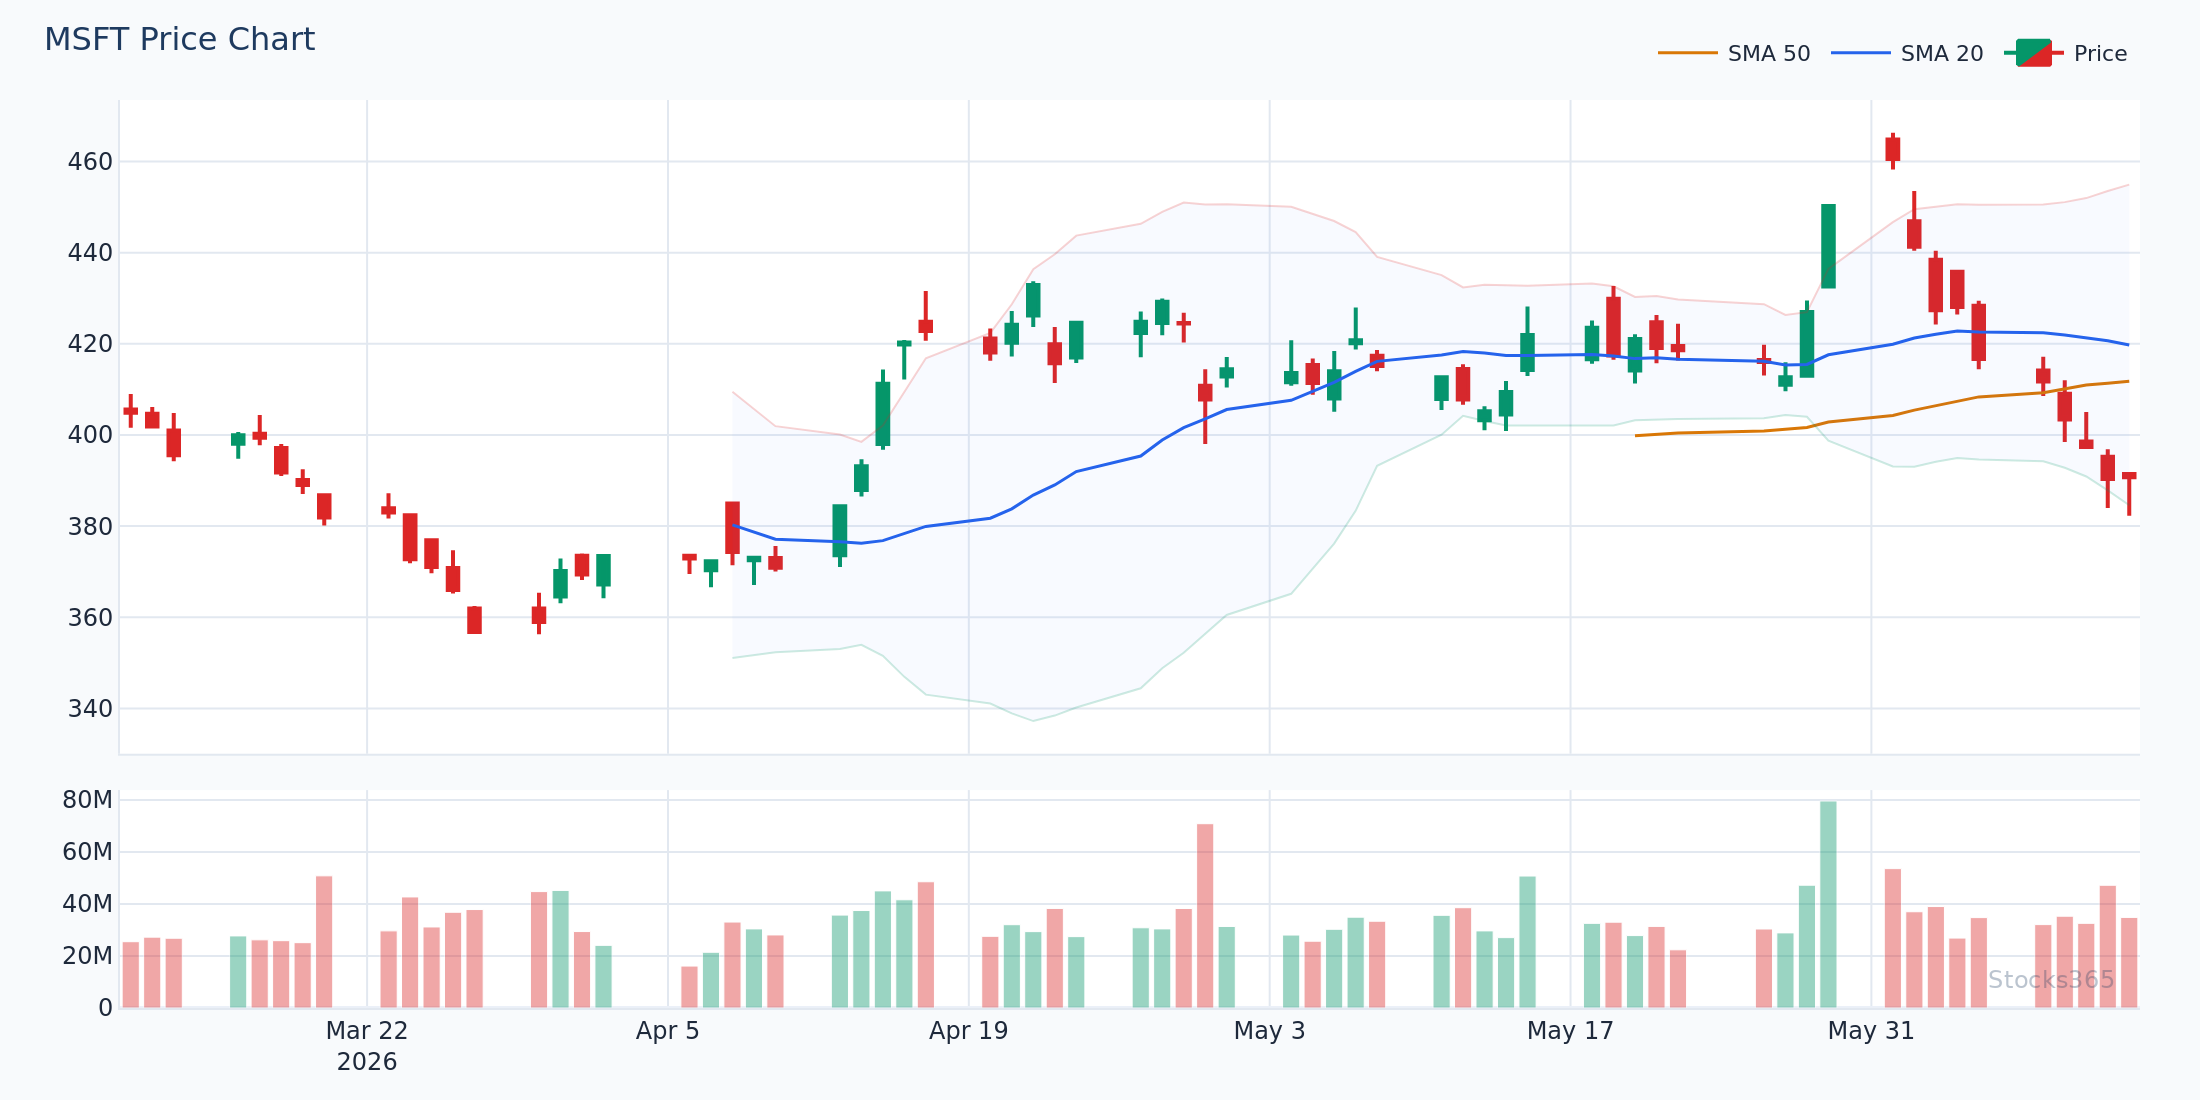
The MSFT chart here illustrates a classic squeeze resolution: a flat multi-week consolidation zone where the upper and lower bands pinch toward the 20-SMA, followed by a gap-and-go candle that closes above the upper band on a volume surge. In most cases after a valid breakout like this, price continues in the breakout direction for at least 3 to 5 trading sessions before the first meaningful retest. The setup is weakened if the breakout occurs on average or below-average volume — that's the first red flag.
Upper and Lower Band Touch: The Mean Reversion Swing Trade
When price tags the upper or lower Bollinger Band in a ranging or mildly trending market, it often signals short-term exhaustion. This is the foundation of the band-touch mean reversion setup.
The logic is straightforward. Price reaching two standard deviations from its mean is statistically unusual. In most market conditions, that extremity resolves toward the mean — toward the 20-SMA. For swing traders, the mean reversion journey from the outer band back to the middle band is the trade.
Setting Up the Band Touch Entry
Don't enter the moment price touches the band. That's reactive, not strategic. Here's a cleaner process:
- Identify the touch: Price closes at or beyond the upper or lower band.
- Wait for a reversal candle: A bearish engulfing, shooting star, or strong red close after an upper band touch. A bullish pin bar or green engulfing after a lower band touch.
- Confirm with momentum: RSI diverging from price (price makes a new high/low but RSI doesn't) strengthens the setup significantly.
- Enter on the next candle open: Place a stop beyond the extreme of the reversal candle.
- Target the 20-SMA: Your primary profit target. Secondary target is the opposite band.
Our Bollinger Bands Buy and Sell Signals Explained: Master Guide covers these entry and exit mechanics in full detail, including multi-timeframe confirmation approaches.
One critical point: mean reversion setups fail badly in strong trending markets. If price is walking up the upper band — consistently touching it session after session — that's not a sell signal. That's a strong uptrend. Context matters more than the band touch itself.
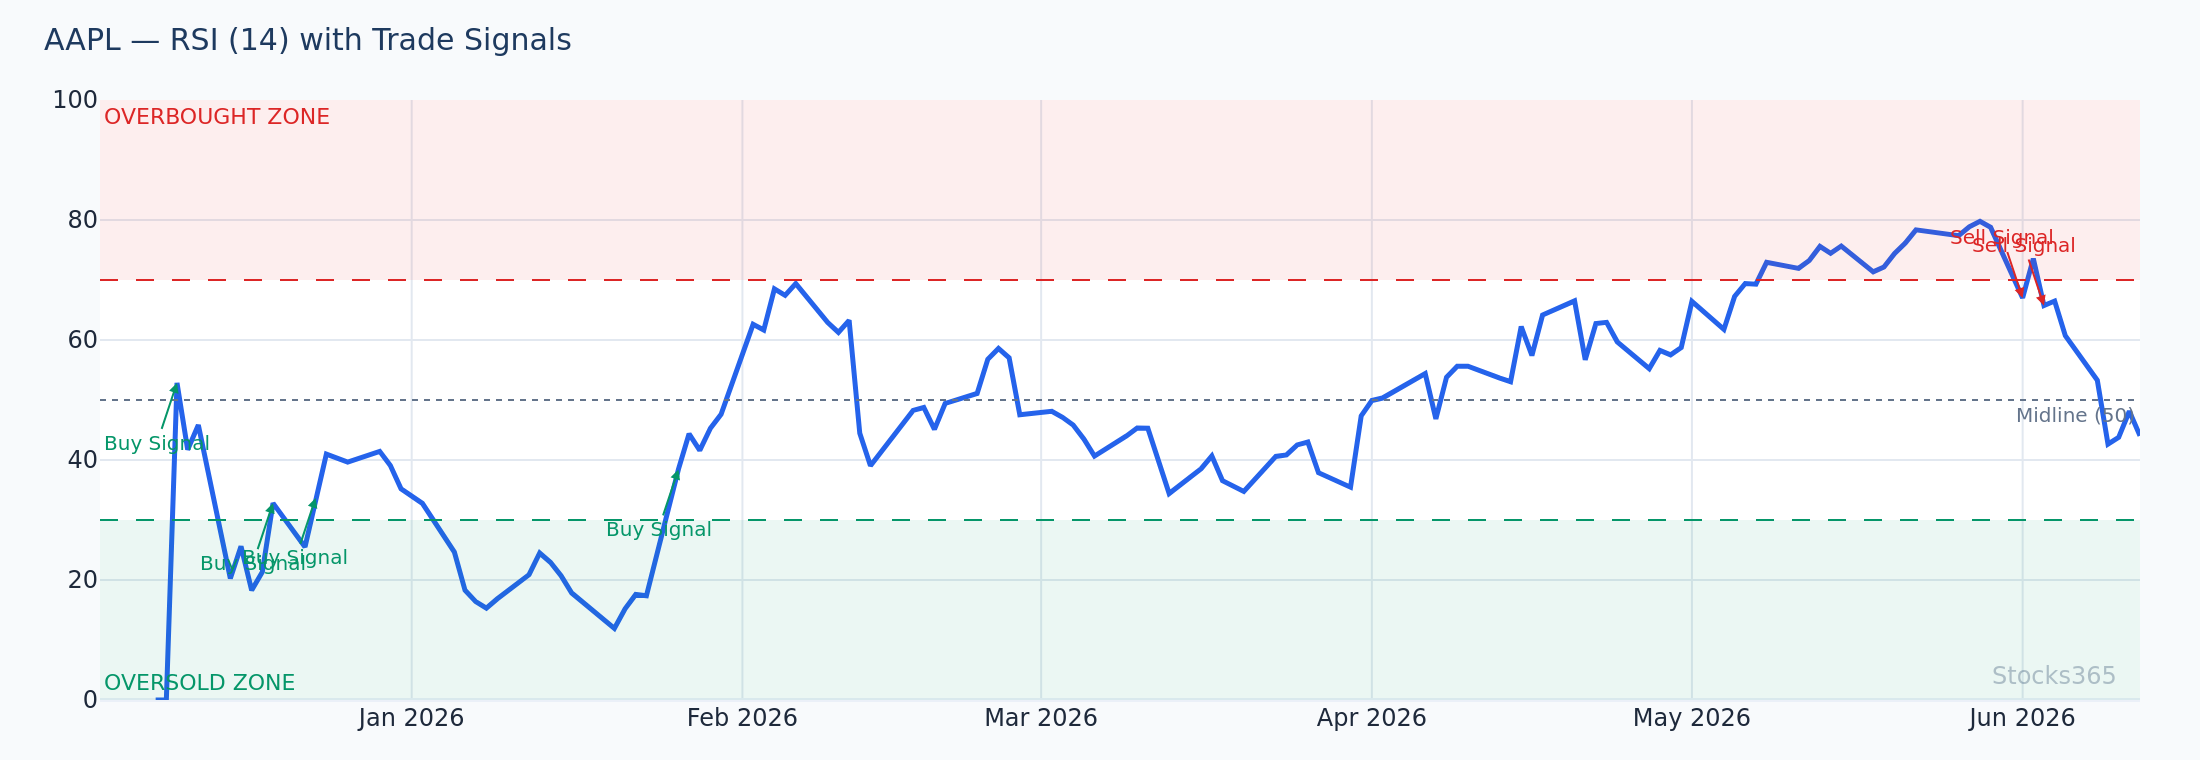
This AAPL setup shows price tagging the upper band while RSI forms a lower high — classic bearish divergence. When this combination appears, the mean reversion signal gains real weight because two independent measures agree: price is stretched and momentum is fading. The pattern is invalidated if RSI breaks to a new high alongside price, confirming that trend momentum remains intact rather than waning.
Combining Bollinger Bands with RSI for Swing Confirmation
Bollinger Bands tell you where price is relative to its statistical range. RSI tells you how fast it got there. Used together, they're significantly more powerful than either alone.
The combination works in both directions:
Bullish Confluence Setup
- Price touches or briefly breaks below the lower Bollinger Band.
- RSI simultaneously drops below 30 (oversold territory).
- A reversal candle forms — a hammer, bullish engulfing, or morning star pattern.
- RSI then turns back up from below 30.
- Entry on confirmation, targeting the 20-SMA or upper band.
Bearish Confluence Setup
- Price touches or breaks above the upper Bollinger Band.
- RSI simultaneously climbs above 70 (overbought territory).
- A reversal candle forms — a shooting star, bearish engulfing, or evening star.
- RSI rolls back below 70.
- Entry on confirmation, targeting the 20-SMA or lower band.
For RSI-specific strategies that complement this approach, see our RSI Indicator: The Complete Trading Guide for 2026 and our detailed breakdown of RSI Trendline Strategy: Master Drawing Lines for Better Signals.
Confluence is everything. A single indicator signal is a suggestion. Two aligned indicators pointing the same direction is a setup worth trading.
Adding Stochastic for a Triple-Confirmation Swing Trade
For traders who want maximum confirmation before entering a swing position, adding the Stochastic Oscillator creates a three-signal setup that's harder to fake.
The process: wait for a Bollinger Band touch, RSI in the relevant extreme zone, and Stochastic crossing in the reversal direction from an overbought or oversold reading. All three aligning simultaneously is rare — but when it happens, the quality of the setup jumps.
Our Stocks365 analysis of 3,026 BB + Stochastic Double Overbought signals found a 49.9% win rate over a 10-day holding period — with crypto performing best at 58.0% and commodities worst at 40.7%. The profit factor of 0.91 across all asset classes reminds us that overbought alone isn't enough. Asset class selection and market regime matter significantly. This data is drawn from our research dashboard, where you can explore signal performance across dozens of setups.
Learn to read Stochastic signals precisely with our guide: How to Read the Stochastic Oscillator: Step-by-Step.
Triple confluence doesn't appear every day. That's the point — you're waiting for the cleanest trade, not the most frequent one.
Multi-Day Swing Trade Structure: Entry, Hold, Exit
Identifying the setup is half the job. Managing the trade across multiple days is where most swing traders lose their edge.
Entry Timing
Daily chart setups are the foundation for Bollinger Band swing trades. Use the 4-hour chart to time your entry more precisely once the daily setup is confirmed. This reduces your average entry slippage without changing the trade thesis.
Stop Placement
For band touch mean reversion trades: place your stop just beyond the extreme of the reversal candle — slightly past the band breach. This keeps your stop logical (invalidation of the pattern) without being so tight that normal volatility stops you out.
For squeeze breakout trades: stop goes below the low of the breakout candle (for long trades) or above the high (for short trades). If price re-enters the consolidation range, the breakout has failed.
Holding Through the Swing
This is where discipline earns returns. After entry, normal pullbacks during a multi-day move will test your conviction. Use the 20-SMA as a dynamic line in the sand — for long swing trades, as long as daily closes remain above the 20-SMA, the trade is alive. Only a decisive close below it warrants early exit consideration.
Exit Strategy
- Mean reversion trades: Primary exit at the 20-SMA (center band). Partial exit there, trail the remaining position toward the opposite band.
- Squeeze breakout trades: Trail your stop using the 20-SMA as a guide. Exit when price closes back inside the bands after a breakout extension, or when a reversal candle forms at a new extreme.
- Time stop: If a trade hasn't moved meaningfully in your direction within 5 trading days, reassess. Stuck trades often mean the setup failed quietly.
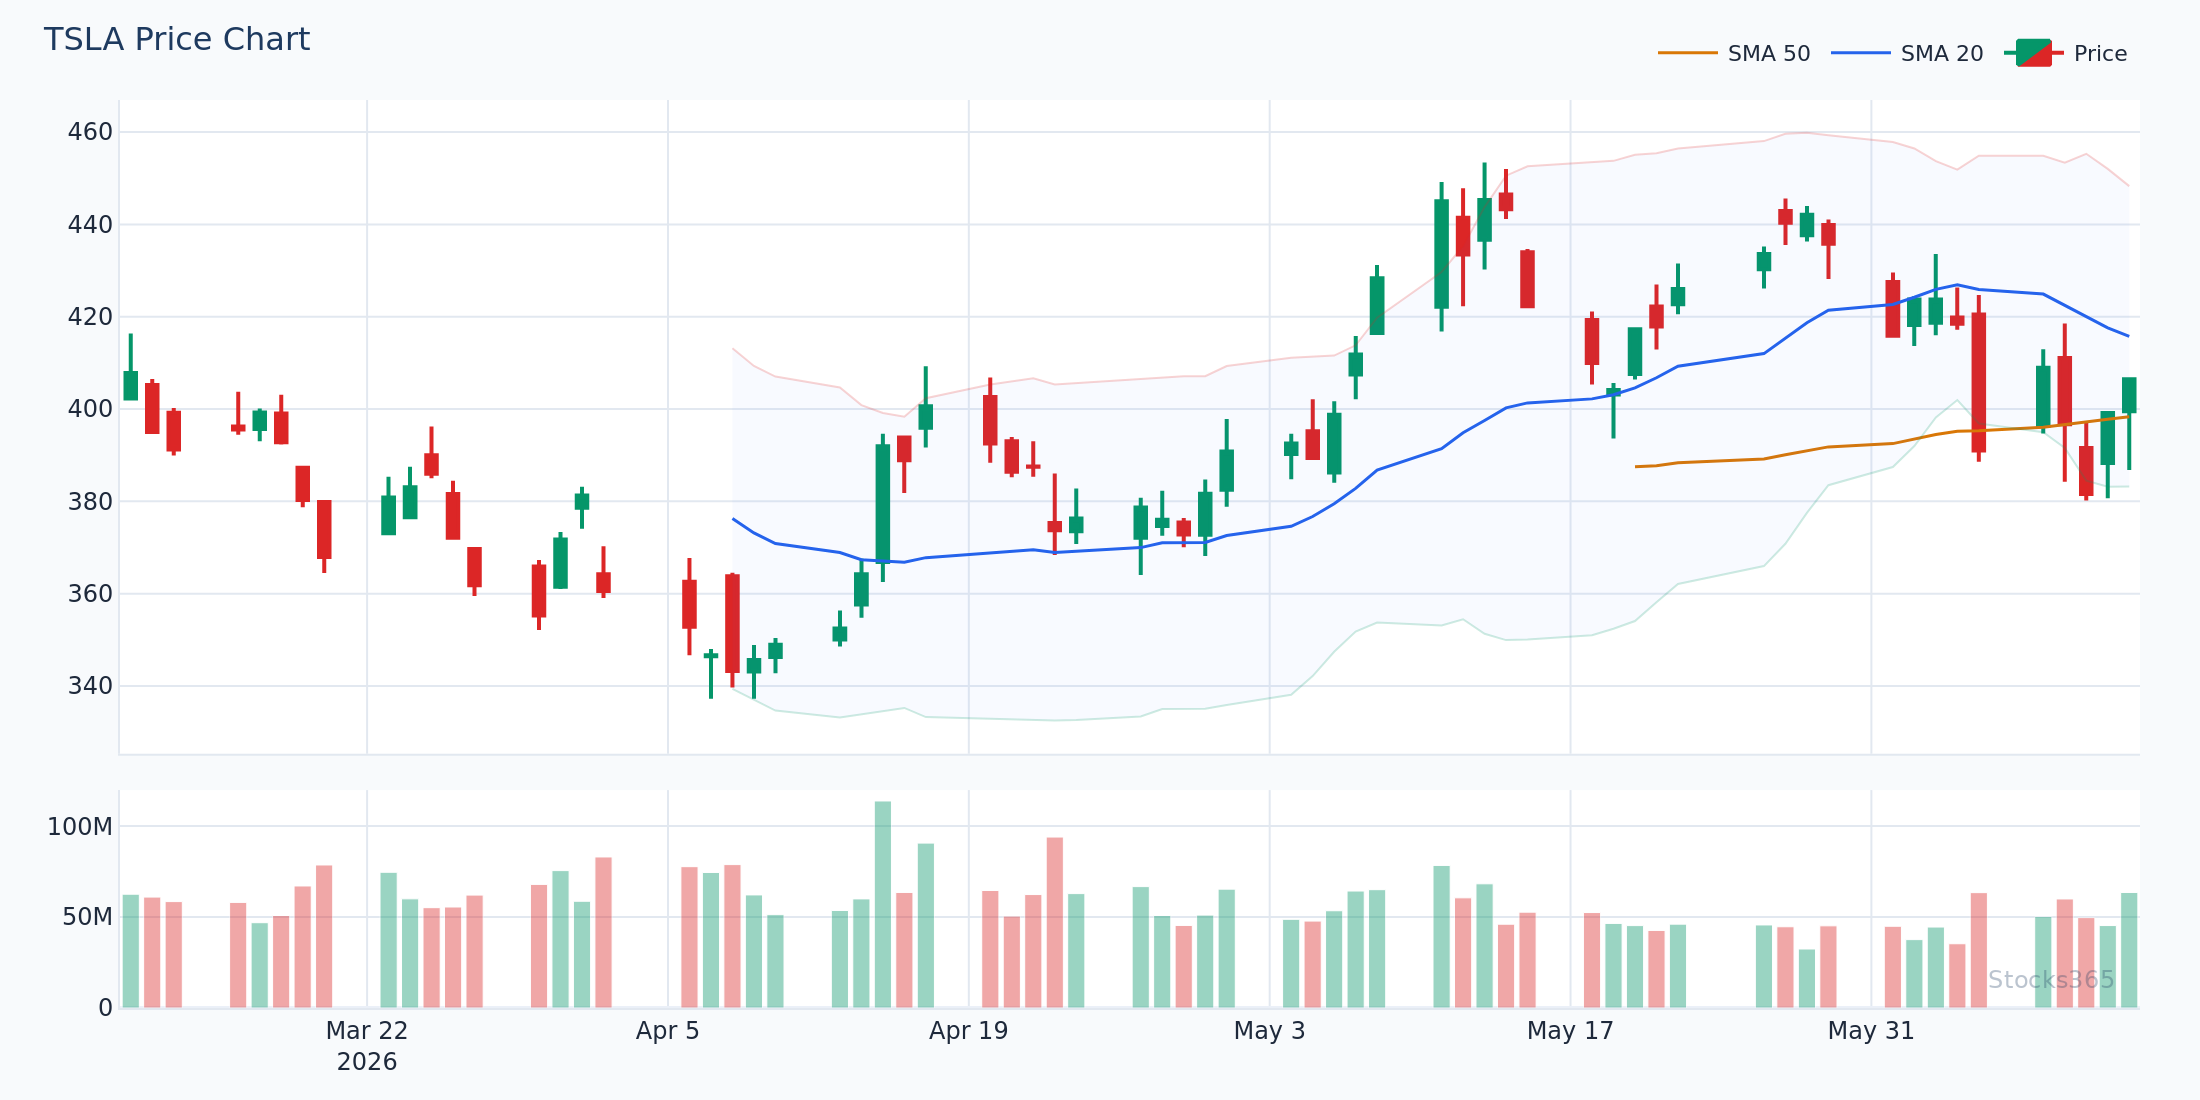
This TSLA example shows the complete mean reversion swing arc: price drops below the lower band on elevated volume, forms a bullish reversal candle, then spends four to six trading sessions grinding back toward the 20-SMA. The 20-SMA acts as a natural magnet in this scenario. If price stalls at the midpoint of the range rather than reaching the 20-SMA, that's a signal to tighten the stop — the mean reversion is losing steam earlier than expected.
When Bollinger Band Swing Setups Work — and When They Don't
Honest assessment of failure modes separates traders who last from those who blow up.
Mean reversion setups fail when:
- The market is in a strong directional trend — price walks along the outer band rather than snapping back.
- A major catalyst (earnings, macro event, policy announcement) drives the move to the band.
- Volume doesn't confirm the reversal candle — low-volume reversals fail at a much higher rate.
Squeeze breakout setups fail when:
- The breakout occurs on low volume — the move lacks conviction and reverses quickly.
- Broader market conditions are strongly opposed to the direction of the break.
- The breakout coincides with a news headline that is a one-day event rather than a trend driver.
Curious whether RSI-based signals hold up under rigorous testing? Our RSI Backtesting Results: Does RSI Actually Work? article breaks down real numbers — worth reading alongside this guide for a complete picture of momentum indicator edge.
No setup wins every time. The goal is consistent application of edge-positive setups with disciplined risk management.
Bollinger Bands and Market Regime Awareness
Regime matters more than most traders acknowledge. The same Bollinger Band setup produces very different outcomes in trending versus ranging markets.
A quick regime check before entering any Bollinger Band swing trade:
- Check the 200-SMA slope: Rising 200-SMA favors long-side mean reversion setups and bullish squeeze breakouts. Falling 200-SMA favors the opposite.
- Measure band width trend: Bands that have been expanding for several weeks signal trending conditions — mean reversion setups are riskier here.
- Assess the golden cross / death cross status: A recent 50/200 SMA crossover can signal a regime change that changes which setup is highest probability. Our guide on Golden Cross vs Death Cross: The Complete Market Guide covers regime identification in depth.
Align your setup with the regime. Don't fight the tape with a mean reversion trade in a screaming trend.
What to Watch For
- Bollinger Squeeze on daily charts where band width drops below the 20th percentile of its 52-week range — when compression is this extreme, the subsequent breakout frequently generates a 2-to-3 ATR move within 10 trading sessions. The breakout direction, confirmed by a high-volume close outside the bands, is your trade.
- Lower band touch on large-cap equities after a 10-to-15% pullback within an established uptrend — when RSI simultaneously drops below 35 and forms a bullish divergence, mean reversion swing trades back to the 20-SMA have historically produced strong risk-reward setups.
- Upper band walk on crypto after a squeeze breakout — when price consistently closes near the upper band for three or more consecutive sessions, the trend is strong. In this scenario, treat pullbacks to the 20-SMA as continuation entries rather than shorting the band touch.
- Band squeeze setups that coincide with Stochastic reaching oversold on both %K and %D lines — when the squeeze resolves upward with this momentum alignment in place, the setup carries additional confirmation weight, particularly in equities and crypto.
- Consecutive lower band penetrations without price recovery — when price breaks below the lower band multiple sessions in a row, mean reversion is failing. This is a sign of genuine selling pressure, not an oversold bounce opportunity. Step aside and wait for stabilization before re-engaging.
How Stocks365 Uses This
Stocks365 Trust Score Integration
Bollinger Band signals are one of 12+ indicators integrated into the Stocks365 Trust Score system. Band position and band width contribute to both the volatility regime and signal agreement components of the score. When a stock's price touches the lower Bollinger Band while the Trust Score registers high agreement across multiple momentum and trend indicators, the system flags a higher-conviction swing setup. Squeeze conditions — identified by band width dropping below a defined percentile threshold — trigger a separate volatility scoring component that adjusts signal weighting accordingly.
You can see Trust Scores for individual equities directly on signal pages like /signal/AAPL, or scan the full Stocks365 signals dashboard to filter for stocks currently in Bollinger squeeze or band-touch configurations.
Key Takeaways
- Two core setups: The Bollinger Squeeze Breakout (trend continuation) and Band Touch Mean Reversion are the primary swing trading frameworks from this indicator.
- Volume is the gatekeeper: Every valid Bollinger Band swing setup requires volume confirmation. Low-volume band touches and breakouts fail at significantly higher rates.
- Confluence beats single signals: Combining Bollinger Bands with RSI and/or Stochastic dramatically improves setup quality — wait for two or three aligned signals before entering.
- Regime first, setup second: Identify whether you're in a trending or ranging market before choosing your setup. Mean reversion works in ranges; breakout continuation works in trends.
- Asset class matters: Our backtesting shows crypto outperforms commodities significantly on Bollinger Band setups across multiple configurations — factor this into your instrument selection.
- The 20-SMA is your anchor: In both setups, the center band acts as the key reference point — for profit targets in mean reversion and as a trailing stop guide in breakout trades.
- Trust Score integration: Use the Stocks365 platform to quickly identify stocks where Bollinger Band conditions align with broader multi-indicator agreement.