
Bollinger Bands vs Price Envelopes: The Channel Indicator Showdown
Two tools. One job. Both draw channels around price. But Bollinger Bands and price envelopes work in fundamentally different ways — and choosing the wrong one for your strategy is a mistake that quietly bleeds your account.
This guide cuts through the confusion. You'll understand the mechanics, the real-world setups, and exactly when each tool earns its place on your chart.
What Are Bollinger Bands? The Volatility-Adaptive Channel
Bollinger Bands, developed by John Bollinger in the 1980s, are built on a simple but powerful idea: let the market define its own boundaries. The indicator plots three lines — a middle band (typically a 20-period simple moving average), an upper band (middle + 2 standard deviations), and a lower band (middle − 2 standard deviations).
The key word is standard deviation. When volatility spikes, the bands expand. When the market quiets down, the bands contract. The channel breathes with the market.
This self-adjusting quality is Bollinger Bands' greatest strength. A 2-standard-deviation envelope statistically contains roughly 95% of all price action under normal distribution assumptions — though markets are fat-tailed, so real containment is closer to 88–92% of the time.
Default Bollinger Band Settings
- Period: 20 (simple moving average)
- Standard deviations: 2.0
- Applied to: closing prices (most common)
Traders adjust these. Shorter periods (10–14) make bands more reactive. Using 2.5 standard deviations reduces false signals in trending markets. The settings you choose define your edge — or your weakness.
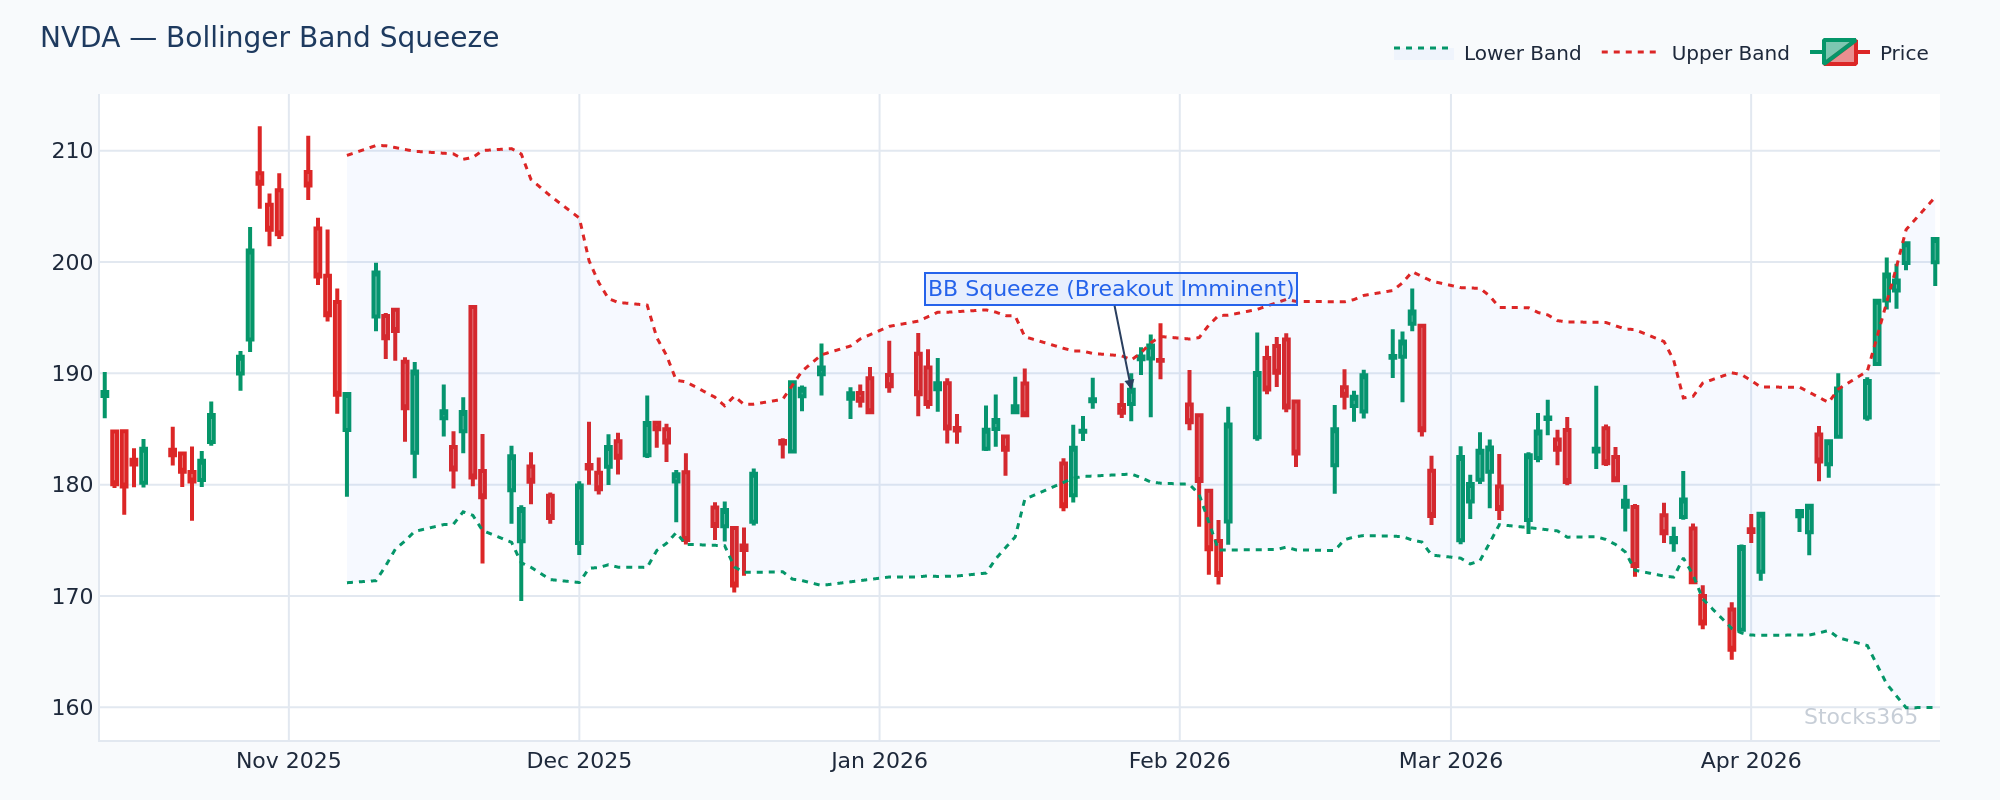
This chart shows NVDA's Bollinger Bands narrowing to historically tight width — a classic squeeze setup. When band width compresses below recent lows, the market is coiling energy. The breakout direction isn't guaranteed yet; watch for a candle close outside the band on above-average volume to confirm direction. A failed break that reverses back inside the bands is a strong counter-signal worth fading.
What Are Price Envelopes? The Fixed-Percentage Channel
Price envelopes are simpler. Brutally simple, actually. You take a moving average and shift it up and down by a fixed percentage. That percentage never changes regardless of what the market is doing.
If you set a 5% envelope around a 20-period SMA, the upper band is always exactly 5% above the SMA, and the lower band is always exactly 5% below it. In a low-volatility period, price might barely touch those bands. In a high-volatility period, price blows straight through them.
Default Price Envelope Settings
- Period: 20 (moving average)
- Percentage shift: 2–5% (varies by asset class)
- Moving average type: SMA or EMA
The envelope percentage needs to be calibrated to each instrument. A 2% envelope on a low-volatility blue-chip stock might work well. That same 2% on Bitcoin is meaningless — crypto regularly moves 5–10% in a single session.
Envelopes are fixed. The market is not. That mismatch is both the tool's limitation and, in certain contexts, its strength.
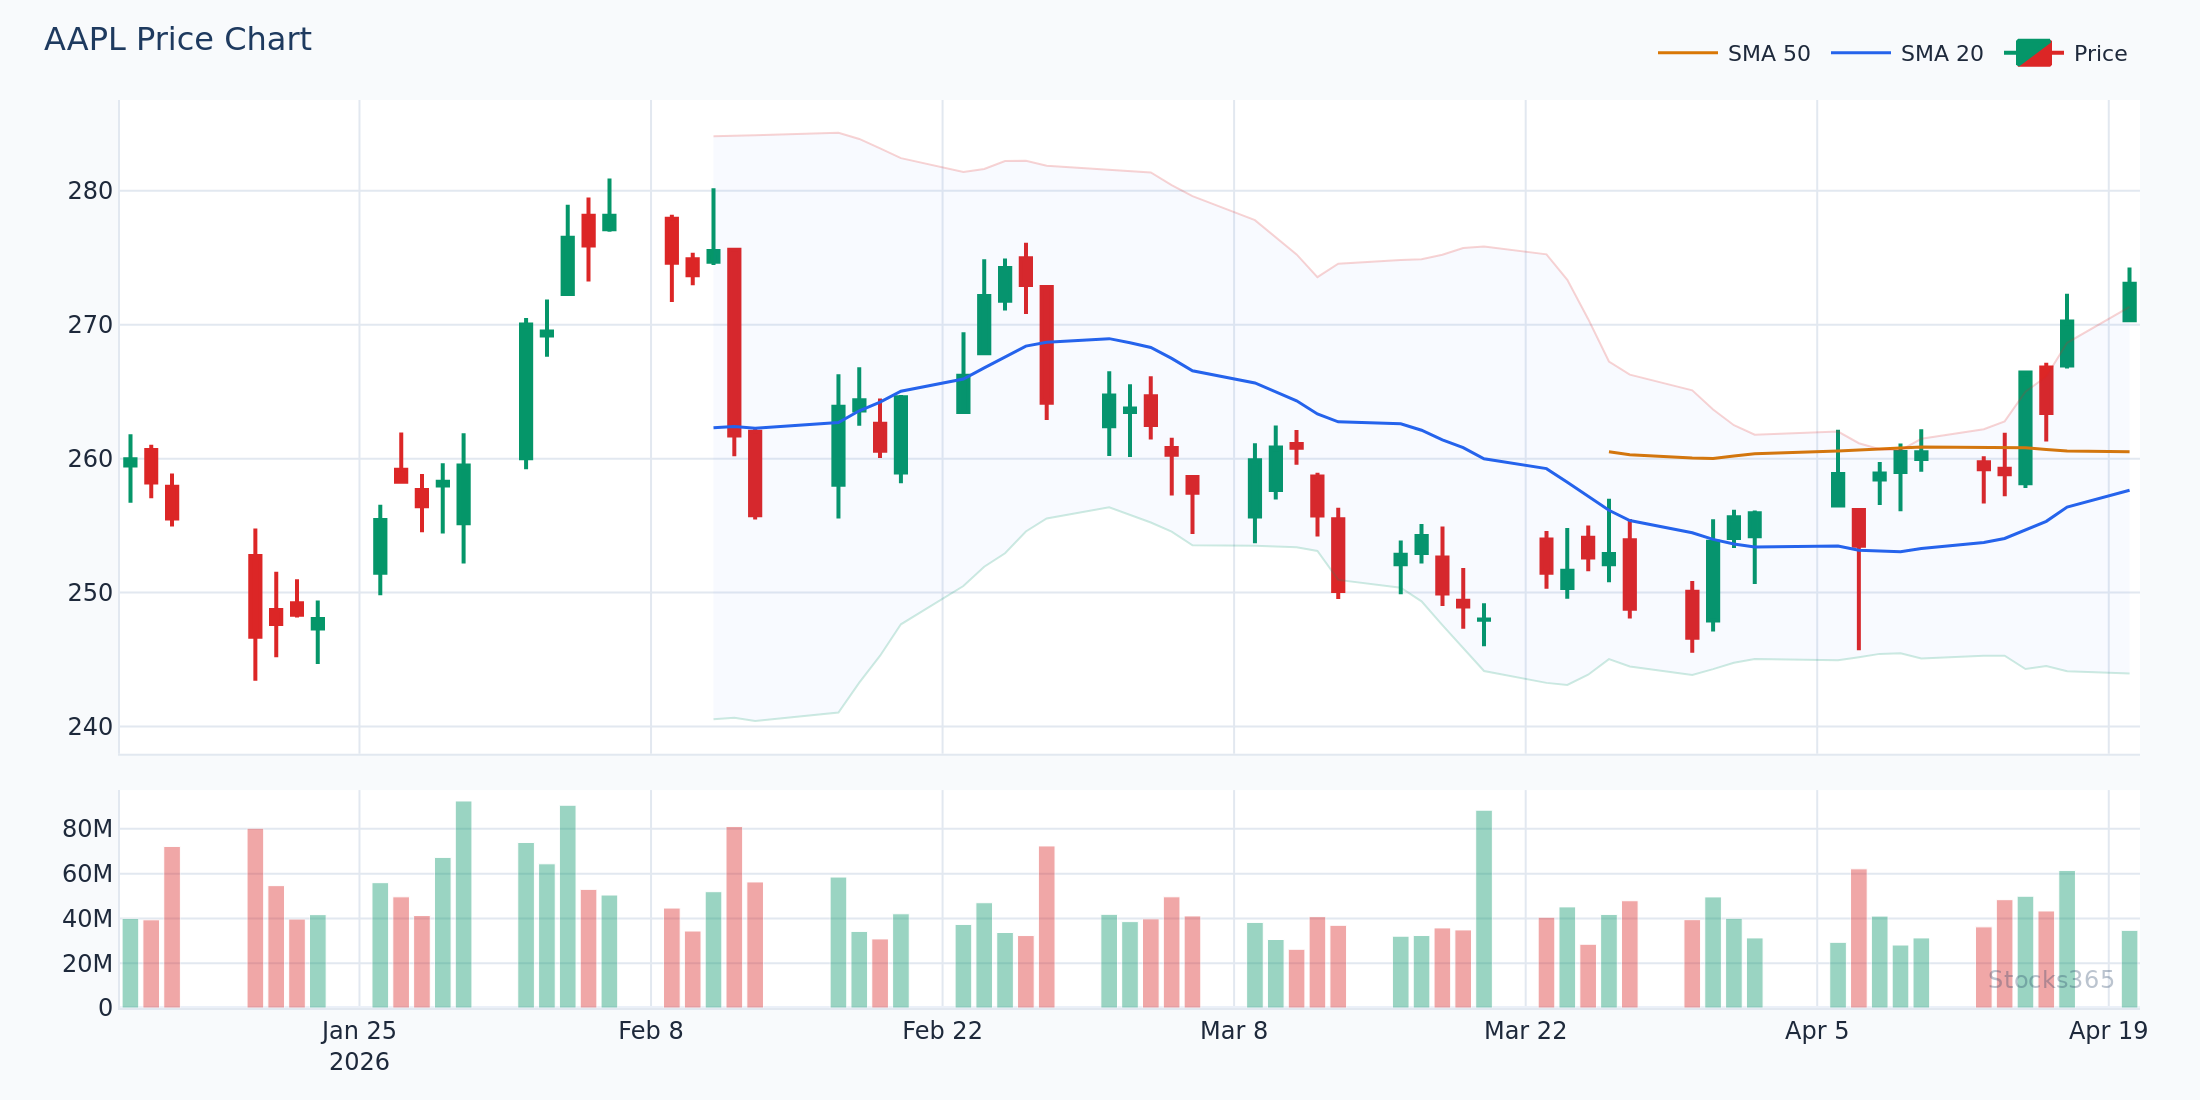
Here, AAPL's price is shown with a 2.5% envelope around the 20-SMA. Notice how price repeatedly touches the lower envelope and reverts toward the middle line — the textbook mean reversion setup envelopes are designed to catch. This pattern holds most cleanly during range-bound, low-trend periods. When AAPL enters a sustained trend phase, watch for the envelope to stop containing price on one side, which signals that the trend trade, not the mean reversion trade, is the higher-probability play.
Bollinger Bands vs Price Envelopes: The Core Differences
Here's where most traders get confused. Both tools look similar on a chart. But they measure completely different things.
| Feature | Bollinger Bands | Price Envelopes |
|---|---|---|
| Band width | Dynamic (volatility-based) | Fixed percentage |
| Volatility signal | Yes — band width = volatility measure | No — static spacing |
| Calculation complexity | Moderate (requires std dev) | Simple (percentage offset) |
| Best for | Volatility breakouts, squeezes | Mean reversion in defined ranges |
| Calibration needed | Minimal — self-adjusting | High — must match asset volatility |
Here's What Most Traders Get Wrong
Most traders treat a Bollinger Band touch as an automatic reversal signal. They see price tag the upper band and immediately think "overbought, time to sell." But in a strong trending market, price can ride the upper band for days — sometimes weeks. The upper band touch in a trend isn't a reversal signal; it's a momentum confirmation. The real edge isn't the touch itself. It's watching for price to fail at the upper band — meaning it touches but closes back inside, often with a bearish candle pattern — that's the actual reversal cue.
The same trap exists with envelopes. A fixed 3% envelope that worked perfectly on a stock during a quiet range-bound month becomes useless the moment that stock enters an earnings-driven trend. Always verify the regime before trusting the channel.
When Bollinger Bands Have the Edge
The Squeeze Breakout Setup
The Bollinger Squeeze is one of the most respected setups in technical analysis — and for good reason. When the bands contract sharply, volatility has compressed. Markets don't stay quiet forever. The squeeze identifies the pause before the storm.
The classic entry: band width drops to multi-month lows, price consolidates in a tight range, then breaks out with a strong candle close beyond the band. Volume confirmation — ideally 1.5x to 2x average volume — adds conviction to the signal.
Stocks365 research across 14,266 signals found that Bollinger Squeeze Breakouts carry a profit factor of 1.03 over a 10-day holding period — the only pure Bollinger signal in our dataset that crosses the 1.0 threshold. Performance was strongest in crypto (51.8% win rate) and weakest in forex (47.1%). See the full dataset at /insights.
That profit factor distinction matters. A profit factor above 1.0 means the strategy generates more gross profit than gross loss. It's not a large edge — but it's a real one. The squeeze breakout is the scenario where Bollinger Bands most consistently earn their keep.
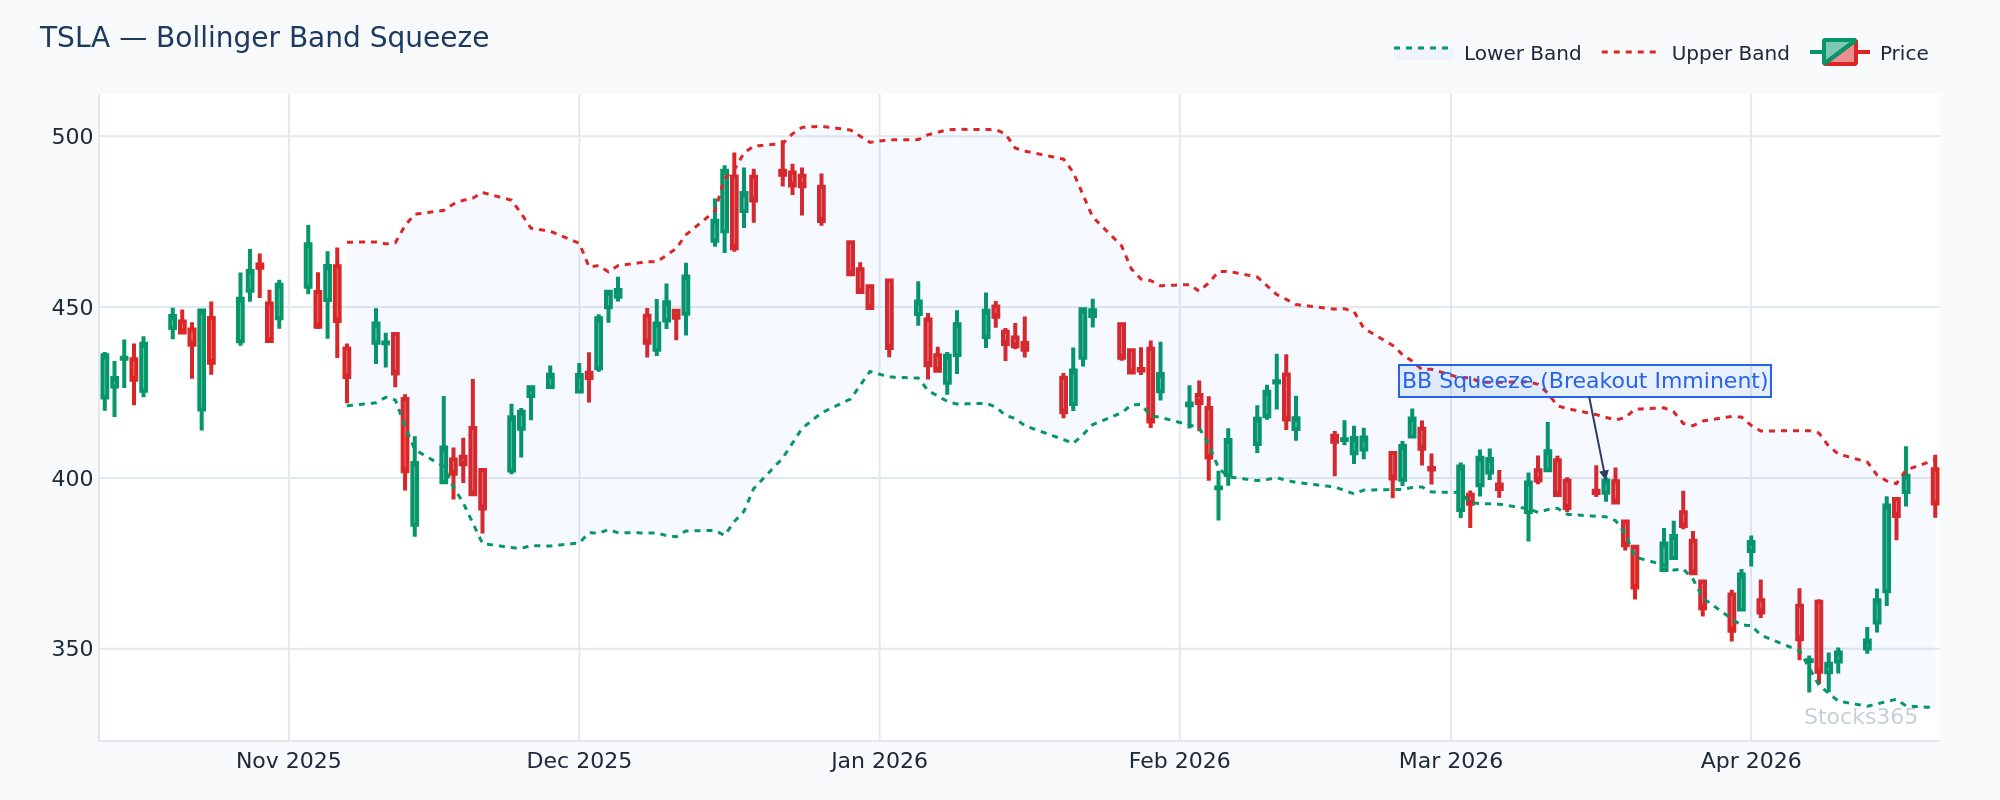
TSLA's bands show classic squeeze compression here — the upper and lower bands are closer together than they've been in weeks. This coiling pattern often precedes the sharpest directional moves. The next confirmed candle close outside the band with elevated volume sets the trade direction. A close back inside the bands without follow-through invalidates the breakout thesis and frequently produces a sharp reversal.
Combining Bollinger Bands With RSI
Bollinger Bands work well as a standalone volatility tool, but pairing them with momentum indicators sharpens the signal. When price touches the lower Bollinger Band and RSI drops into oversold territory, the confluence of two independent signals — price at a statistical extreme and momentum exhausted — creates a higher-quality mean reversion setup than either indicator alone.
For trend confirmation, watch for price to walk the upper Bollinger Band while RSI holds above 50 (and especially above 60). This dual confirmation identifies momentum-driven moves worth riding rather than fading. If you're new to RSI mechanics, the complete RSI beginner's guide covers the foundation you need before combining it with channel tools.
Setting RSI periods correctly matters here too. For shorter-term Bollinger Band setups on the daily chart, an RSI period of 9–14 keeps momentum readings reactive enough to align with band touches.
When Price Envelopes Have the Edge
Range-Bound Markets and Mean Reversion
Price envelopes shine in one specific scenario: stable, range-bound markets where volatility is consistently low and predictable. Think large-cap dividend stocks in low-volatility macro environments, or index ETFs during quiet consolidation phases.
In these conditions, a well-calibrated envelope works beautifully. Price touches the upper envelope, stalls, reverts to the middle MA. Price touches the lower envelope, bounces back. The fixed-percentage channel becomes a reliable map of the range's extremes.
The setup is clean: wait for price to tag the envelope boundary, look for a rejection candle (pin bar, engulfing pattern), then enter toward the mean. Risk is defined at the envelope boundary. Target is the center SMA or the opposite envelope.
Calibrating Envelope Percentages by Asset Class
Fixed-percentage channels need to be tuned. Here are general starting points — though always backtest for the specific instrument you're trading:
- Large-cap equities (low volatility): 2–3% envelope
- Mid-cap / growth stocks: 4–6% envelope
- Major forex pairs: 0.5–1% envelope
- Commodities: 3–5% envelope
- Crypto (major): 8–15% envelope
Getting this wrong destroys the signal entirely. A 2% envelope on Bitcoin produces constant false touches during normal market movement. Garbage in, garbage out.
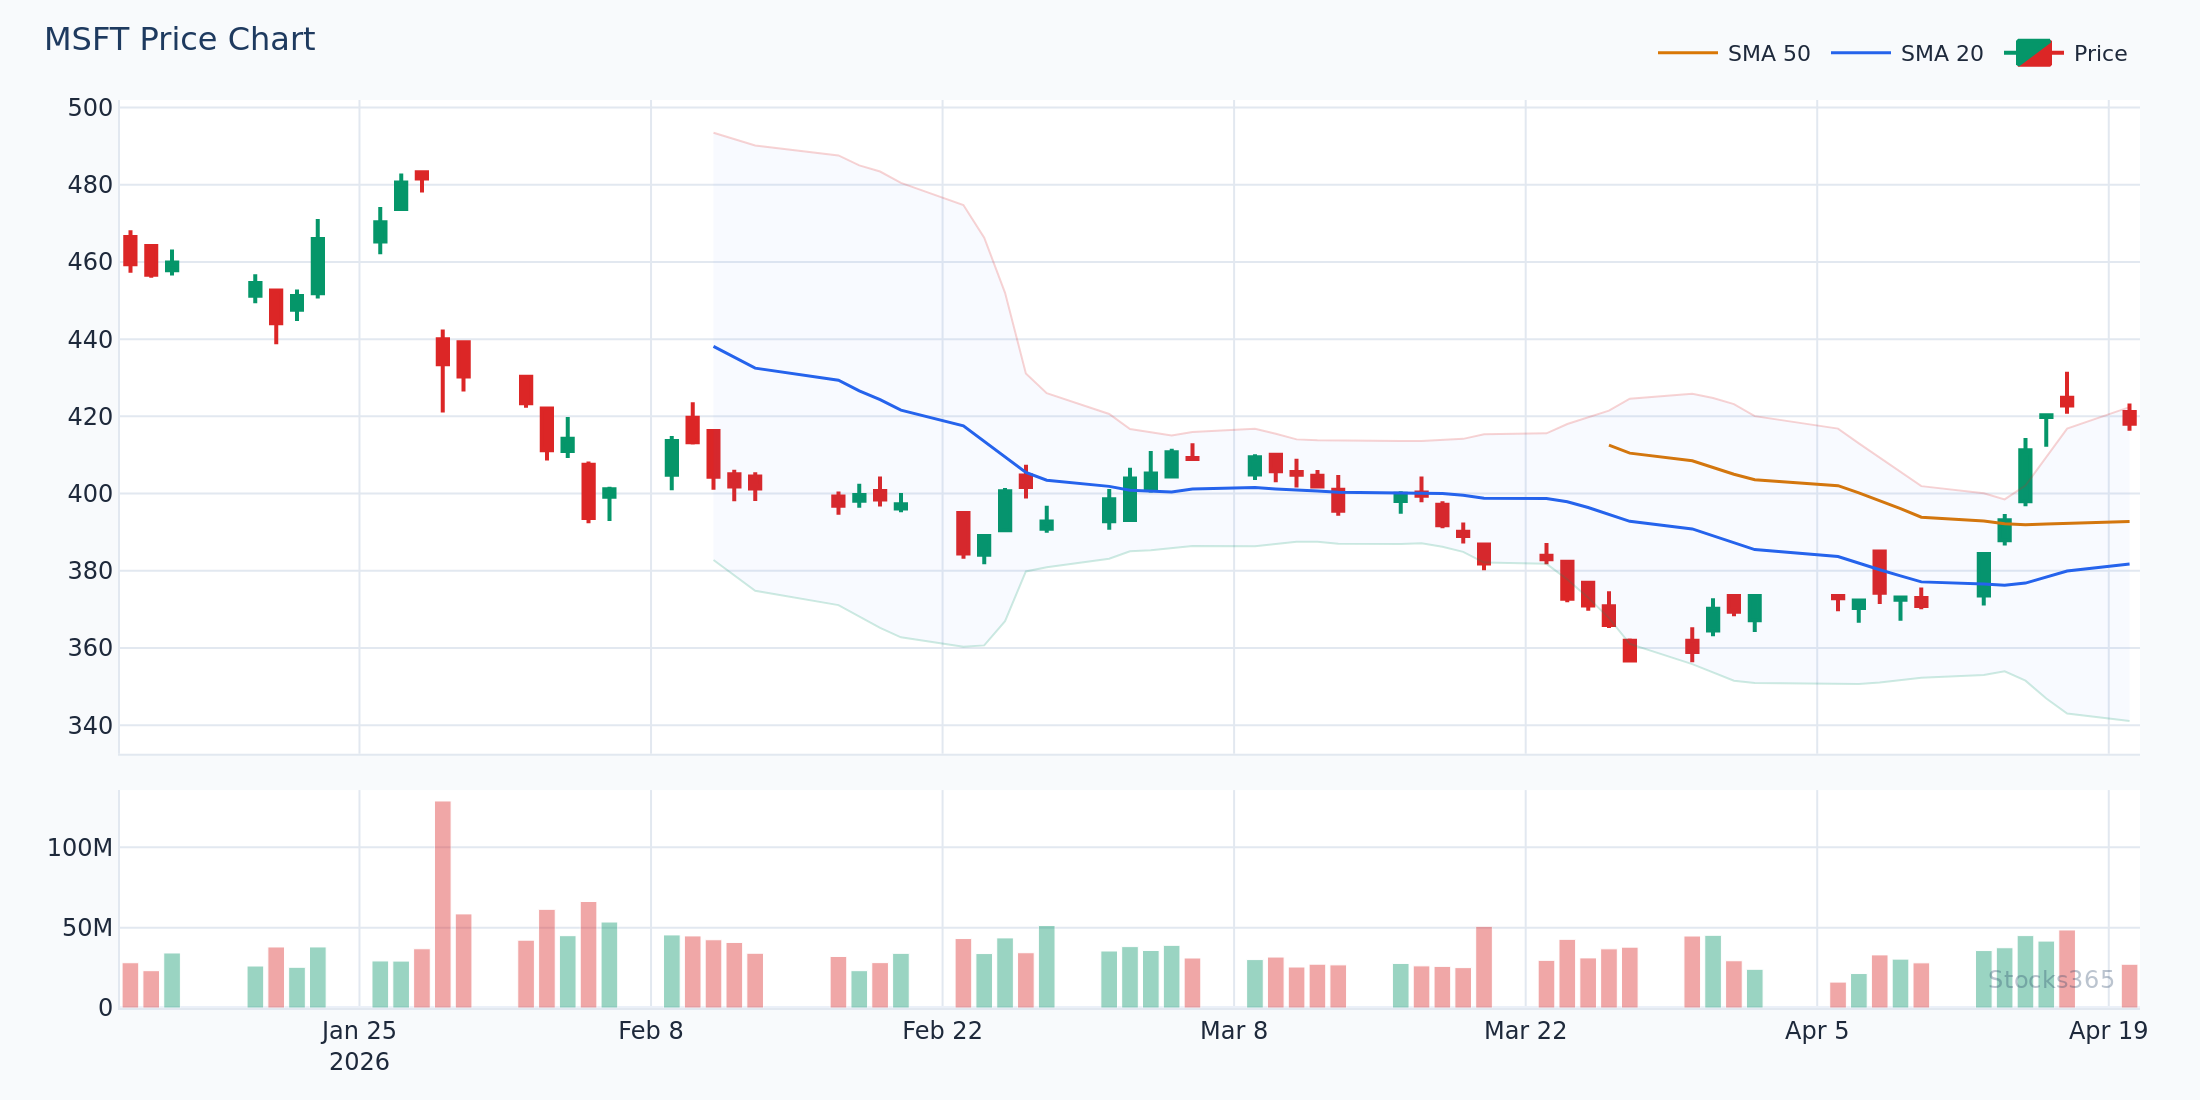
MSFT's price action here illustrates an envelope mean reversion cycle — touching the upper boundary, pulling back to the SMA, and then testing the lower boundary over a multi-week period. This type of setup typically plays out most cleanly when price is below the 50-SMA slope threshold (i.e., no strong trend in either direction). A strong trending candle that closes well outside the envelope and fails to reverse within two sessions signals that the range has broken and the mean reversion playbook needs to be shelved.
Head-to-Head: Which Tool Wins by Market Condition?
Trending Markets
Bollinger Bands win here. Their dynamic width adapts to expanding volatility in trends. Price walking the upper band in an uptrend is a feature, not a problem — the bands expand to accommodate it. Envelopes get blown out in trending conditions and generate constant false reversal signals.
Range-Bound Markets
Envelopes can edge ahead. When volatility is stable and predictable, fixed-percentage channels are easier to calibrate and trade. Bollinger Bands still work in ranges, but their dynamic width sometimes makes band touches less precise as entry triggers.
Volatility Breakouts
Bollinger Bands win decisively. The squeeze mechanism is unique to Bollinger Bands. Envelopes have no equivalent volatility-compression signal. This is arguably Bollinger Bands' single biggest functional advantage.
Simplicity and Consistency
Envelopes have an edge for rule-based systems. Fixed-percentage bands don't change their character. A systematic trader building a rules-based backtest may prefer envelopes precisely because they don't self-adjust — the parameters stay constant, which makes strategy behavior more predictable over time.
The Ugly Truth About Band Touches
Both tools create a psychological trap. When price tags a band boundary, it looks like a trade. The visual appeal of price at an extreme is powerful. But band touches alone aren't edge.
Our analysis of 3,255 Bollinger Upper Band Touch signals shows a 49.6% win rate with a profit factor of 0.88 over a 10-day holding period. That's a losing strategy on its own — the gross losses outweigh the gross gains. The best performance came from crypto assets (56.7% win rate), while commodities were the weakest (41.5%). See the complete breakdown at /insights.
A profit factor of 0.88 means you lose money over time trading every upper band touch mechanically. The signal needs filtering. Add a momentum filter — like waiting for RSI divergence to form at the band touch — and the numbers improve. Add a volume filter. Add a pattern filter. The band touch is a condition to watch, not a trigger to act on blindly.
This is why context always beats mechanical rules. Always.
Combining Both Tools: A Practical Approach
Some traders run both simultaneously — and it's not as redundant as it sounds. Here's one approach:
- Use Bollinger Bands (20, 2.0) as the primary volatility and trend regime indicator
- Use a price envelope (20-EMA, fixed %) as a secondary filter for extreme readings
- When price is outside the Bollinger Band and outside the price envelope simultaneously, the signal is at a genuine statistical extreme — worthy of a closer look
- Add RSI confirmation at these confluence points to complete the entry checklist
This dual-channel approach removes a lot of marginal trades and focuses attention on the highest-conviction setups. Fewer trades. Better quality.
For traders interested in going further with momentum confirmation, understanding how RSI compares to the Stochastic Oscillator is worth your time — both are used regularly alongside channel tools to filter band touches.
What to Watch For
- Bollinger squeeze breakouts on high-momentum stocks: When Bollinger Band width compresses below its 20th percentile on a stock with strong relative strength, the subsequent expansion move often travels 2–3 ATR. The direction confirmation comes from the first strong close outside the band. Watch for this setup in NVDA, TSLA, and leading semiconductor names — see live signals at /signal/NVDA.
- Price envelope bounces on large-cap equities in low-VIX regimes: When the broader market volatility index is depressed, fixed-percentage envelope reversals on large-cap stocks tend to be cleaner and faster. Watch for a lower-envelope touch followed by a bullish engulfing candle on above-average volume as the entry trigger.
- Bollinger Band upper-band walk in trending crypto: During confirmed crypto uptrends, price riding the upper Bollinger Band without reverting to the mean is a momentum continuation signal — not a reversal setup. Only start fading when price closes back inside the band after a multi-candle ride.
- Divergence at envelope extremes: When price tags the outer envelope boundary but momentum (RSI or MACD) fails to confirm a new high or low, hidden divergence forms. These confluence points between envelope extremes and momentum divergence produce some of the most reliable mean reversion setups.
- Band width as regime filter: Before trading either tool, check Bollinger Band width relative to its 52-week range. Narrow band width (bottom 20th percentile) = volatility breakout regime — favor Bollinger Bands and squeeze setups. Wide band width (top 20th percentile) = post-expansion cooling — favor envelope mean reversion plays.
How Stocks365 Uses This
How Stocks365 Integrates Bollinger Bands and Channel Analysis
Stocks365's trust score system evaluates each signal across 12+ independent technical indicators. Bollinger Band analysis contributes directly to two scoring dimensions: volatility regime scoring and indicator agreement scoring.
For volatility regime, the platform tracks Bollinger Band width percentile in real time. When band width is in the bottom 20th percentile (squeeze zone), the system flags the asset as being in a pre-breakout volatility regime — adjusting signal weighting accordingly. Breakout signals in squeeze regimes receive elevated weighting; mean reversion signals receive reduced weighting in the same condition.
For indicator agreement, Bollinger Band touches are cross-referenced with RSI levels, volume, and trend direction before contributing to the overall trust score. A lower band touch with RSI below 30 and above-average volume generates a high-agreement mean reversion score. A lower band touch in a downtrending market with RSI still above 40 generates a low-agreement score — and the trust score reflects that uncertainty.
The Stocks365 signals dashboard applies this multi-layer validation automatically, so you see only setups where multiple indicators agree — not raw band touches that look appealing but lack confirmation. You can explore live Bollinger-based signals on individual stocks like AAPL or TSLA directly from the dashboard.
Key Takeaways
- Bollinger Bands are volatility-adaptive — they expand and contract with market conditions, making them superior for breakout and squeeze setups.
- Price envelopes use fixed percentage offsets — they work best in stable, range-bound conditions when calibrated precisely to the asset's typical volatility.
- Bollinger Band touches alone are not edge. Our data across 3,255 signals shows a profit factor of just 0.88 for mechanical upper-band touch trades. Filtering is essential.
- The Bollinger Squeeze breakout is the standout signal — the only Bollinger-based setup in Stocks365's dataset with a profit factor above 1.0 (1.03 across 14,266 signals).
- Use Bollinger Bands in trending and volatile markets. Use envelopes in quiet, range-bound markets after calibrating the percentage to the specific instrument.
- Both tools improve significantly when combined with momentum indicators like RSI — confluence signals outperform single-indicator setups across all market conditions.
- Band width is a regime indicator in itself — always check whether you're in a squeeze (low width) or expansion (high width) regime before selecting your channel trading approach.