
Bollinger Bands vs Keltner Channels: Which Volatility Indicator Actually Works?
Two indicators. One job: measure volatility and identify price extremes. Bollinger Bands and Keltner Channels are both envelope-style tools that wrap around price — but they use completely different math, behave differently in trending markets, and generate signals at different times. Choosing the wrong one for your setup costs you edge.
This guide breaks down exactly how each indicator works, where each excels, and — critically — when combining them unlocks setups that neither produces alone.
Stocks365 backtested 14,266 Bollinger Squeeze Breakout signals across equities, crypto, forex, and commodities and found a 49.5% win rate with a profit factor of 1.03 over a 10-day holding period. The edge isn't in the win rate — it's in identifying which asset class and which market regime the squeeze fires in. That distinction is everything. Explore the full methodology on our research dashboard.
What Are Bollinger Bands? A Quick Primer
John Bollinger introduced Bollinger Bands in the early 1980s. The construction is straightforward: a middle band (typically a 20-period simple moving average), an upper band set at 2 standard deviations above the SMA, and a lower band set at 2 standard deviations below.
The key word is standard deviation. Bollinger Bands are adaptive. When price volatility expands, the bands widen automatically. When volatility contracts, the bands tighten. This makes them a dynamic volatility measure, not a fixed channel.
For a deep dive into the math driving this indicator, see How Bollinger Bands Work: Master the Math Behind It. For actionable entry and exit signals, Bollinger Bands Buy and Sell Signals Explained: Master Guide covers every major setup.
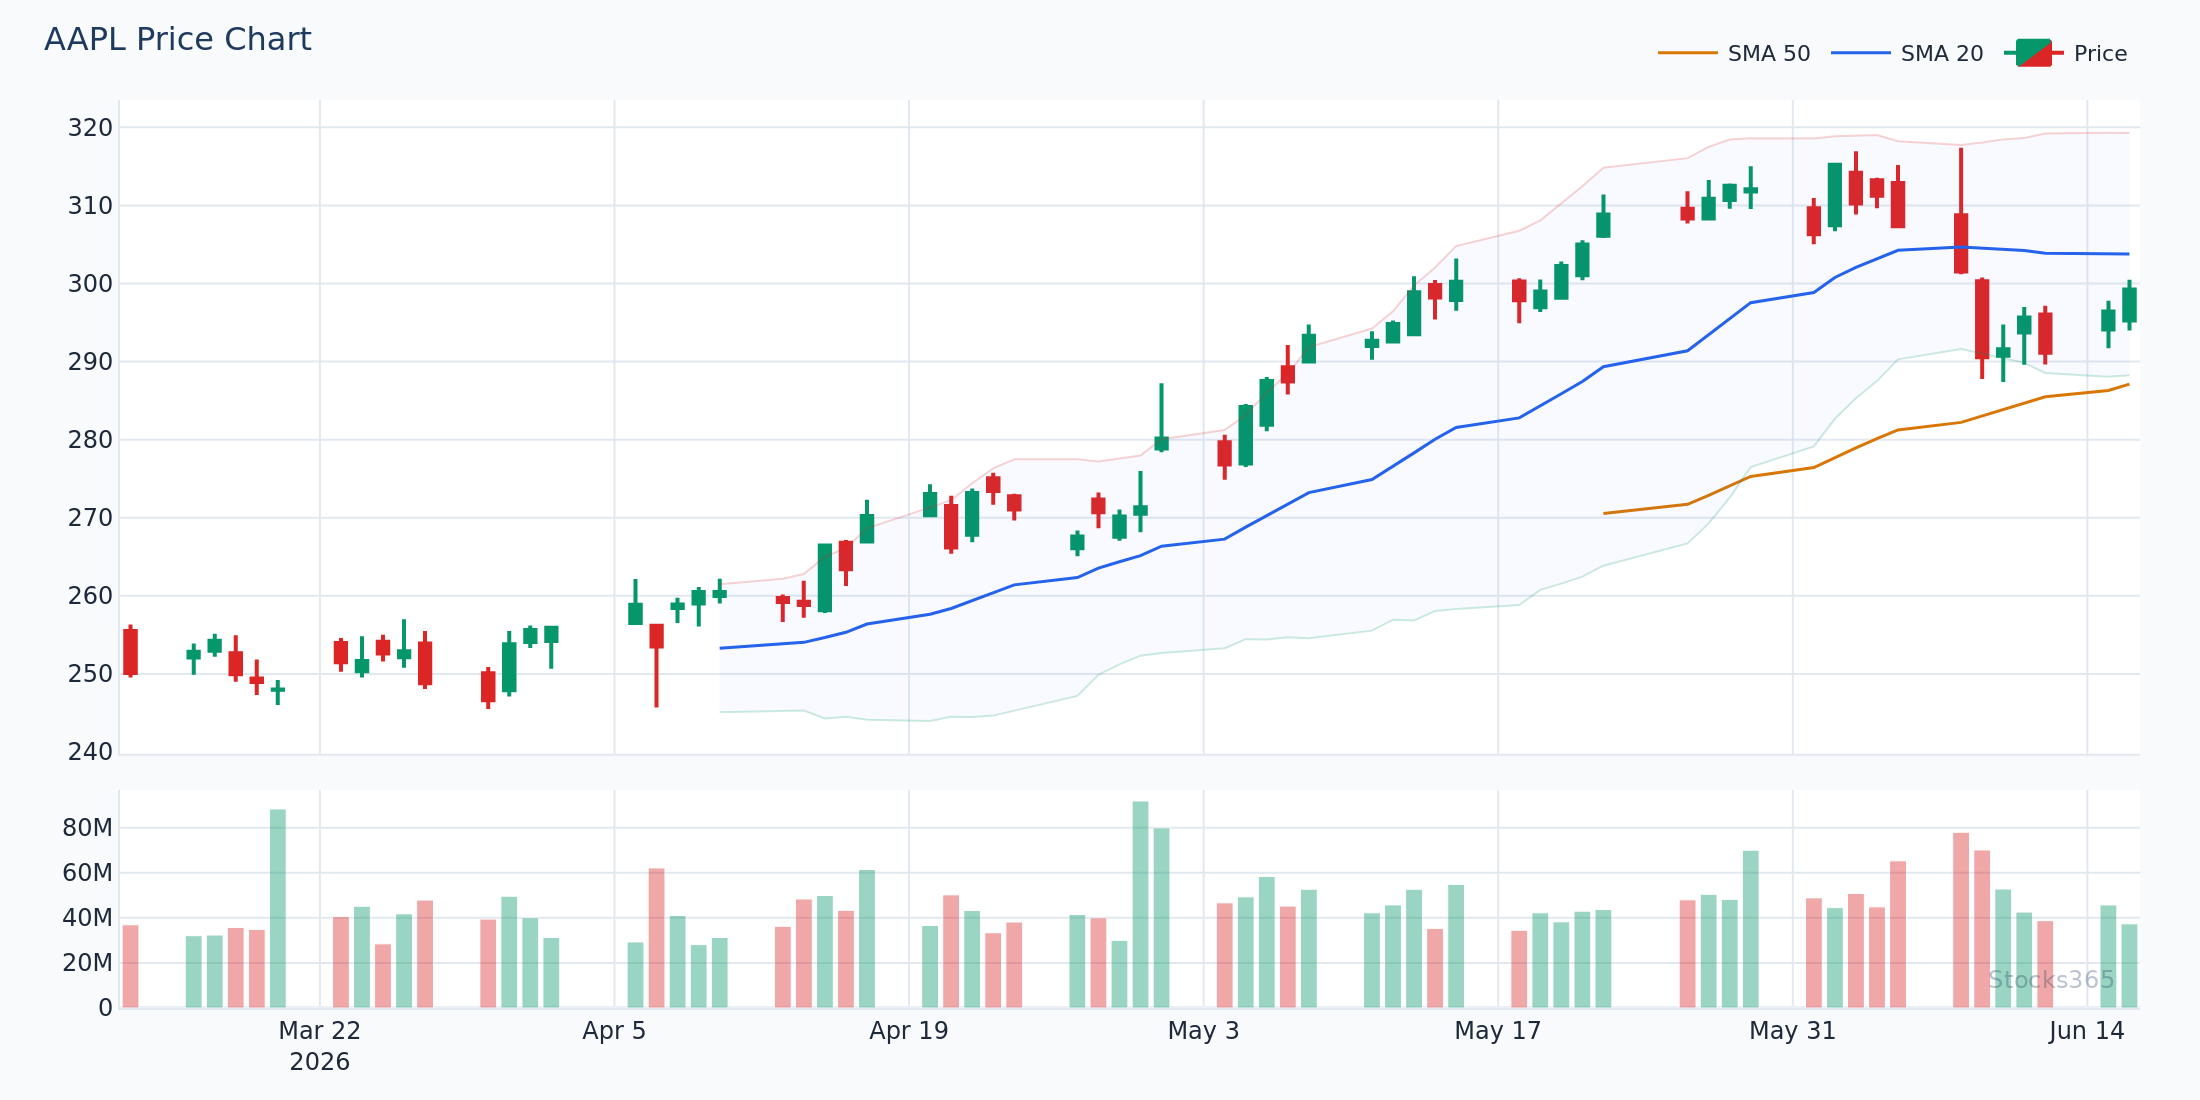
This chart shows price oscillating between the upper and lower Bollinger Bands with the 20-SMA acting as a dynamic mean. When price tags the upper band after a prolonged contraction period, watch for either a reversal back to the midline or a breakout continuation — the volume profile at that touch determines which scenario plays out. A high-volume upper band touch with rising RSI confirms continuation. Low volume with diverging RSI signals a fade setup.
What Are Keltner Channels? Key Differences Explained
Keltner Channels use a different volatility measure entirely: Average True Range (ATR). The structure is similar on the surface — a middle line (usually a 20-period Exponential Moving Average) with upper and lower bands — but the bands are set at a fixed multiple of ATR, typically 2x ATR.
Because ATR is based on true range (not standard deviation), Keltner Channels respond to absolute price movement, not relative dispersion. This makes the channels smoother and less reactive to sudden volatility spikes.
The practical difference: Bollinger Bands can expand dramatically after a single explosive candle. Keltner Channels absorb that spike more gradually. In trending markets, price rides outside Keltner Channels for extended periods — which Bollinger Bands rarely allow.
Construction Comparison: Bollinger Bands vs Keltner Channels
- Middle Line: Bollinger Bands use a 20-SMA; Keltner Channels use a 20-EMA
- Band Calculation: Bollinger Bands use ±2 standard deviations; Keltner Channels use ±2x ATR
- Volatility Sensitivity: Bollinger Bands react immediately to volatility spikes; Keltner Channels smooth them out
- Trending Markets: Price can ride outside Keltner Channels in strong trends; Bollinger Band touches tend to revert
- Mean Reversion Signals: Bollinger Bands are better suited; Keltner Channels excel in trend confirmation
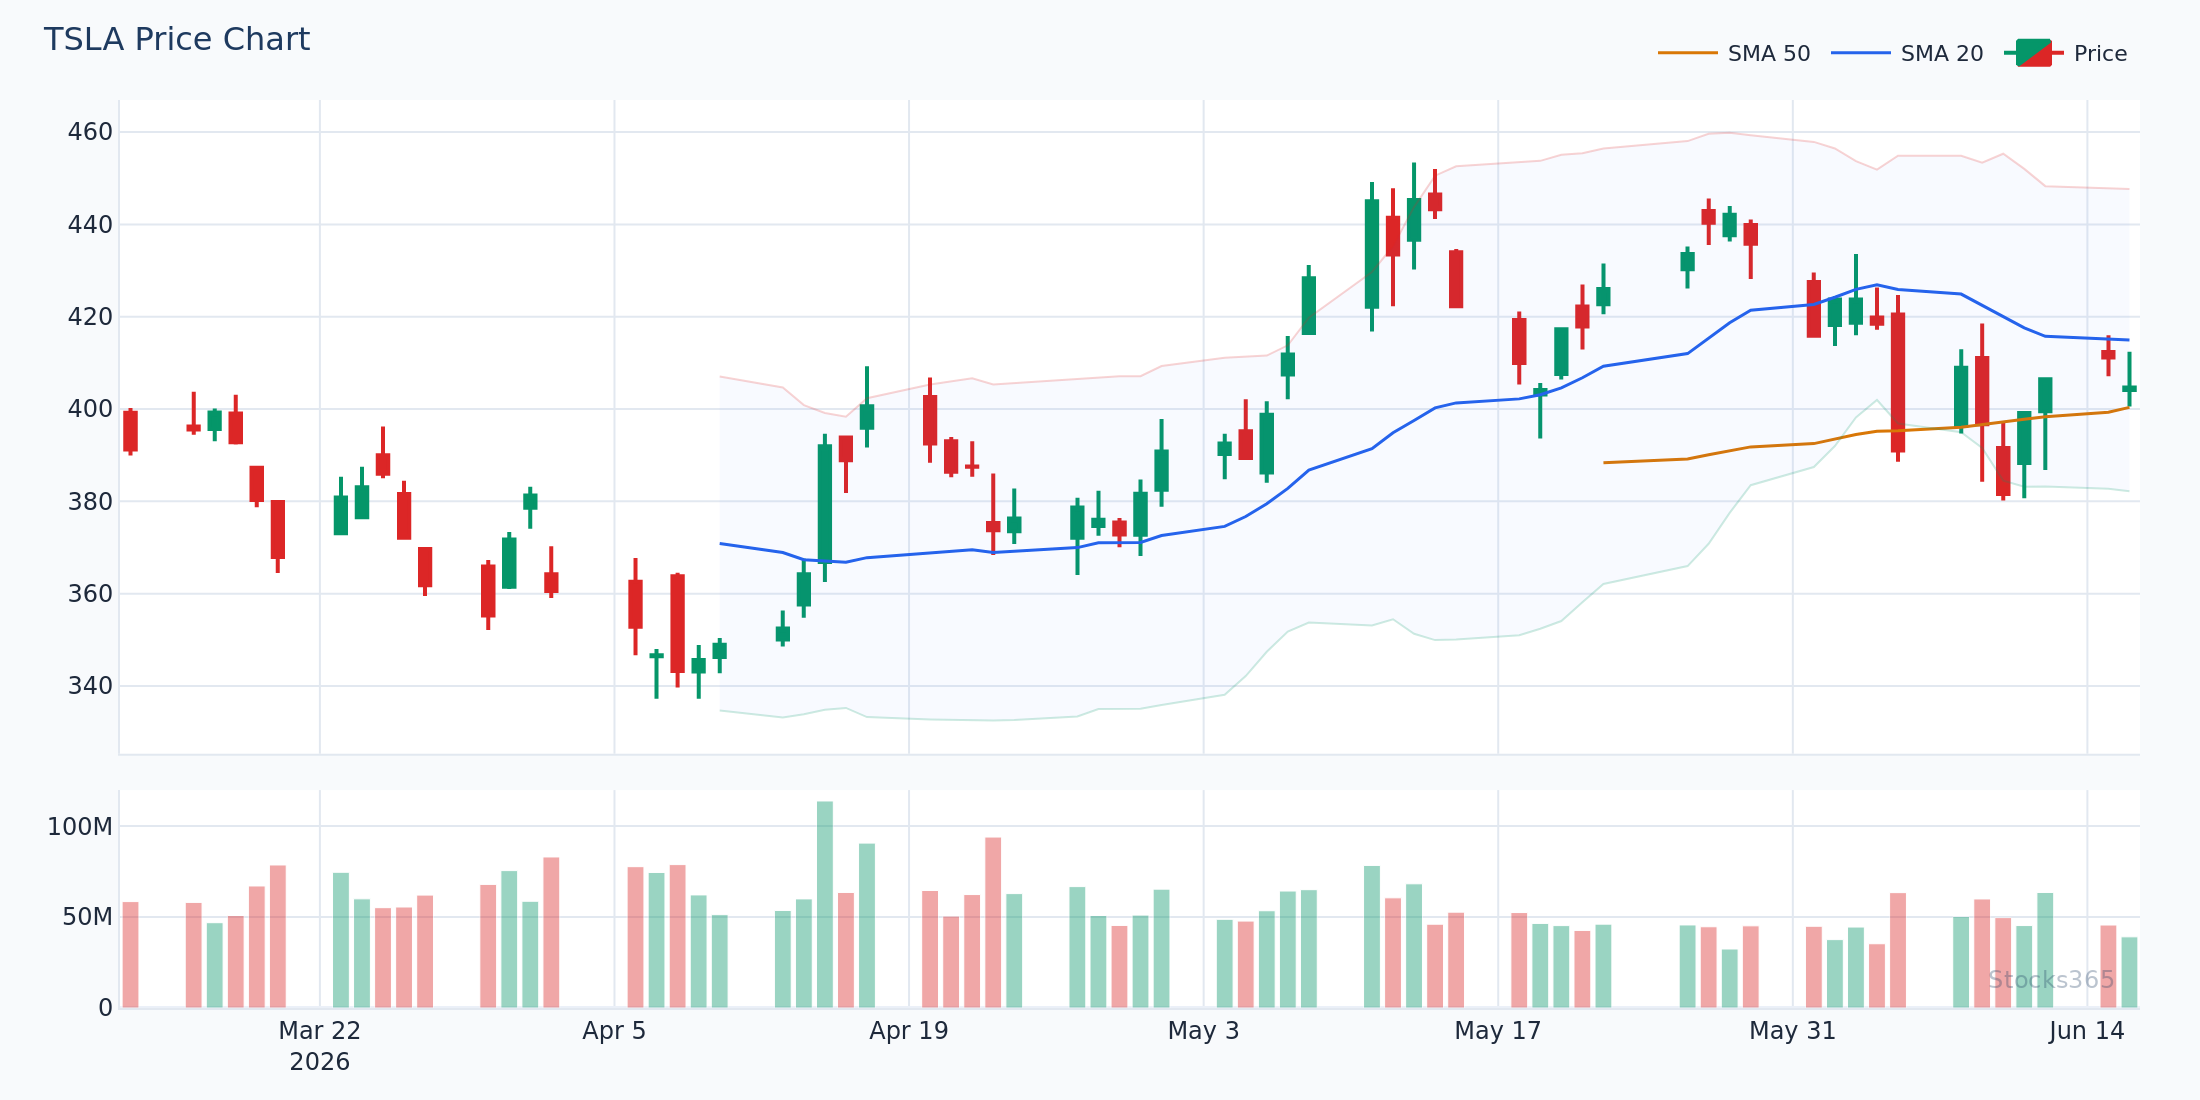
Notice how in a sustained trending move, price consistently closes above the upper Keltner Channel — a signal of trend strength, not overbought conditions. When price finally pulls back inside the channel after multiple closes outside it, that re-entry is the first warning that trend momentum is fading. Confirmation requires a close back below the EMA midline before calling a reversal.
Bollinger Bands vs Keltner Channels: When Each Wins
When Bollinger Bands Have the Edge
Bollinger Bands dominate in mean-reverting, range-bound markets. When price oscillates without a clear directional bias, upper band touches produce reliable fade setups and lower band touches produce reliable bounce setups — provided you confirm with a momentum indicator like RSI or Stochastics.
The Bollinger Squeeze is Bollinger Bands' signature setup. When standard deviation contracts to multi-month lows, band width compresses dramatically — and the eventual expansion produces outsized moves. For a complete breakdown of this setup, see Bollinger Band Squeeze: Master Low Volatility Setups.
Bollinger Bands also give cleaner signals on individual stocks and crypto where volatility clustering is pronounced. Crypto, in particular, responds well — our backtested Bollinger Squeeze Breakout data shows a 51.8% win rate in crypto versus 47.1% in forex.
When Keltner Channels Have the Edge
Keltner Channels dominate in trending markets. When price breaks above the upper Keltner Channel and holds, that's not an overbought warning — it's a trend strength signal. Traders who fade upper Keltner Channel touches in strong uptrends get crushed repeatedly.
Keltner Channels also work better for trailing stop placement. Because ATR-based bands don't whipsaw on a single volatile candle, you can trail a stop just outside the channel without getting shaken out of a valid trend prematurely.
For commodities and forex in trending regimes, Keltner Channels produce fewer false signals than Bollinger Bands, which can flag overbought conditions that never actually reverse.
Here's What Most Traders Get Wrong
Most traders treat a Bollinger Band upper touch as an automatic sell signal. Wrong. In a strong trend, price hugs the upper Bollinger Band for candle after candle. The actual signal isn't the touch — it's the failure to sustain above the band. When price touches the upper band, closes back inside, then fails to re-test that level on the next push, that is the reversal setup. The first touch is noise. The failed re-test is the signal.
The same logic applies to Keltner Channels. A break above the upper channel isn't overbought — it's often the beginning of a momentum surge. The real warning comes when price closes back inside the channel after a multi-candle run above it.
The Squeeze Signal: Where Bollinger Bands and Keltner Channels Combine
Here's where things get genuinely powerful. When Bollinger Bands contract inside Keltner Channels, that's a confirmed Bollinger Squeeze — one of the most reliable volatility compression setups in technical analysis.
The logic: Bollinger Bands measure standard deviation. Keltner Channels measure ATR-based range. When standard deviation (Bollinger Bands) drops so far that the bands fit inside the ATR-based envelope (Keltner Channels), volatility has reached an extreme low. Energy is coiling. The breakout, when it comes, tends to be sharp and sustained.
John Carter popularized this combined squeeze signal, and it remains one of the most-traded volatility setups in 2026. The Stocks365 platform identifies this pattern automatically — check live setups on the signals dashboard.
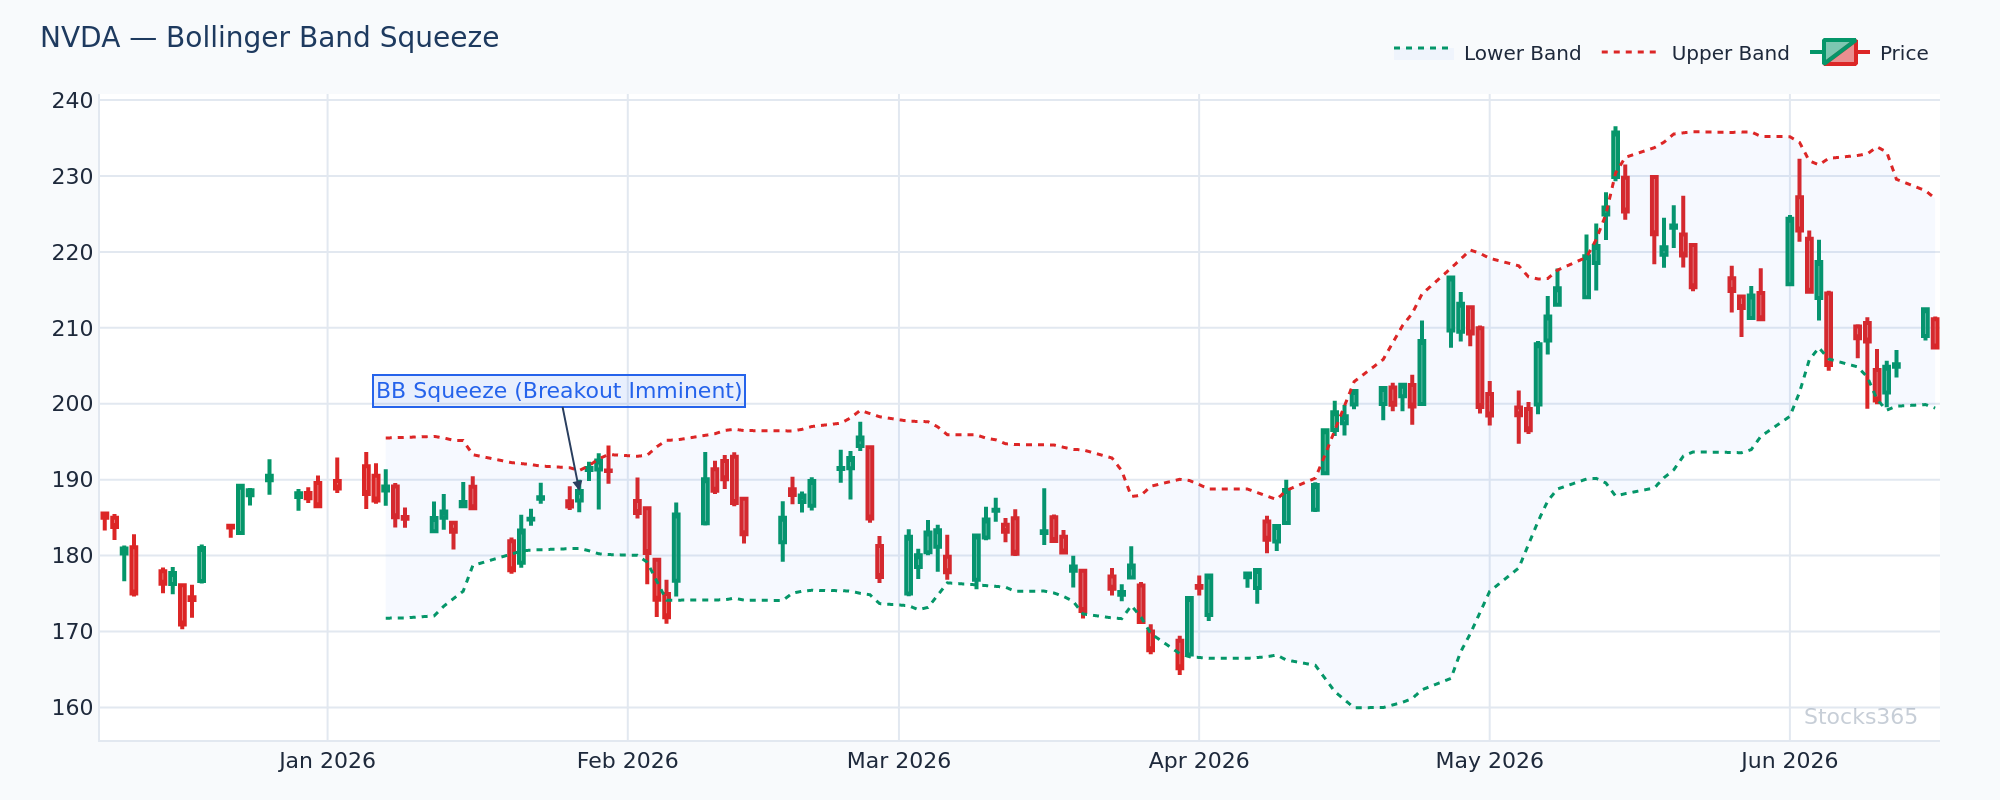
This chart shows Bollinger Bands compressing entirely within the Keltner Channel envelope — the classic squeeze setup. The longer price consolidates in this compressed state, the more energy builds for the eventual breakout. Direction confirmation requires a momentum trigger: RSI breaking above 55 on the upside, or dropping below 45 on the downside, gives the first directional signal before price commits to a full breakout candle.
How to Trade the Squeeze Breakout
- Step 1: Identify when Bollinger Bands contract inside Keltner Channels — this confirms the squeeze is active
- Step 2: Wait for Bollinger Bands to begin expanding outside the Keltner Channel — this signals the squeeze release
- Step 3: Confirm direction with a momentum indicator — RSI crossing above 55 or Stochastic turning up from oversold supports the long side
- Step 4: Enter on the first candle that closes outside both the Bollinger Band and the Keltner Channel in the breakout direction
- Step 5: Set initial stop at the midline (20-SMA/EMA) — a close back below invalidates the breakout thesis
Backtested Performance: What the Data Shows
Raw signal statistics matter. But context matters more.
Our analysis of 3,255 Bollinger Upper Band Touch signals shows a 49.6% win rate with a profit factor of 0.88 over a 10-day holding period. That's a negative expectancy setup in isolation. The best asset class is crypto at 56.7% — the worst is commodities at 41.5%. Trading a Bollinger upper band touch on crude oil futures or agricultural commodities without additional confirmation is a losing strategy by the numbers.
The takeaway: neither Bollinger Bands nor Keltner Channels generate edge in isolation. The edge emerges from combining these tools with momentum confirmation, regime awareness, and asset class selection. For RSI confirmation strategies and their backtested results, see RSI Backtesting Results: Does RSI Actually Work?.
Bollinger Bands vs Keltner Channels: Practical Setup Comparison
Mean Reversion Setup
Use Bollinger Bands. Price tags the lower band after a momentum selloff, RSI drops below 30, and volume surges 2x average on the red candle. Wait for a green close back inside the lower band. That's the entry. Target the 20-SMA midline as first take-profit. Keltner Channels don't give a clean lower band touch signal in the same way — the ATR-smoothing makes them less precise for mean reversion entries.
Trend Continuation Setup
Use Keltner Channels. Price breaks above the upper Keltner Channel on above-average volume, pulls back to the EMA midline without closing below it, then reclaims the upper channel. That pullback-to-midline is the continuation entry. Stop goes below the midline. Bollinger Bands would likely have already flashed a false overbought signal during the initial breakout.
Volatility Breakout Setup
Use both. Wait for the Bollinger Squeeze (bands inside Keltner Channels). Trade the breakout candle when Bollinger Bands expand back outside the Keltner Channel. Add RSI or RSI trendline confirmation for direction. This is the highest-probability application of combining both indicators.
RSI breaking above a descending trendline drawn across recent peaks during a Bollinger Squeeze often precedes the upside breakout by 1-2 candles — giving early directional warning before the band expansion confirms. When the RSI trendline break and the Bollinger Band expansion above the Keltner Channel happen simultaneously, the signal strength is at its highest. A failed RSI trendline break followed by RSI rolling back below 50 invalidates the bullish thesis.
Parameter Settings: What Actually Works in 2026
Default settings for both indicators were designed for daily charts. In 2026, with algorithmic trading dominant across timeframes, the defaults still hold up surprisingly well — but context adjustments matter.
- Bollinger Bands (standard): 20-period SMA, ±2 standard deviations — works best on daily and 4-hour charts
- Bollinger Bands (shorter-term): 10-period SMA, ±1.5 standard deviations — useful for intraday setups on 15-minute and 1-hour charts
- Keltner Channels (standard): 20-period EMA, ±2x ATR(10) — the most widely used setting
- Keltner Channels (trend-following): 20-period EMA, ±2.5x ATR(20) — wider bands reduce false breakout signals in volatile assets
- Squeeze detection: Use default Bollinger (20, 2.0) with Keltner (20, 1.5) — this tighter Keltner setting makes squeeze detection more sensitive
Do not over-optimize parameters to historical data. The market adapts. Use standard settings, confirm with momentum, and let price action be the final arbiter.
Combining With Other Indicators
Neither Bollinger Bands nor Keltner Channels work best alone. The most effective combinations in 2026 remain consistent with multi-year backtesting:
- Bollinger Bands + RSI: RSI divergence at band extremes is the cleanest mean reversion confirmation available. See RSI Indicator: The Complete Trading Guide for 2026
- Bollinger Bands + Stochastic: Double overbought (price at upper band + Stochastic above 80) works best in crypto. Our data on 3,026 signals shows a 58.0% win rate in crypto for this setup — though only 40.7% in commodities. Asset class selection is non-negotiable
- Keltner Channels + Moving Average crosses: When a Golden Cross forms while price rides above the upper Keltner Channel, the confluence of trend signals is powerful
- Both indicators + Volume: Volume surge on a Keltner Channel breakout or Bollinger Band squeeze release separates real moves from false breaks
What to Watch For
- Bollinger Squeeze setups in tech equities: When Bollinger Band width drops below its 20th percentile over the past 125 sessions and simultaneously fits inside Keltner Channels, the eventual expansion typically produces a 2-3 ATR move. Watch for RSI trendline breaks to confirm direction before entering.
- Upper Keltner Channel rides in trending crypto: When crypto price closes above the upper Keltner Channel for 3+ consecutive daily candles on above-average volume, treat pullbacks to the EMA midline as continuation entries — not reversals. The fade trade against this pattern has negative expectancy in trending regimes.
- Failed Bollinger upper band re-tests: After an initial upper band touch, when price pulls back to the 20-SMA and then fails to reclaim the upper band on the next push (with RSI making a lower high), the mean reversion short setup triggers. This failed re-test pattern has more reliability than the initial band touch alone.
- Keltner Channel re-entry after trend exhaustion: When price has been riding above the upper Keltner Channel for an extended run and then closes back inside the channel on above-average volume, that re-entry candle often precedes a multi-session correction back toward the midline. Use the midline as the initial target.
- Squeeze breakouts in crypto during low-volatility periods: After multi-week periods of compressed Bollinger Band width with bands nested inside Keltner Channels, crypto breakouts have historically shown the strongest follow-through. Confirm with a Stochastic cross from below 20 on the long side or above 80 on the short side.
Key Takeaways
📊 Bollinger Bands vs Keltner Channels — Summary
- Bollinger Bands use standard deviation; Keltner Channels use ATR — this single difference drives all behavioral distinctions
- Bollinger Bands excel in mean-reverting, range-bound markets; Keltner Channels excel in trending markets
- The Bollinger Squeeze (Bollinger Bands contracting inside Keltner Channels) is the most powerful combined signal both indicators produce
- Neither indicator generates positive expectancy in isolation — momentum confirmation (RSI, Stochastic) is required
- Asset class matters: crypto responds better to Bollinger-based setups; trending instruments (commodities in trend) favor Keltner Channel approaches
- Default settings (BB: 20 SMA, ±2 SD / KC: 20 EMA, ±2x ATR) remain the most robust starting point across asset classes in 2026
- The squeeze breakout (n=14,266) shows a 49.5% win rate with a profit factor of 1.03 — slight positive expectancy that grows substantially when filtered by asset class and regime
How Stocks365 Uses This
🔬 How Stocks365 Integrates Bollinger Bands and Keltner ChannelsStocks365's trust score system synthesizes 12+ technical indicators into a single signal confidence rating for every asset we track. Bollinger Band width and Keltner Channel position are both factored into the volatility regime component of the trust score.
When Bollinger Bands compress inside Keltner Channels — confirming an active squeeze — the platform flags the asset as being in a pre-breakout volatility regime. This adjusts the weight given to momentum signals like RSI and Stochastic in the overall trust score: in squeeze conditions, a momentum trigger carries more weight because the energy release tends to be directional and sustained.
The trust score also incorporates band touch signals differently by asset class. A Bollinger upper band touch on a crypto asset gets assessed differently than the same signal on a commodity — consistent with the backtested performance gap our data shows (56.7% crypto vs 41.5% commodities for upper band touch signals).
See live signals incorporating these setups on the Stocks365 signals dashboard, or check individual asset trust scores — for example, AAPL signals — to see how volatility indicators contribute to current signal confidence.