
Bollinger Bands vs Moving Averages: Which Technical Tool Actually Wins?
Two indicators dominate beginner and professional watchlists alike: Bollinger Bands and moving averages. Both live on the price chart. Both use historical price data. Both help traders identify trend and momentum. But they do fundamentally different jobs — and confusing them costs real money.
This guide breaks down exactly what separates these two tools, when each one gives you a genuine edge, and how combining them creates setups far more powerful than either alone.
Let's get into it.
What Moving Averages Actually Do
A moving average is a smoothed line that tracks the average closing price over a set number of periods. That's it. The 20-period simple moving average (SMA) adds the last 20 closes and divides by 20. Every new bar, the oldest close drops off and the newest enters.
The result is a trend filter. Price above the moving average? Uptrend. Price below? Downtrend. Two moving averages crossing — like the 50-SMA crossing above the 200-SMA — signals a major regime shift. That's the Golden Cross vs Death Cross setup that institutional desks watch closely.
Types of Moving Averages Traders Use
- Simple Moving Average (SMA): Equal weight to every period. Slower to react. Better for trend identification.
- Exponential Moving Average (EMA): More weight on recent closes. Faster reaction. Better for momentum signals.
- Weighted Moving Average (WMA): Linear weighting. Less common but useful in fast-moving markets.
Moving averages are lagging indicators. They confirm what already happened. That's a feature, not a bug — confirmation reduces false signals. But it also means you're never buying the exact bottom or selling the exact top.
What Bollinger Bands Actually Do
Bollinger Bands do something fundamentally different. They measure volatility. The standard setup uses a 20-period SMA as the middle band, then plots upper and lower bands two standard deviations away from that average.
When price moves violently, the bands expand. When markets consolidate, the bands contract. This expansion and contraction is the entire point — Bollinger Bands give you a dynamic, real-time picture of whether volatility is high or low relative to recent history.
To understand the math powering this, read our deep dive on how Bollinger Bands work. The standard deviation calculation is simple once you see it step by step.
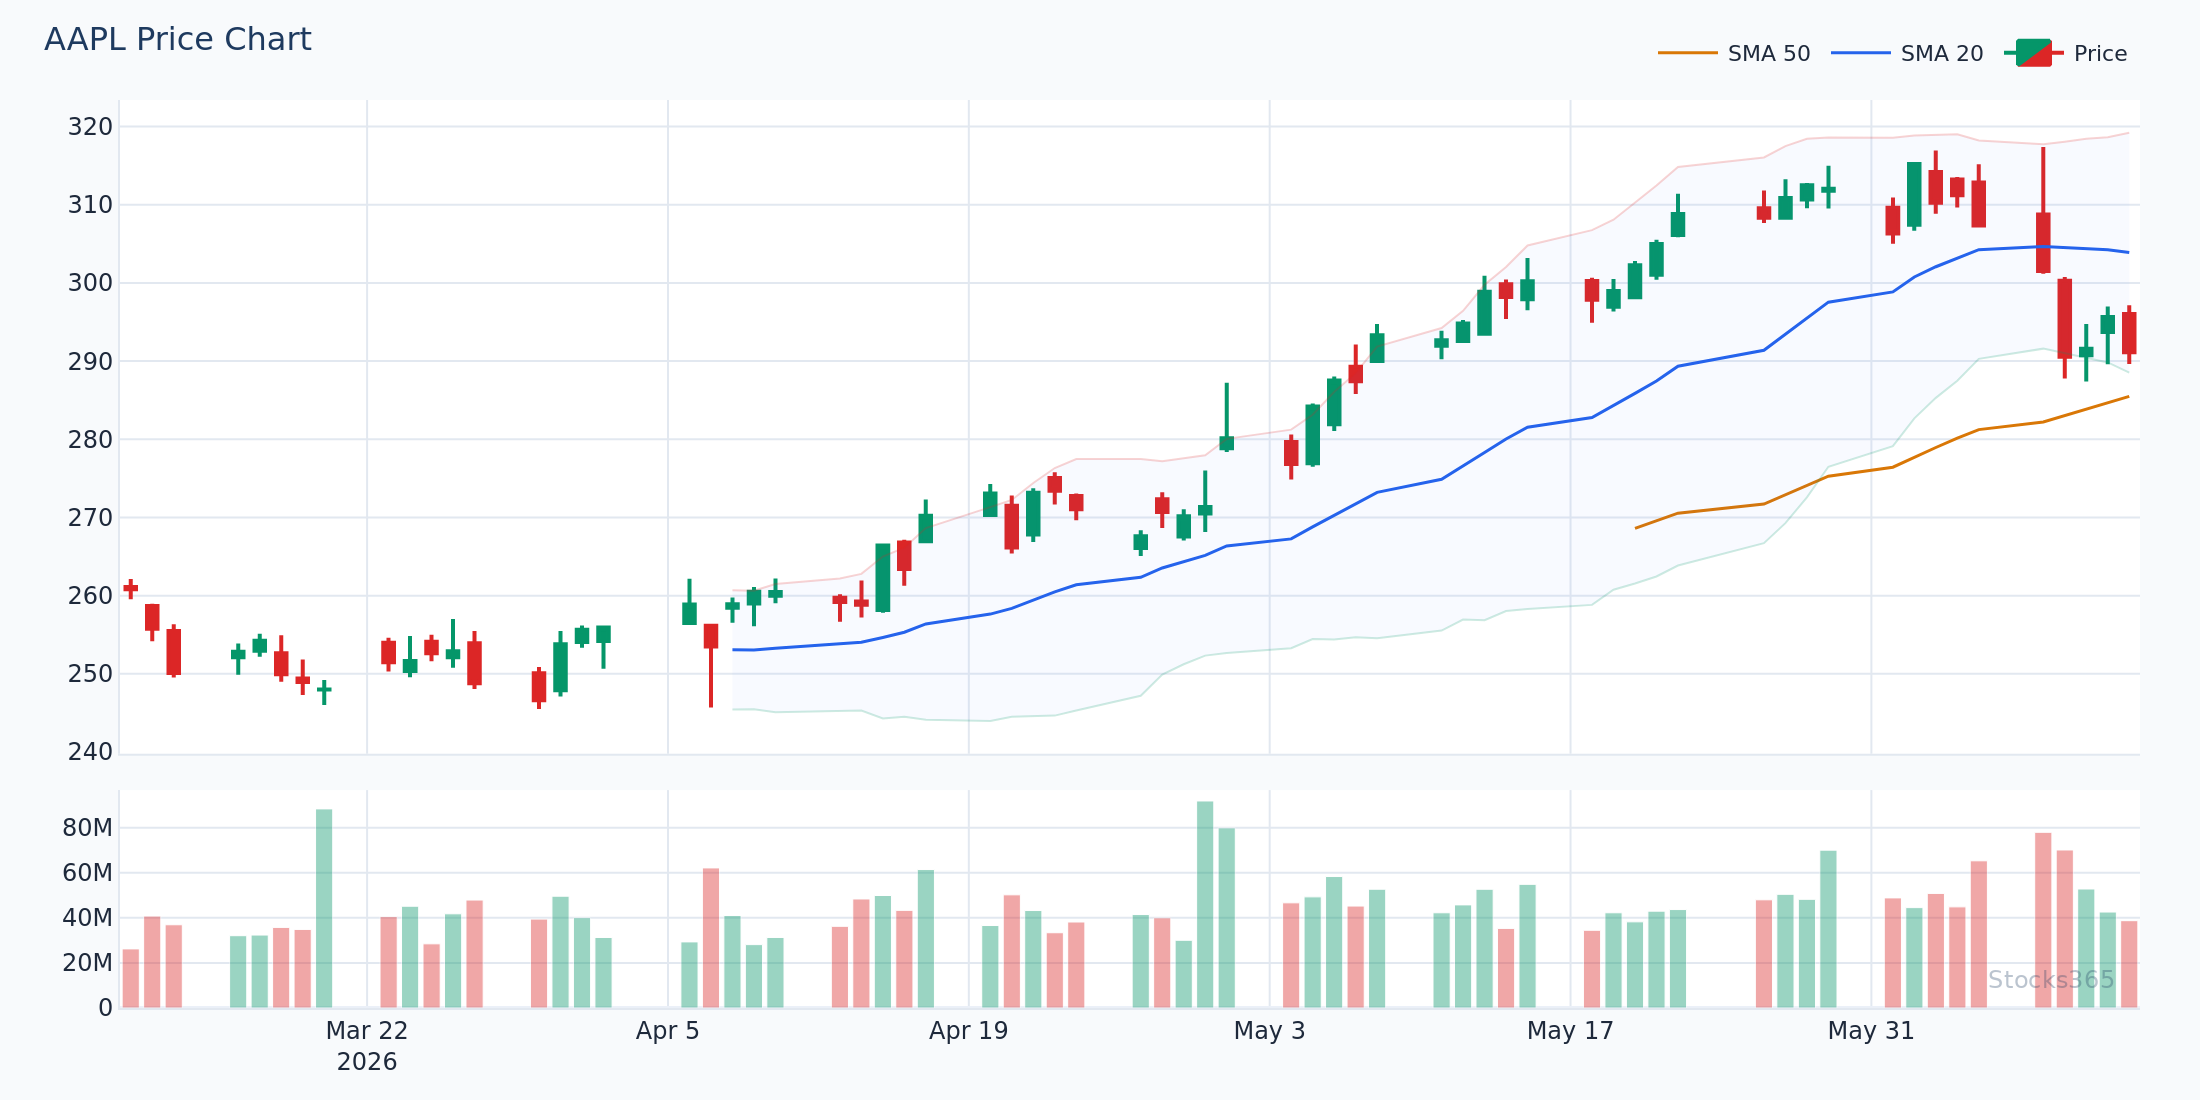
This chart shows AAPL's bands widening sharply as price breaks out of a consolidation range. When bands expand rapidly after a squeeze period, it signals that a new directional move is underway — not a random noise spike. Confirmation comes when price closes decisively outside the band and volume surges above the 20-day average. If price immediately snaps back inside the band within 1-2 bars, the breakout likely fails.
The Middle Band Is Still a Moving Average
Here's something traders miss: the middle Bollinger Band is a 20-period SMA. Bollinger Bands don't replace moving averages — they build on top of one. The innovation is everything wrapped around it: the standard deviation channels that expand and contract with market conditions.
This means you already get trend direction from the middle band, plus volatility context from the outer bands. That's two signals in one indicator.
Bollinger Bands vs Moving Averages: The Core Differences
Here's the clean breakdown:
- Moving averages measure direction. Bollinger Bands measure volatility and relative price position.
- Moving averages are single lines. Bollinger Bands are a three-band envelope that breathes with the market.
- Moving averages lag. Bollinger Bands adapt dynamically to recent price behavior.
- Moving averages signal trend. Bollinger Bands signal when price is stretched, compressed, or breaking out.
- Moving averages work best in trending markets. Bollinger Bands work best when you need to identify volatility cycles.
Neither is better. They answer different questions.
When Moving Averages Give You the Edge
Moving averages shine in trending conditions. When a stock is in a clear uptrend — higher highs, higher lows, price consistently above the 50-SMA — moving averages provide clean dynamic support levels. Pullbacks to the 20-EMA or 50-SMA become repeatable buy setups.
They also excel at filtering out noise during trend-following strategies. If your rule is "only take long signals when price is above the 200-SMA," you automatically avoid shorting strong uptrends and buying into obvious downtrends. Simple. Effective. Rules-based.
Where Moving Averages Fail
Choppy, range-bound markets destroy moving average strategies. When price oscillates back and forth across a moving average repeatedly — called whipsawing — every crossover signal triggers a trade, and most of those trades lose. The flat 20-SMA in a sideways market produces zero useful information.
This is exactly where Bollinger Bands step in.
When Bollinger Bands Give You the Edge
Bollinger Bands excel at identifying two specific conditions: extreme price extension and volatility compression.
When price tags the upper Bollinger Band in a ranging market, it's often stretched and due for a mean reversion back toward the 20-SMA. When price tags the lower band after a sharp selloff, the same principle applies in reverse. This mean-reversion behavior is why many traders use Bollinger Bands for counter-trend entries.
The volatility compression signal — known as the Bollinger Squeeze — is arguably even more powerful. When the bands tighten dramatically, it signals that a major move is coming. Direction isn't guaranteed, but magnitude often is. Our full breakdown of the Bollinger Band Squeeze setup covers exactly how to trade this pattern.
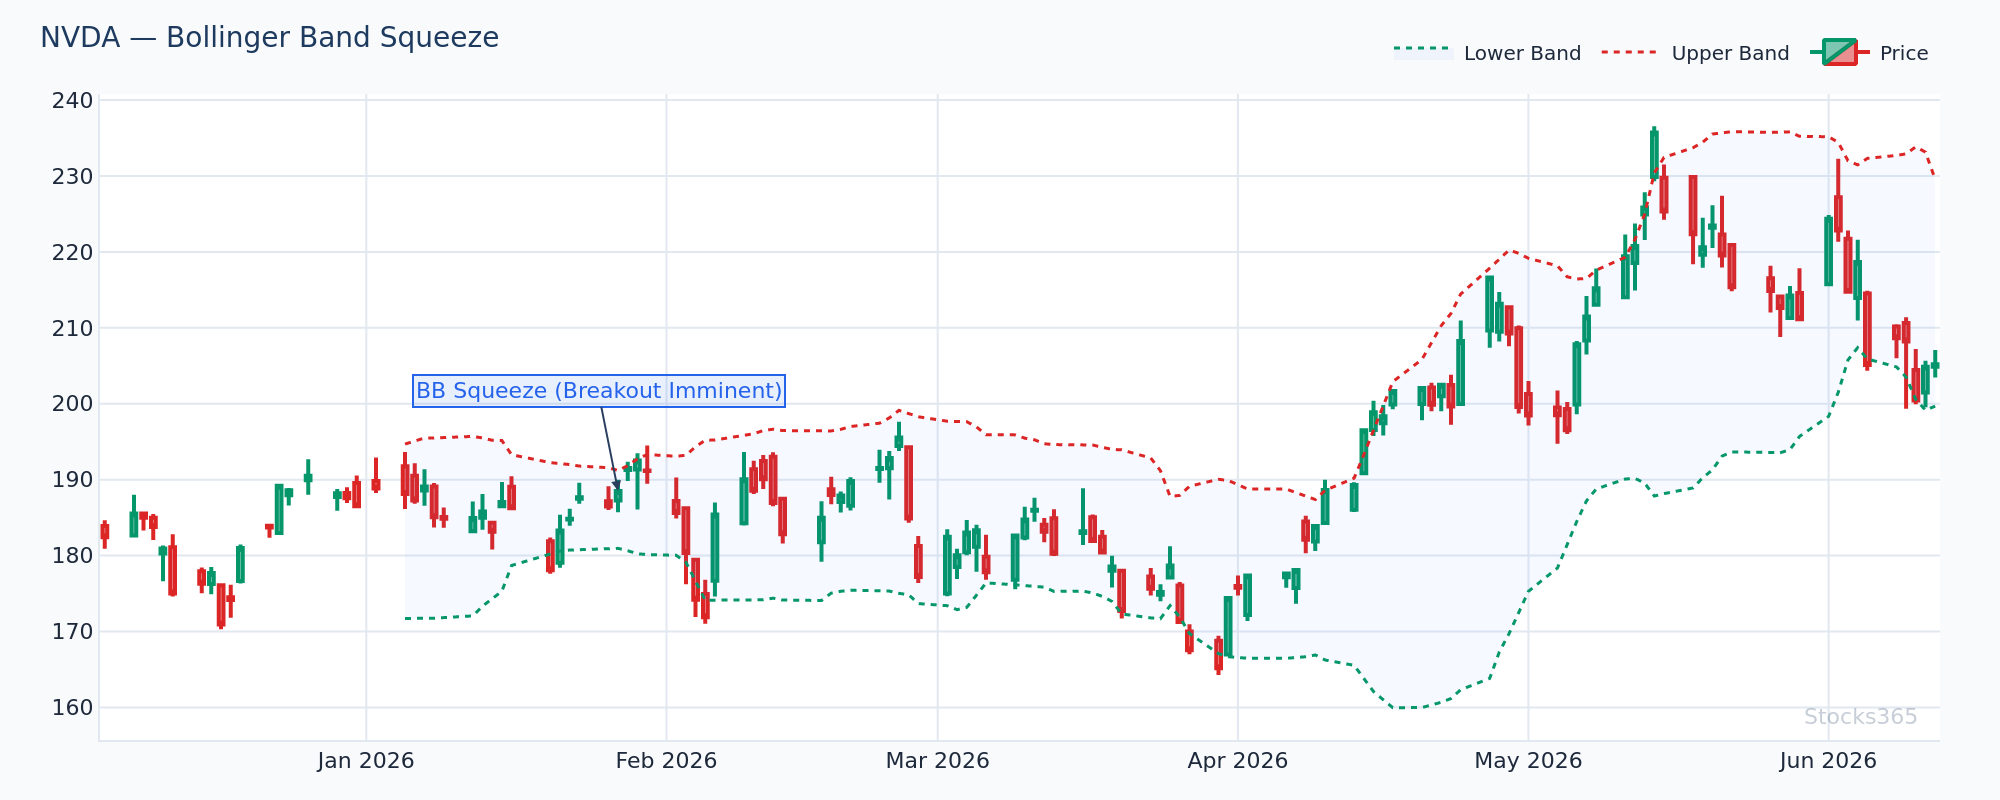
This chart illustrates NVDA entering a tight squeeze — band width narrowing below the 20th percentile of its recent range. These compression periods often resolve into 2-3 ATR moves once the breakout triggers. Confirmation requires a strong-bodied candle closing clearly outside the bands, ideally with above-average volume. A weak close or immediate reversal back into the bands signals a false breakout.
Where Bollinger Bands Fail
Strong trending markets punish mean-reversion traders using Bollinger Bands. During a powerful uptrend, price can "walk the upper band" — hugging it for weeks as the trend extends far beyond what looks reasonable. Fading every upper band touch in a trending market produces a brutal series of losses.
Our analysis of 3,255 Bollinger Upper Band Touch signals (n=3,255) found a historical win rate of just 49.6% with a profit factor of 0.88 over a 10-day holding period. Crypto performed best at 56.7%, while commodities dragged performance down to 41.5%. The data is clear: fading the upper band alone, without additional confluence, is a losing strategy on average. Our research dashboard breaks down this performance by asset class in full detail.
Context is everything.
Here's What Most Traders Get Wrong
Most traders treat a Bollinger Band touch as an automatic reversal signal. Upper band touch = sell. Lower band touch = buy. This thinking ignores the entire volatility framework Bollinger designed. In a strong trend, the upper band touch is a continuation signal, not a reversal signal. The edge isn't in fading every touch — it's in identifying whether the market is in trend-following or mean-reversion mode first, then applying the appropriate band strategy. Get the regime right, then pick the signal.
How to Combine Bollinger Bands and Moving Averages
The real power comes from using both together. Here's how the combination works in practice:
Setup 1: Moving Average Trend Filter + Band Breakout
First, establish trend direction using a longer moving average — typically the 50-SMA or 200-SMA. If price is above the 200-SMA, only look for long setups. Then wait for a Bollinger Squeeze to form. When price breaks out of the squeeze in the direction of the established trend, that's a high-quality entry.
This filter eliminates the counter-trend squeeze breakouts that produce false signals in trending markets.
Setup 2: EMA Pullback + Lower Band Support
In an uptrend, price pulling back to both the 20-EMA and the lower Bollinger Band simultaneously creates a high-probability mean-reversion entry. Two dynamic support levels converging at the same price level provides significantly more conviction than either signal alone.
Look for a bullish candlestick pattern — hammer, engulfing, or morning star — at this convergence zone. That's the trigger. For buy and sell signal frameworks in detail, the Bollinger Bands Buy and Sell Signals guide covers every major setup pattern.
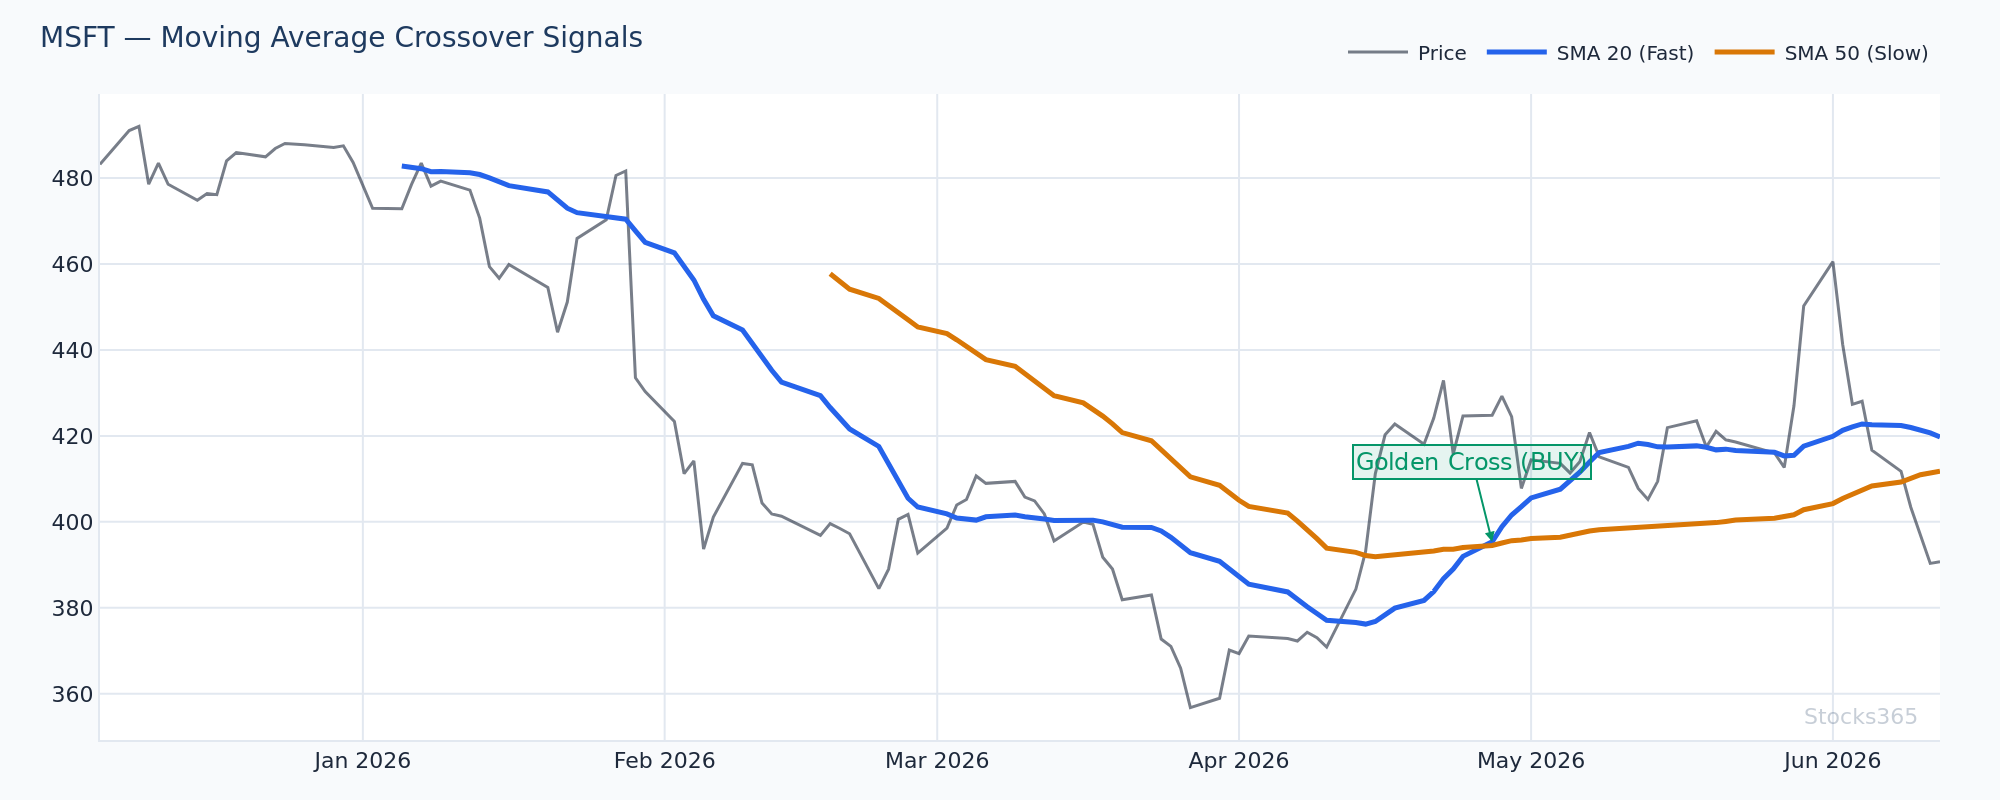
This chart shows MSFT with both moving averages trending upward and the Bollinger Bands in an upward-sloping channel — classic trending regime. Pullbacks to the middle band (20-SMA) are buying opportunities as long as the 50-SMA continues to slope upward. The setup invalidates if price closes below the 50-SMA on heavy volume, signaling a potential trend change.
Setup 3: Adding Oscillator Confluence
Moving averages and Bollinger Bands handle price and volatility. Adding a momentum oscillator like RSI or the Stochastic creates a three-pillar confirmation system.
When price tags the lower Bollinger Band, the 20-SMA is sloping upward (trend intact), AND RSI drops below 30, the confluence is strong. Three independent signals pointing the same direction reduces false entries significantly. The Stochastic Oscillator guide and our complete RSI guide for 2026 both cover how to layer these signals effectively.
More confluence. Less noise.
The Backtested Reality: What the Data Shows
Strategies that combine Bollinger Bands with oscillator confirmation show interesting performance patterns. Stocks365 backtested 3,026 setups using a BB + Stochastic Double Overbought signal and found a 49.9% win rate with a profit factor of 0.91 over a 10-day holding period. Crypto led with 58.0% win rate, while commodities lagged at 40.7%.
The takeaway isn't that these signals fail — it's that asset class selection matters enormously. The same technical pattern produces dramatically different outcomes depending on the underlying market's volatility profile. Applying a crypto-calibrated setup to commodities produces near-certain underperformance.
If you want RSI-specific backtesting data, our RSI backtesting results article covers multi-year performance in detail.
Choosing Between Them: A Practical Framework
Use this decision process before every trade:
- Is the market trending? If yes, use moving averages as your primary tool and Bollinger Bands to time entries during pullbacks.
- Is the market ranging or choppy? If yes, Bollinger Bands become primary — fade upper band touches for short setups and lower band touches for long setups.
- Is volatility compressed? Bollinger Squeeze setup takes priority. Wait for the breakout, use the moving average to determine directional bias.
- Are you in a crypto market? Both tools work but require wider parameters — crypto's volatility makes standard band settings too tight.
The regime dictates the tool. Not the other way around.
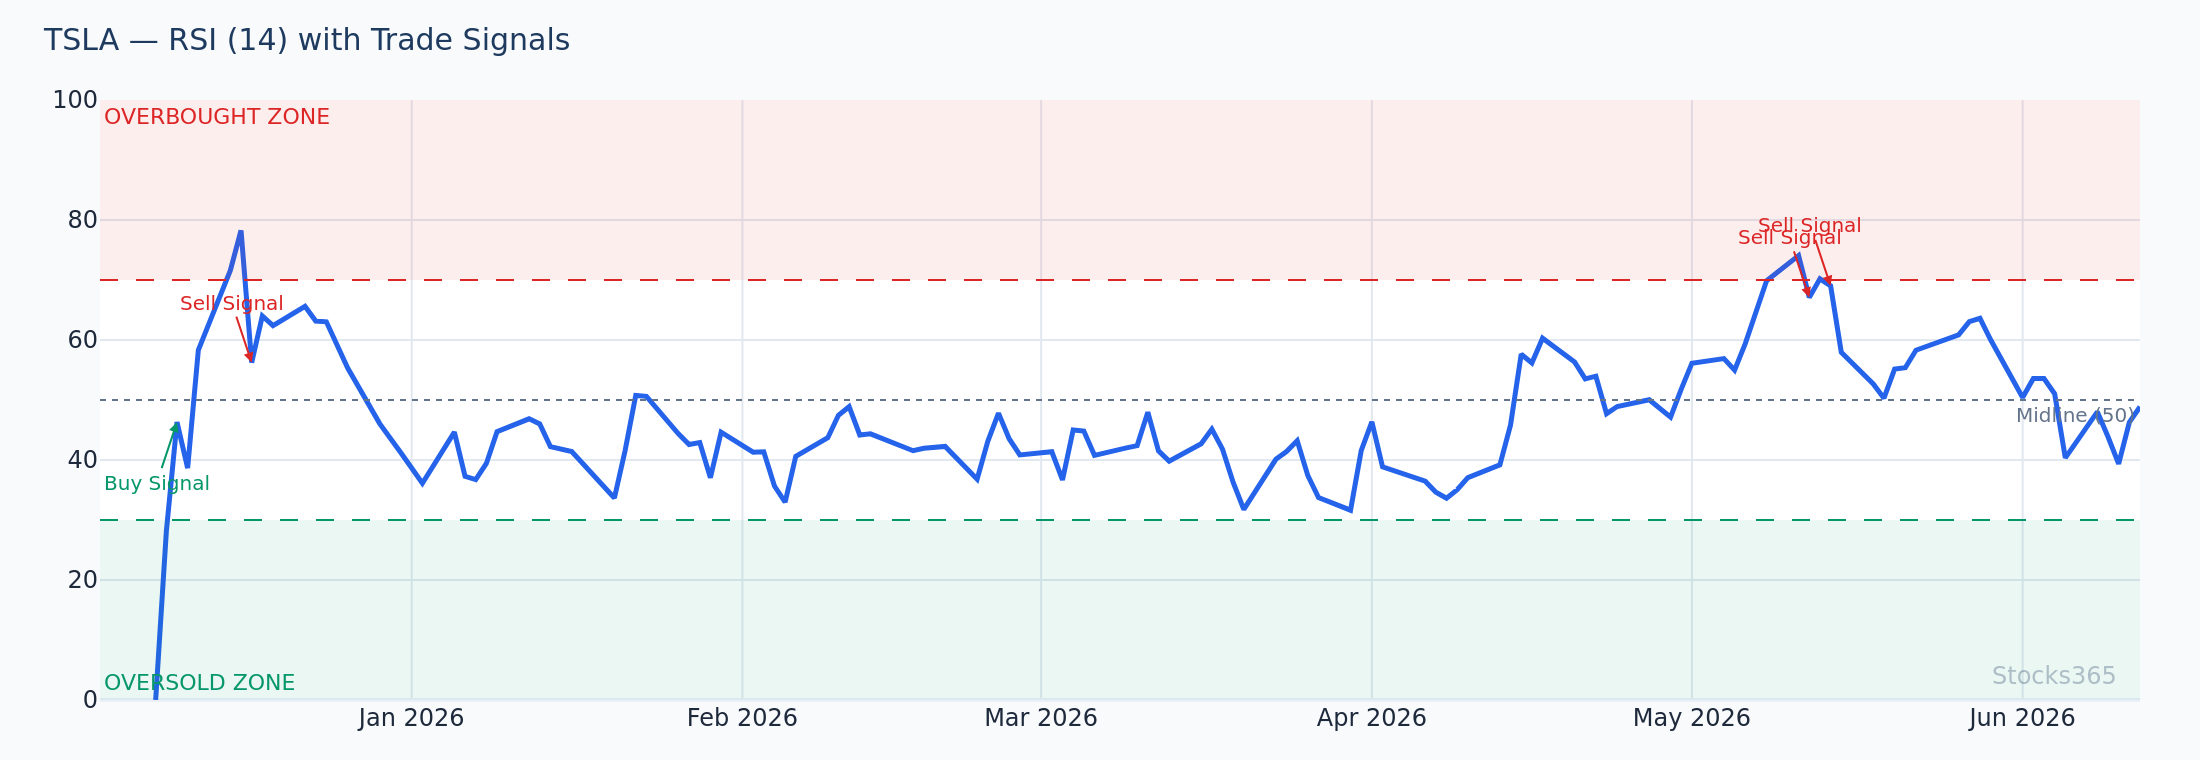
This chart overlays RSI on TSLA's price action, showing an RSI reading dropping below 30 while price simultaneously tags the lower Bollinger Band. The dual signal — oversold momentum plus price at a dynamic support level — creates a high-probability mean-reversion setup. Confirmation comes from RSI turning back above 30 and price closing back inside the bands. If RSI continues falling below 20 with expanding lower band width, the downtrend is accelerating and the long setup is invalid. For building RSI trendlines that add another layer of confirmation to these setups, the RSI Trendline Strategy guide is essential reading.
What to Watch For
- Bollinger Squeeze breakouts on high-beta tech stocks: When band width drops below the 20th percentile of its 52-week range, the next expansion frequently produces a 2-3 ATR directional move. Look for the breakout bar to close with strong volume confirmation.
- Moving average stack alignment: When the 20-EMA is above the 50-SMA, which is above the 200-SMA, and all three slope upward, trend-following entries on pullbacks to the 20-EMA carry significantly higher probability than counter-trend trades.
- Lower Bollinger Band + flat or rising 200-SMA: Price tagging the lower band while the 200-SMA remains flat or upward sloping signals a tactical pullback within a structural uptrend — historically one of the cleaner mean-reversion setups across equities.
- Band width returning to normal after compression: The first 3-5 bars after a Bollinger Squeeze resolution often see the most explosive price action. Position sizing and entry timing are most critical during this window.
- Crypto upper band touches with RSI staying above 60: In strong crypto uptrends, upper band touches where RSI remains above 60 — rather than overbought at 70+ — often signal healthy consolidations before continuation, not reversal.
How Stocks365 Uses This
Stocks365 integrates both Bollinger Band analysis and moving average signals as part of its multi-indicator trust score system — one of 12+ technical components that contribute to each signal's confidence rating.
Bollinger Band volatility readings feed into the platform's volatility regime scoring, which automatically adjusts signal thresholds based on whether the market is in a compression or expansion phase. Moving average alignment — specifically the relationship between the 20-EMA, 50-SMA, and 200-SMA — contributes to the trend agreement score, which measures how many indicators agree on directional bias.
When a stock's trust score shows high agreement across volatility, trend, and momentum components simultaneously, the signal quality rating increases. Signals with trust scores above 75 — reflecting strong cross-indicator alignment — have historically shown meaningfully better outcomes than low-conviction signals.
You can view live trust scores and signal breakdowns for individual stocks on the Stocks365 signals dashboard, or check specific stock signals like AAPL signals to see how Bollinger Bands and moving averages factor into each rating in real time.
Key Takeaways
- Moving averages measure trend direction. Bollinger Bands measure volatility and relative price position. They are complementary, not interchangeable.
- The middle Bollinger Band is a 20-SMA. Bollinger Bands build on moving averages — they don't replace them.
- Asset class matters. Backtested data shows Bollinger Band signals perform significantly better in crypto than in commodities or forex.
- Identify the regime first. Trending markets favor moving average strategies. Ranging markets favor Bollinger Band mean-reversion. Compression periods favor squeeze breakout setups.
- Confluence beats single signals. Combining moving average trend filters with Bollinger Band volatility signals — and adding an RSI or Stochastic layer — produces more reliable setups than any single tool alone.
- Upper band touches are not automatic sells. In trending markets, they're often continuation signals. Context determines interpretation.