
Bollinger Bands vs RSI: Which Indicator Actually Wins?
Every trader eventually faces this question. Two indicators. Both popular. Both backed by decades of use. But which one deserves a spot on your chart?
The honest answer: it depends on what you're trying to measure. Bollinger Bands measure volatility and price position. RSI measures momentum and speed of price change. They're not competing tools — they answer different questions. But when you're forced to choose, or you're building a lean, focused setup, knowing which one fits your trading style matters.
Our analysis of 3,255 Bollinger Upper Band Touch signals found a 49.6% win rate over a 10-day holding period — with meaningful differences across asset classes. That data alone tells a story worth unpacking before you commit to either indicator.
Let's break both down completely.
What Bollinger Bands Actually Measure
Bollinger Bands consist of three lines: a 20-period simple moving average in the middle, and two outer bands plotted two standard deviations above and below that average. The bands expand when volatility rises and contract when volatility falls.
That dynamic width is the key. Unlike static support and resistance levels, Bollinger Bands adapt to market conditions in real time.
What traders watch for:
- Band touches: Price touching the upper band signals the asset is statistically extended relative to recent history. A lower band touch signals the opposite.
- Band squeezes: When the bands tighten dramatically, it signals compressed volatility — and a breakout is often close. The Bollinger Band squeeze setup is one of the most reliable pre-breakout patterns in technical analysis.
- Band walks: In strong trends, price can hug the upper or lower band for extended periods. This is not automatically a reversal signal.
For a deeper look at the math powering these bands, this breakdown of how Bollinger Bands work covers the standard deviation calculation in plain English.
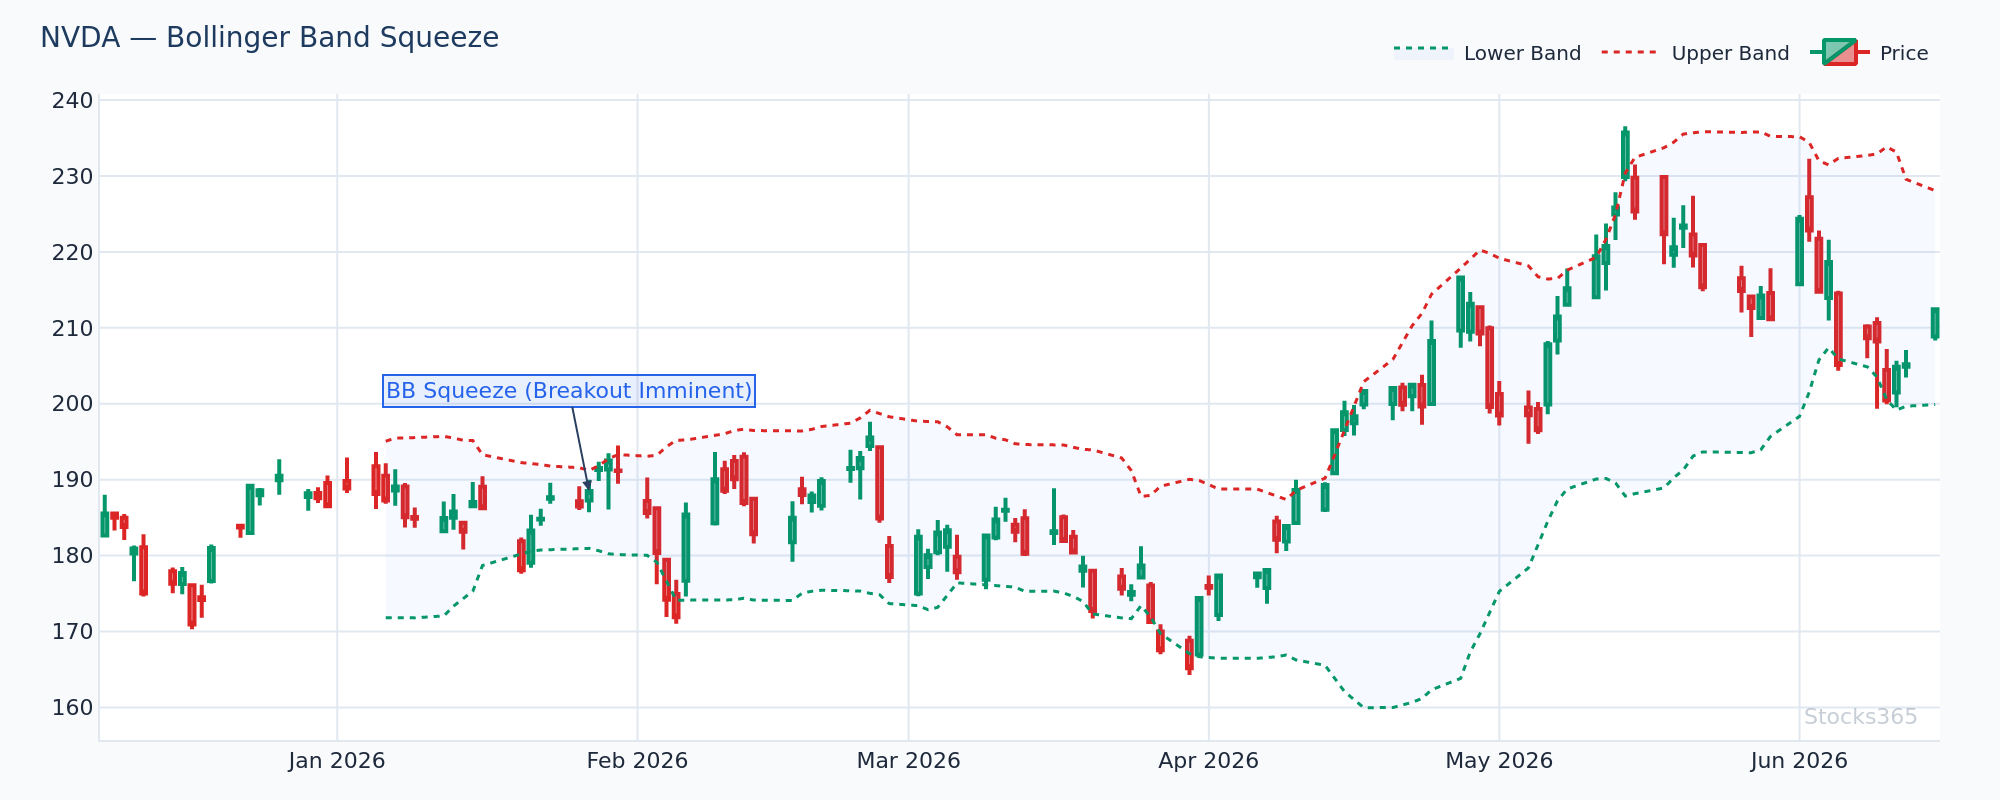
This chart shows NVDA's band width compressing to levels not seen in several weeks, with price consolidating near the midline. When band width contracts this aggressively, the subsequent expansion typically produces a sharp directional move — often 2 to 3 ATR within the first five sessions. A decisive close outside either band, confirmed by above-average volume, validates the breakout direction. A close back inside the bands after the initial push invalidates the setup.
What RSI Actually Measures
The Relative Strength Index calculates the ratio of average gains to average losses over a set period — typically 14 periods. The result is a value between 0 and 100. Readings above 70 are traditionally labeled overbought. Below 30 is oversold.
RSI doesn't measure price directly. It measures the velocity of price change. That's a critical distinction. An asset can have RSI above 70 for weeks during a strong uptrend — not because something is wrong, but because buyers keep winning each period.
The complete RSI trading guide for 2026 covers every configuration worth knowing, including period adjustments for different timeframes.
Core RSI setups traders rely on:
- Overbought/oversold signals: RSI crossing back below 70 from above (or above 30 from below) as a momentum reversal trigger
- Divergence: Price makes a new high while RSI prints a lower high — a classic warning that momentum is deteriorating
- Trendline breaks on RSI: Drawing support and resistance directly on the RSI line, independent of price action, often reveals momentum shifts before price moves. The RSI trendline strategy is underused and consistently effective.
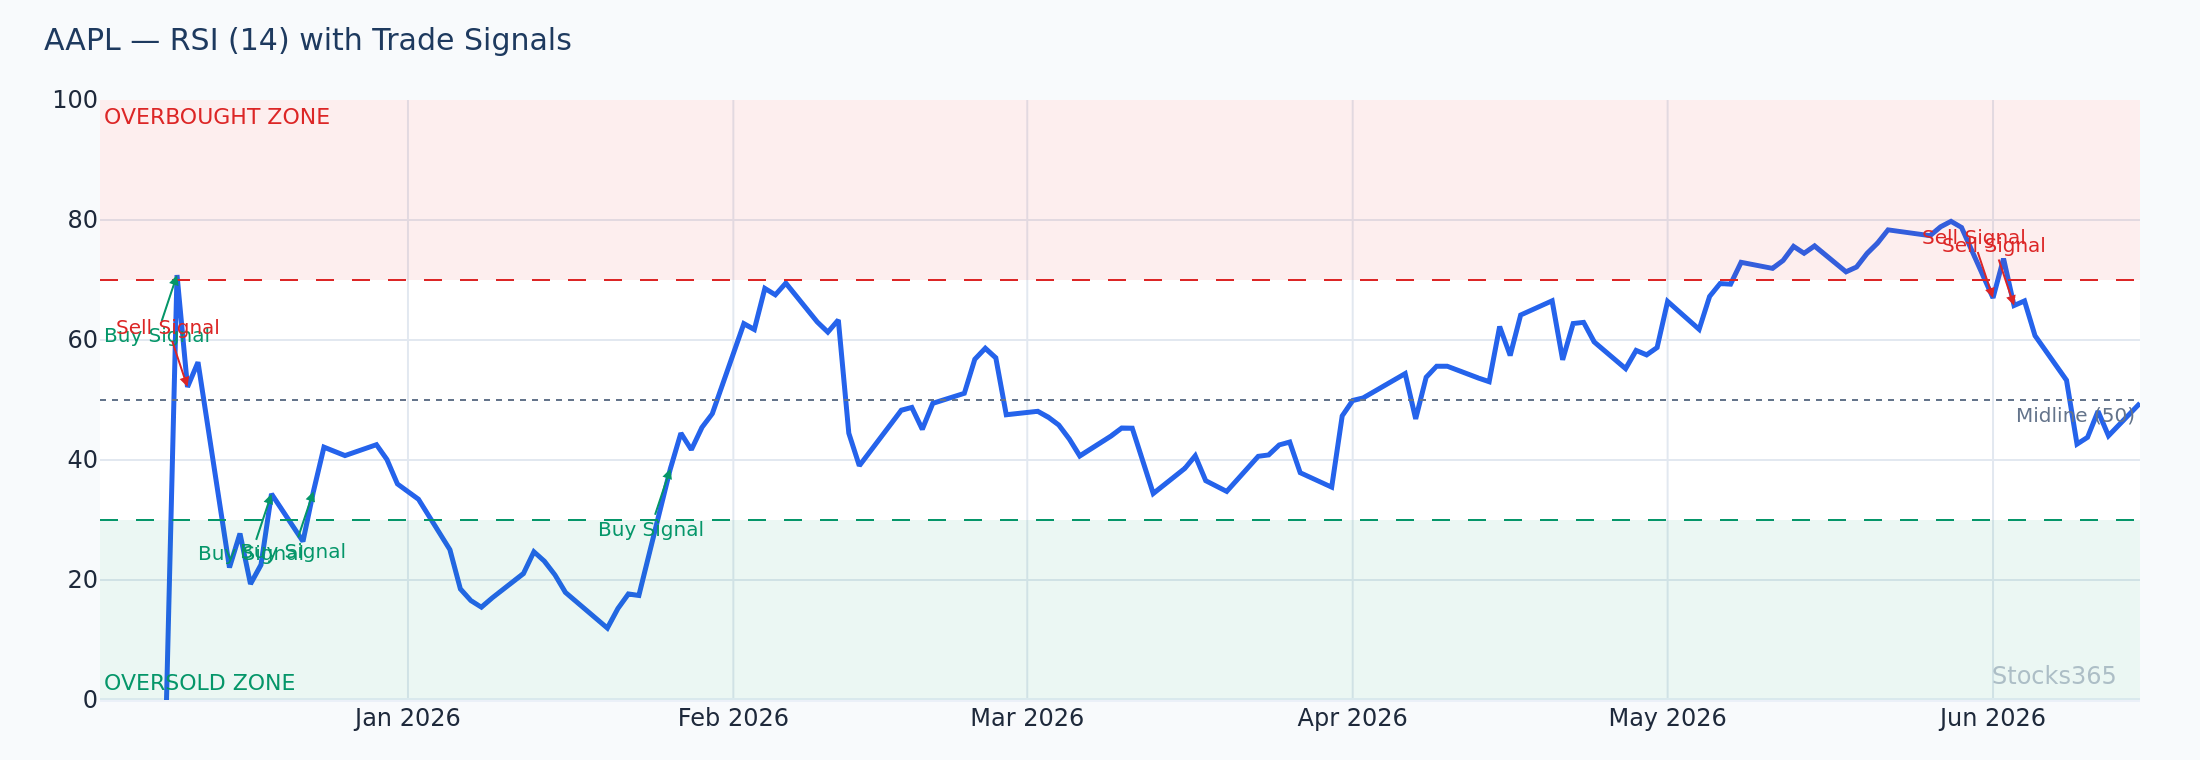
This chart highlights a classic bearish divergence pattern — price is pushing toward a fresh high while RSI prints a lower peak than the previous swing. This mismatch signals weakening buying pressure beneath the surface. Confirmation comes when RSI breaks its own trendline drawn across the two declining peaks. No confirmation, no trade — divergence alone without a trigger produces too many false signals to act on blindly.
Bollinger Bands vs RSI: The Core Differences
Here's where the comparison gets practical.
What They're Built For
Bollinger Bands are a volatility and context tool. They tell you where price is relative to its recent range and how volatile conditions currently are. RSI is a momentum tool. It tells you how fast price is moving and whether that momentum is accelerating or fading.
Neither tells the whole story alone. That's the point.
Trending Markets vs Ranging Markets
RSI struggles in strong trends. When a stock is grinding higher week after week, RSI stays overbought for extended periods. Traders waiting for RSI to "come back down" miss the move entirely. In ranging markets, RSI excels — the oscillation between overbought and oversold becomes predictable and tradeable.
Bollinger Bands handle trending markets better. Price walking the upper band in a strong uptrend is informative — it's not a sell signal, it's confirmation of trend strength. But in low-volatility, directionless markets, the bands contract and generate fewer actionable signals on their own.
Leading vs Lagging
RSI is slightly more forward-looking. Divergence patterns give you a heads-up before price reverses. Bollinger Bands are reactive — they widen after volatility has already increased. That's not a flaw, but it changes how you use them.
Here's What Most Traders Get Wrong
Most traders treat RSI 70 as an automatic sell signal. They see the number, they exit or short. In ranging stocks, this works fine. In trending markets — especially large-cap tech during momentum phases — RSI stays above 70 for weeks. The actual edge isn't RSI crossing 70. It's RSI breaking back below 70 after spending time above it. That crossing-back is the momentum shift signal. Watch for that, not the initial overbought reading.
The same trap exists with Bollinger Bands. Touching the upper band is not a sell. It's context. Price can touch and walk along the upper band through an entire trend leg. The reversal signal comes when price closes back inside the band after a series of upper-band touches — especially if volume drops on that closing candle.
Backtested Performance: What the Data Shows
Here's where most comparison articles hand-wave and say "both work in the right conditions." Let's use real numbers.
Stocks365 backtested 3,042 RSI Momentum Shift Up signals and found a 48.9% win rate over a 10-day holding period (profit factor: 0.92). The breakdown by asset class is revealing: RSI momentum signals performed best on stocks at 51.9% and worst on crypto at 39.2%. Crypto's high baseline volatility makes pure RSI momentum entries unreliable without additional filters.
For Bollinger Band signals, our analysis of 3,255 Upper Band Touch setups showed a 49.6% win rate at 10 days, with crypto performing best at 56.7% and commodities worst at 41.5%. The asset class split is nearly the inverse of RSI signals — which reinforces the case for matching your indicator to your asset class, not using the same approach across everything.
You can explore the full methodology behind these numbers through our research dashboard.
What does this tell us? Neither indicator produces a reliable edge in isolation at typical default settings. The edge comes from context — market regime, asset class, and confirmation from secondary signals.
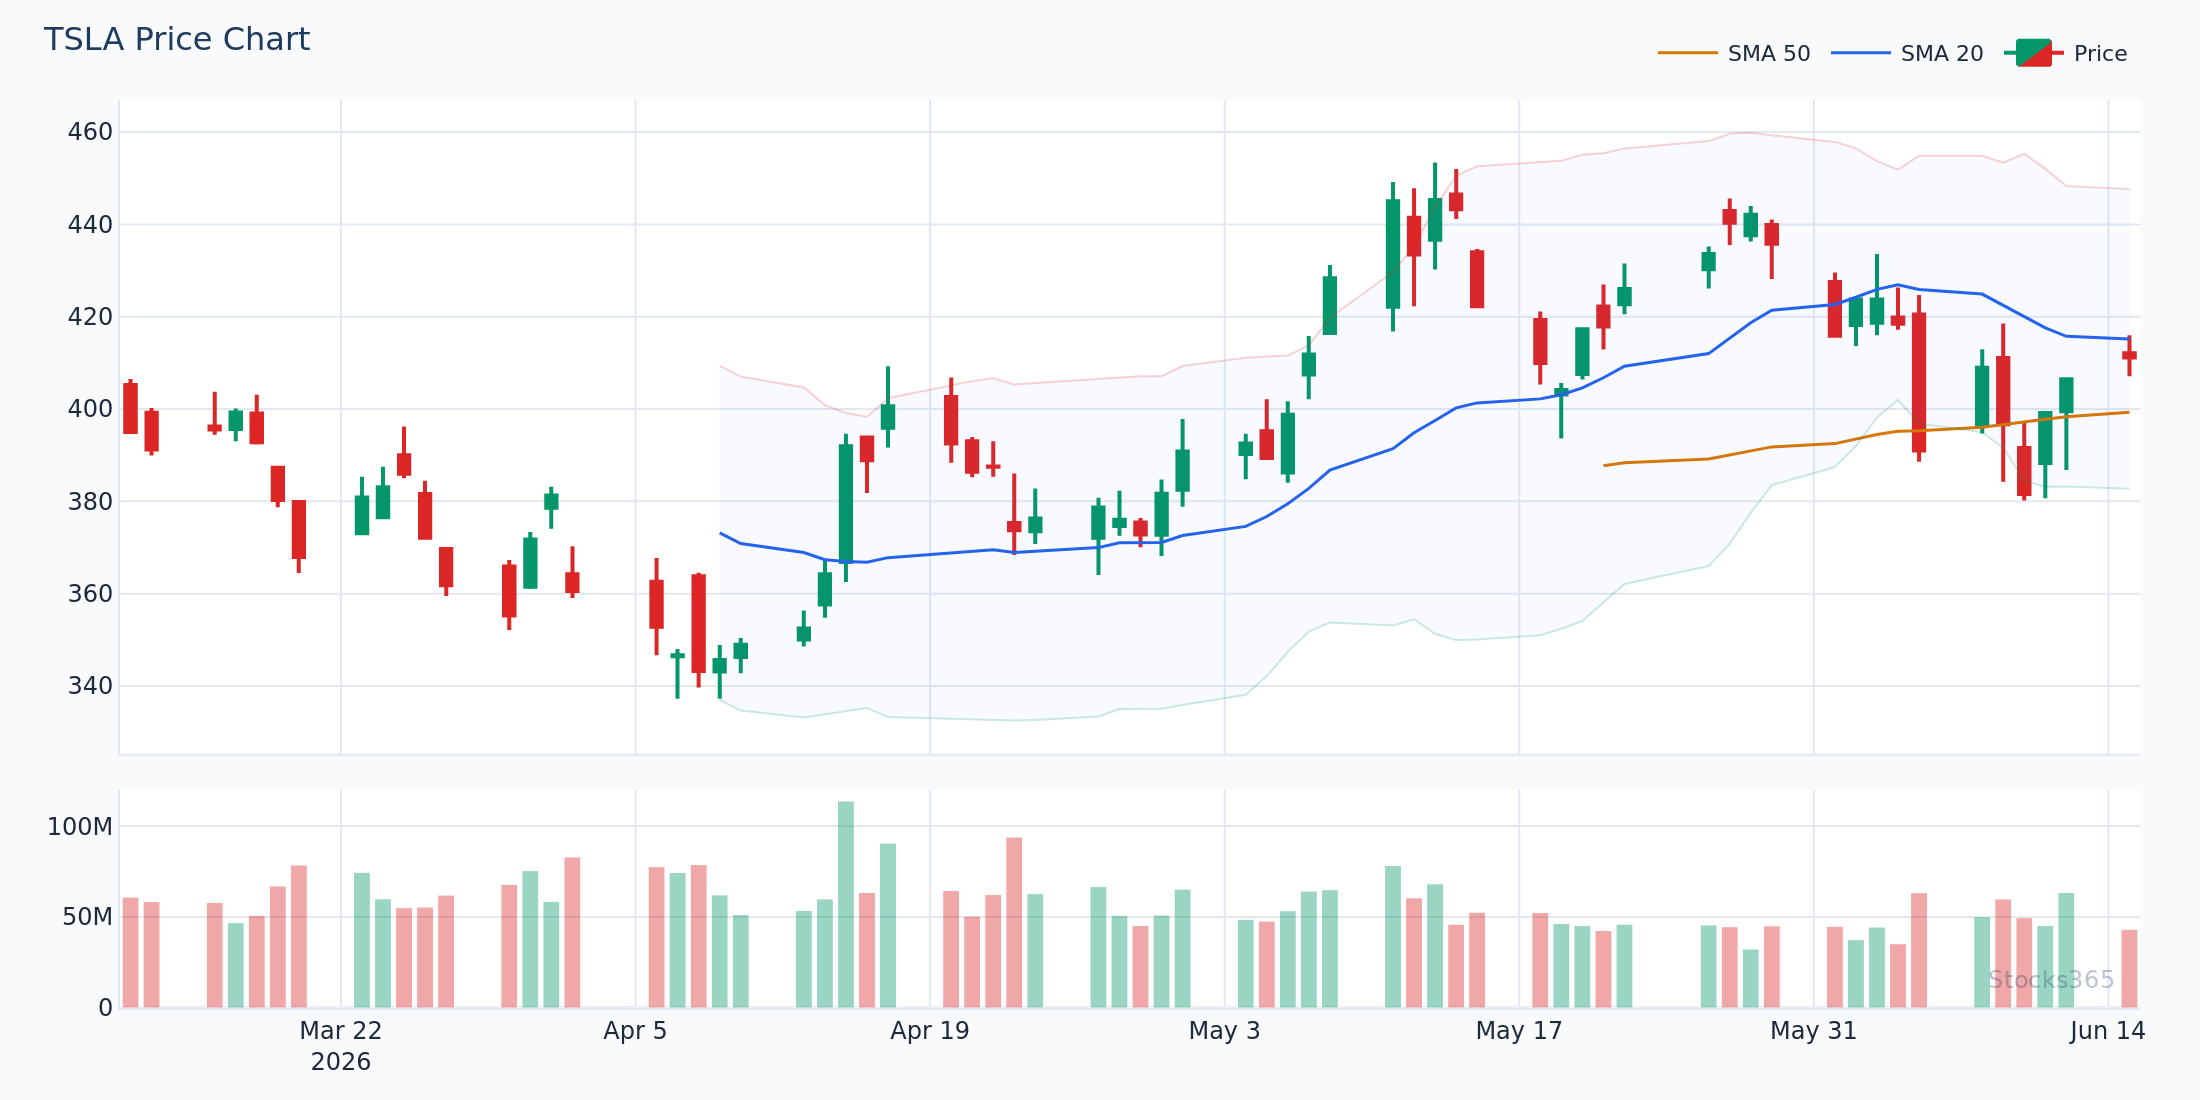
This chart shows price reaching the upper Bollinger Band while RSI simultaneously crosses back below 70 from an overbought reading — a dual-confirmation reversal setup. When both signals align like this, the probability of a short-term pullback to the 20-period midline increases meaningfully compared to either signal appearing alone. The setup fails if price immediately reclaims the upper band within one to two sessions, suggesting the trend is stronger than the indicators implied.
When to Use Bollinger Bands Over RSI
Bollinger Bands win in these scenarios:
- You trade breakouts. The squeeze pattern is one of the cleanest pre-breakout signals available. When band width drops to multi-month lows, something is about to move. See the detailed breakdown in our Bollinger Bands buy and sell signals guide.
- You want volatility context. Knowing whether a market is in a high- or low-volatility regime changes position sizing and stop placement. Bollinger Bands give you that instantly.
- You trade strongly trending assets. In a clear trend, band walks tell you trend health. RSI just stays overbought and confuses you.
- You trade crypto. Our backtested data shows Bollinger Upper Band Touch signals hit 56.7% win rates on crypto — meaningfully above the baseline.
When to Use RSI Over Bollinger Bands
RSI wins in these scenarios:
- You trade ranging markets. In a clear trading range, RSI oscillating between overbought and oversold is precise and reliable.
- You want divergence signals. No Bollinger Band equivalent catches momentum divergence as cleanly as RSI. Divergence before a major reversal is one of the highest-quality signals in technical analysis.
- You trade individual stocks. RSI momentum signals on stocks hit 51.9% in our backtest — the best asset class for this signal type.
- You want a single clean oscillator. RSI is easier to read at a glance. One number, one line. Less visual noise than three Bollinger Band lines on a crowded chart.
For a deeper dive into RSI signal reliability, the RSI backtesting results article goes further into the numbers.
Combining Both Indicators: The Case for Using Them Together
The most practical answer to "Bollinger Bands vs RSI" is this: use both.
Not because more indicators are always better — they're not. But because these two measure completely different things. When they align, the signal quality improves. When they conflict, you get a warning to stay out.
Powerful combination setups:
- Upper band touch + RSI crossing below 70: Double confirmation of overextension. Both tools agree that short-term momentum is fading.
- Lower band touch + RSI rising above 30: Price is at the statistical low end of its range AND momentum is turning upward. Clean reversal setup.
- Bollinger squeeze + RSI building from neutral: Low volatility compression with RSI drifting toward 50 from below suggests accumulation before a breakout. The direction of the RSI move as the squeeze breaks often previews the breakout direction.
For additional momentum comparison tools, see how these stack up against the Stochastic Oscillator, which shares RSI's oscillator structure but adds a signal line for confirmation.
Trend confirmation matters too. Pairing either indicator with a moving average crossover framework — the kind covered in the Golden Cross vs Death Cross guide — filters out signals that run against the primary trend.
This chart shows price touching the lower Bollinger Band while RSI simultaneously recovers above 30 after a brief dip into oversold territory — a textbook mean-reversion entry pattern. The target on this setup is typically the 20-period midband, which acts as a natural magnet for price after these extreme readings. The pattern invalidates if price closes below the lower band on the following session, suggesting a genuine breakdown rather than a temporary overextension.
Practical Examples Using Real Setups
Setup 1: The RSI Divergence Reversal
Price on a large-cap stock grinds to a fresh 52-week high. RSI on the same chart prints a lower high than the previous peak. The divergence is clear. You wait. RSI then breaks its own short-term trendline downward. That's your trigger. Entry at the trendline break, stop above the recent price high, target at the 20-period moving average. Clean, defined, high-probability when confirmed.
Setup 2: The Bollinger Squeeze Breakout
Band width on a mid-cap tech stock drops to the lowest reading in three months. Price compresses into a tight range just above the 20-SMA. Volume dries up. RSI sits neutral near 50. Then a session arrives where price breaks above the upper band on volume surging 2x the 20-day average. RSI crosses 55 simultaneously. That's the breakout confirmation. The squeeze release tends to carry price a meaningful distance before the next consolidation phase.
Setup 3: The Mean Reversion Bounce
A stock pulls back to touch the lower Bollinger Band after an extended uptrend. The trend is still intact — price is above the 200-SMA. RSI dips to 35 but doesn't reach full oversold levels. Price closes back above the lower band on the next session with a bullish engulfing candle. This is a trend continuation entry, not a reversal. Target: upper band. Stop: below the lower band low.
Check the AAPL signal page for live examples of these patterns as they develop, or scan the full Stocks365 signals dashboard for real-time setups across multiple assets.
What to Watch For
- Bollinger squeeze breakouts on high-beta tech stocks: When band width drops below the 20th percentile of its 52-week range, the subsequent expansion frequently produces a 2–3 ATR directional move within five sessions. Direction bias comes from whichever side price breaks on above-average volume.
- RSI divergence on large-cap crypto after 20%+ drawdowns: Bearish divergence at highs gets attention, but bullish divergence after a significant crypto selloff — where price makes a lower low but RSI prints a higher low — has historically preceded sharp bounces. Confirm with a close above a prior swing high.
- Dual confirmation setups where both indicators align: When the lower Bollinger Band touch and RSI crossing above 30 happen within the same 1–2 sessions, the mean-reversion probability is higher than either signal appearing alone. Filter these for assets in a broader uptrend on the weekly chart.
- RSI staying overbought through a Bollinger Band walk: In strong trending stocks, price walking the upper Bollinger Band while RSI holds above 65 is a trend continuation signal, not a reversal warning. Watch for RSI rolling over while still above 70 as the first sign the trend leg is exhausting.
- Neutral RSI during a squeeze: When RSI hovers near 50 as the Bollinger squeeze deepens, the breakout direction is genuinely contested. Wait for RSI to show clear directional conviction — crossing above 55 or below 45 — before committing to a breakout trade.
Key Takeaways
Summary: Bollinger Bands vs RSI
- Bollinger Bands measure volatility and price position. RSI measures momentum speed and direction. They answer different questions.
- Stocks365 backtested 3,255 Bollinger Upper Band Touch signals at a 49.6% win rate and 3,042 RSI Momentum Shift signals at 48.9% — neither dominates in isolation at default settings.
- RSI performs best on individual stocks (51.9% win rate in our data). Bollinger Bands perform best on crypto (56.7% for upper band touches).
- The biggest mistake: treating RSI 70 as an automatic sell in trending markets. The signal is RSI breaking back below 70, not reaching it.
- Combined signals — where both indicators align — produce higher-quality setups than either indicator alone.
- Match your indicator to your market regime: RSI for ranging markets, Bollinger Bands for trending and breakout environments.
- Use the Stocks365 trust score alongside both indicators for additional confirmation before entering any position.
How Stocks365 Uses This
Stocks365 Trust Score IntegrationStocks365's trust score system combines 12+ technical indicators into a single signal confidence rating. Both Bollinger Band position and RSI readings contribute to this score — but in separate categories. Bollinger Band signals feed into the volatility regime layer of the score, helping the system identify whether a market is in expansion or compression mode. RSI inputs contribute to the momentum agreement layer, measuring whether short-term price velocity aligns with the broader signal direction.
When both layers agree — when volatility signals align with momentum signals — the trust score rises. High trust scores indicate that multiple independent indicator categories are pointing in the same direction, not just one indicator flashing a reading. This is precisely why individual RSI or Bollinger Band signals underperform in isolation: the edge lives in the agreement, not the signal itself. View live trust scores for any stock on the Stocks365 signals dashboard.