
What Is the Bollinger Bandwidth Indicator?
Volatility is the engine of every trade. Without it, markets drift sideways and profits evaporate. The Bollinger Bandwidth indicator quantifies exactly how much volatility exists in a market at any given moment — and more importantly, when that volatility is about to explode.
Developed by John Bollinger as a companion to his famous Bollinger Bands, Bandwidth strips away the price noise and delivers a single, clean number: how wide are the bands right now relative to their recent history? That number tells you whether the market is coiling for a breakout or exhausted after a big move.
Simple concept. Powerful execution.
How Bollinger Bandwidth Is Calculated
Understanding the formula makes you a better trader. Bollinger Bandwidth is calculated by taking the difference between the upper and lower Bollinger Bands, then dividing by the middle band (the 20-period simple moving average).
Bollinger Bandwidth = (Upper Band − Lower Band) / Middle Band
The result is expressed as a percentage or a decimal. A reading of 0.10 means the bands span 10% of the current price. A reading of 0.05 means they span just 5% — a historically tight squeeze.
The standard Bollinger Band settings use a 20-period SMA with bands placed 2 standard deviations above and below. These defaults work well across most timeframes and instruments. Some traders adjust the period to 10 or 50 depending on their strategy — the same way you'd fine-tune RSI settings for your specific approach.
What the Numbers Actually Mean
- High Bandwidth: Volatility is elevated. The market is already in motion — trending hard or experiencing a sharp reversal.
- Low Bandwidth (The Squeeze): Volatility has contracted. Energy is building. A breakout is loading.
- Bandwidth Declining from Highs: A volatile move is fading. Consolidation is beginning.
- Bandwidth Rising from Lows: The squeeze is ending. Directional movement is imminent.
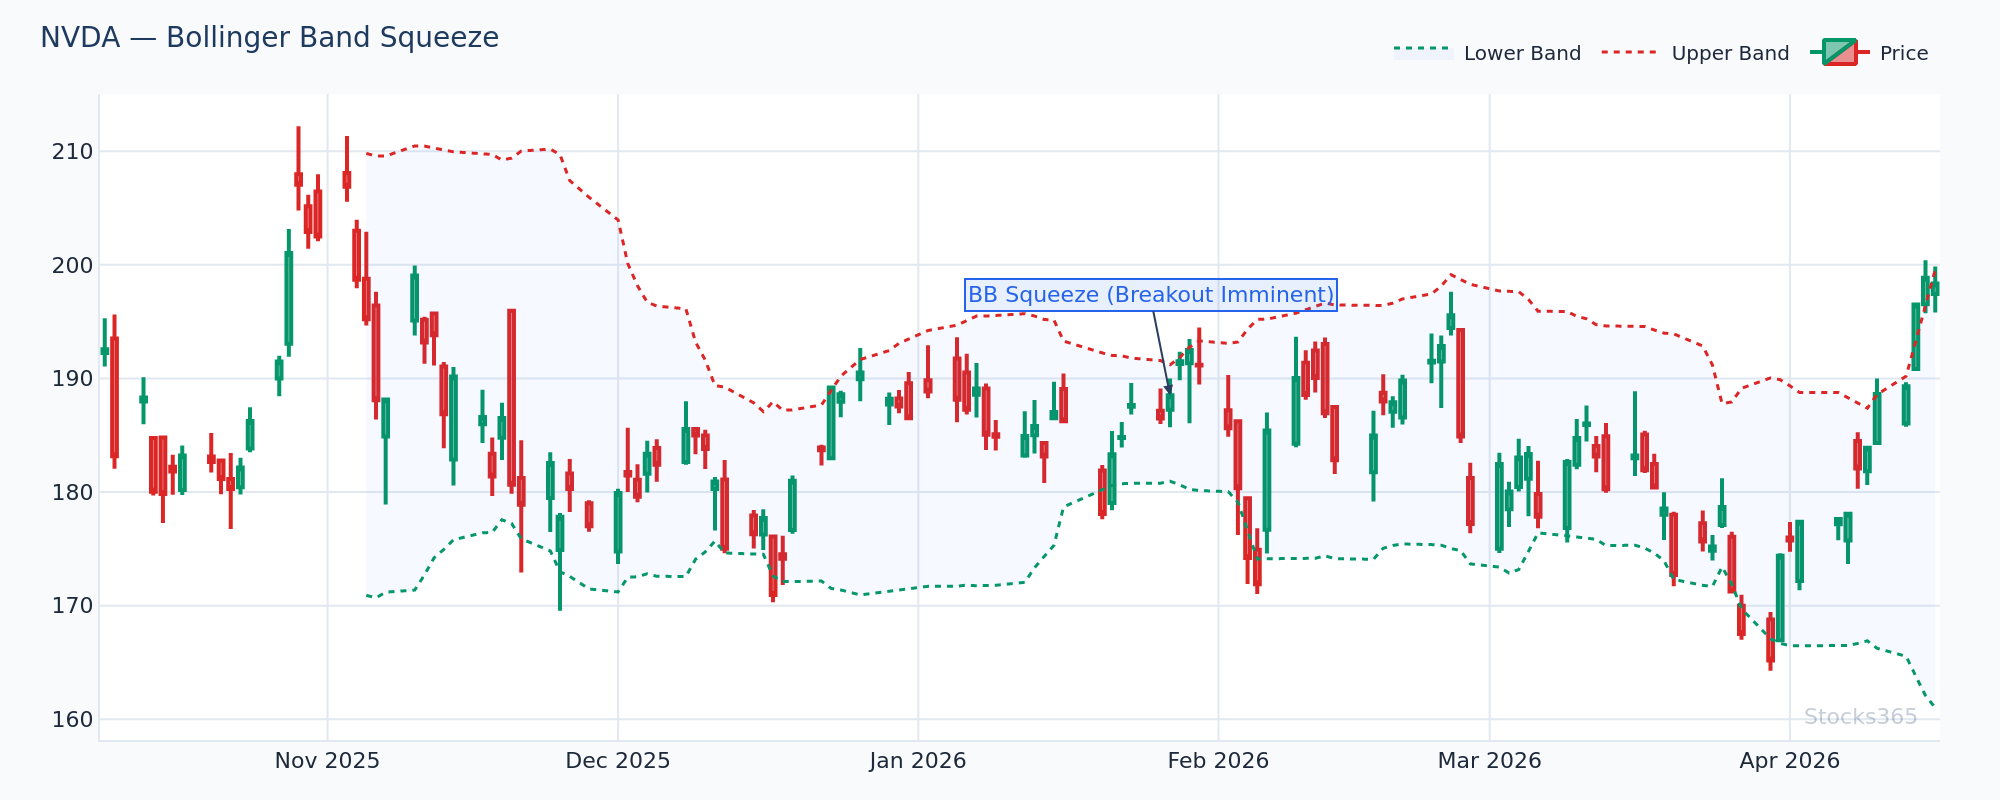
This chart shows NVDA's Bollinger Bands compressing over several weeks as the bandwidth reading falls toward its lowest levels in months. When bandwidth is this low, price has historically resolved with a sharp directional move — either a breakout above the upper band or a breakdown below the lower band. The first candle that closes outside the bands after a prolonged squeeze confirms the new trend direction; a failed close back inside within two sessions invalidates the setup.
The Bollinger Squeeze: The Most Powerful Setup
The Bollinger Squeeze is the crown jewel of bandwidth analysis. It occurs when bandwidth contracts to historically low levels — typically below the 20th percentile of its range over the past 125 trading days (roughly six months).
Here's the logic: markets alternate between periods of low volatility and high volatility. A prolonged squeeze doesn't mean nothing is happening — it means pressure is building. Think of a coiled spring. The longer and tighter the compression, the more violent the eventual release.
How to Identify a Valid Squeeze Setup
- Bandwidth drops to a multi-month low (below 20th percentile of its 125-day range)
- Price action tightens into a narrow range — Bollinger Bands visually pinch together
- Volume contracts alongside price (confirming lack of conviction in either direction)
- The 20-period SMA flattens out horizontally
The squeeze itself is not the signal. The breakout from the squeeze is the signal.
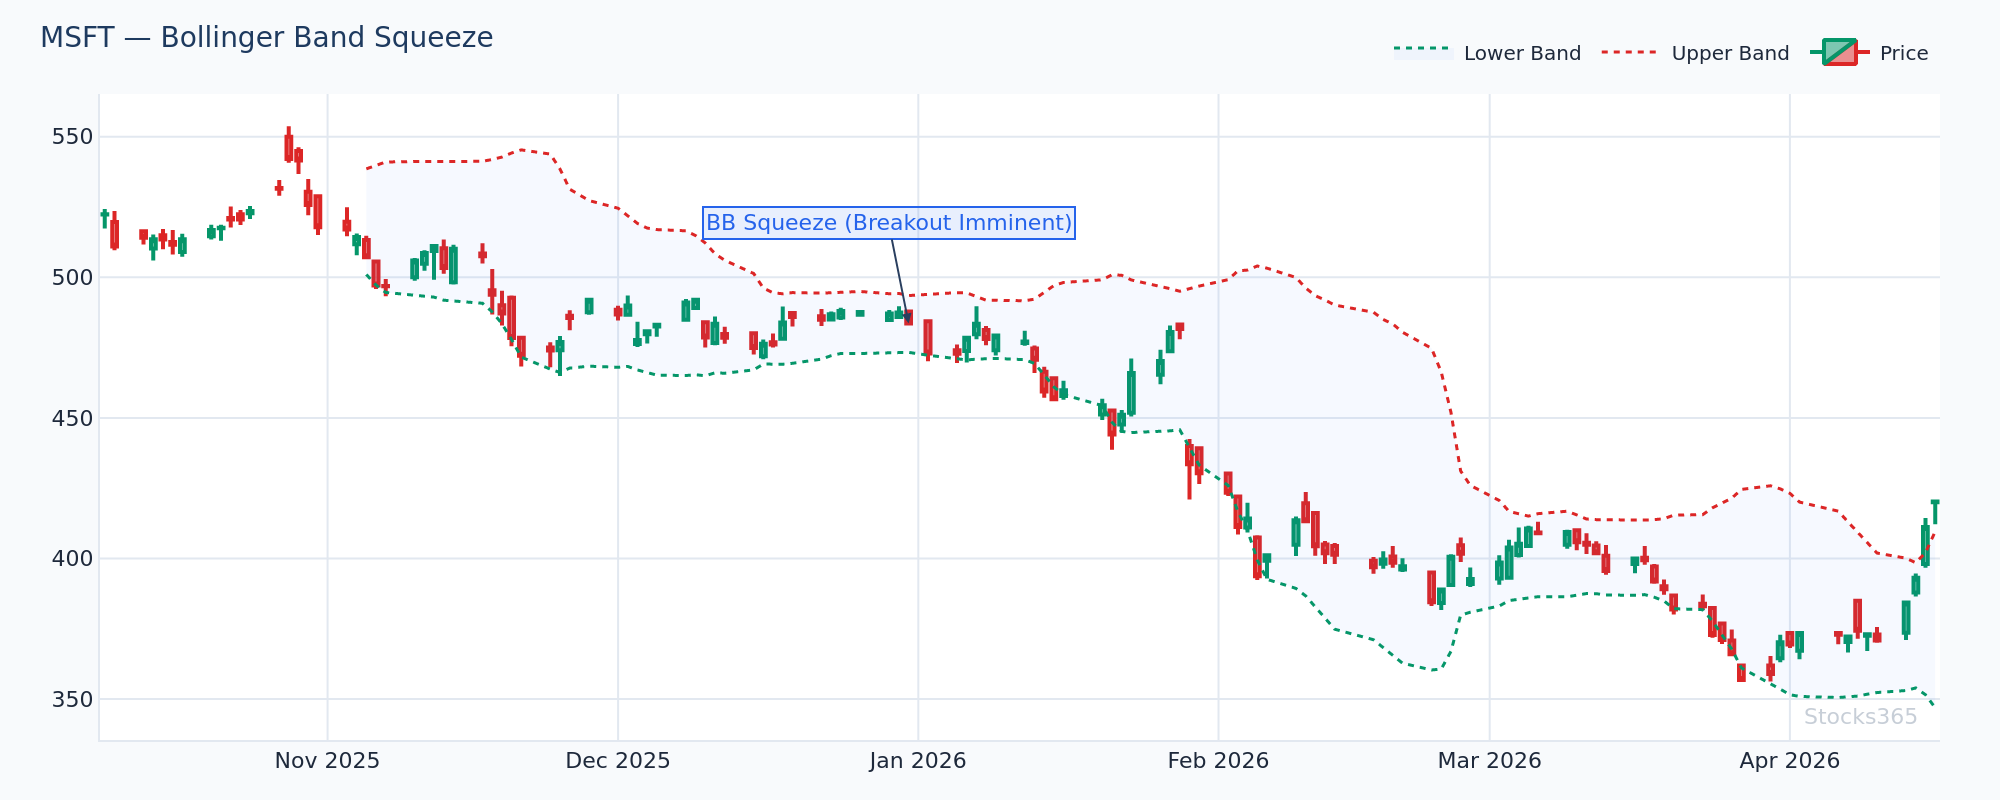
This setup on MSFT illustrates the classic squeeze-to-breakout sequence: weeks of bandwidth compression followed by an explosive candle that breaches the upper Bollinger Band on elevated volume. The breakout is confirmed when price closes above the upper band and holds there on the following session. A reversal back inside the bands within one to two candles signals a false breakout — exit quickly.
Here's What Most Traders Get Wrong
Most traders see a Bollinger Squeeze and immediately buy, assuming the breakout will be bullish. That's wrong. The squeeze predicts magnitude, not direction. A low-bandwidth compression can resolve violently to either the upside or downside. The edge is waiting for the breakout candle to declare direction — then entering in that direction with confirmation, not before. Jumping in during the squeeze is gambling. Entering after the breakout is trading.
Bollinger Bandwidth vs. Bollinger Bands: Key Differences
Bollinger Bands are plotted on the price chart. Bandwidth is a separate oscillator displayed below the price, similar to how RSI or MACD appear. This matters because:
- Bandwidth gives you a normalized, comparable reading across different instruments and timeframes
- You can objectively compare current bandwidth to historical bandwidth — something you can't easily eyeball from the bands themselves
- Bandwidth makes it easy to screen for squeezes across hundreds of tickers simultaneously
Think of Bollinger Bands as the map and Bandwidth as the compass.
Reading Bandwidth in Different Market Conditions
Trending Markets
In a strong uptrend, bandwidth typically rises as price accelerates. The upper band slopes upward, the lower band follows, and the gap between them widens. High bandwidth during a trend confirms strength — but also signals that the move may be maturing. When bandwidth peaks and begins rolling over in a trend, that's the early warning that momentum is fading.
Pairing bandwidth analysis with momentum indicators sharpens this. RSI approaching overbought territory while bandwidth rolls over from a peak is a powerful combination signal — the trend may be exhausting.
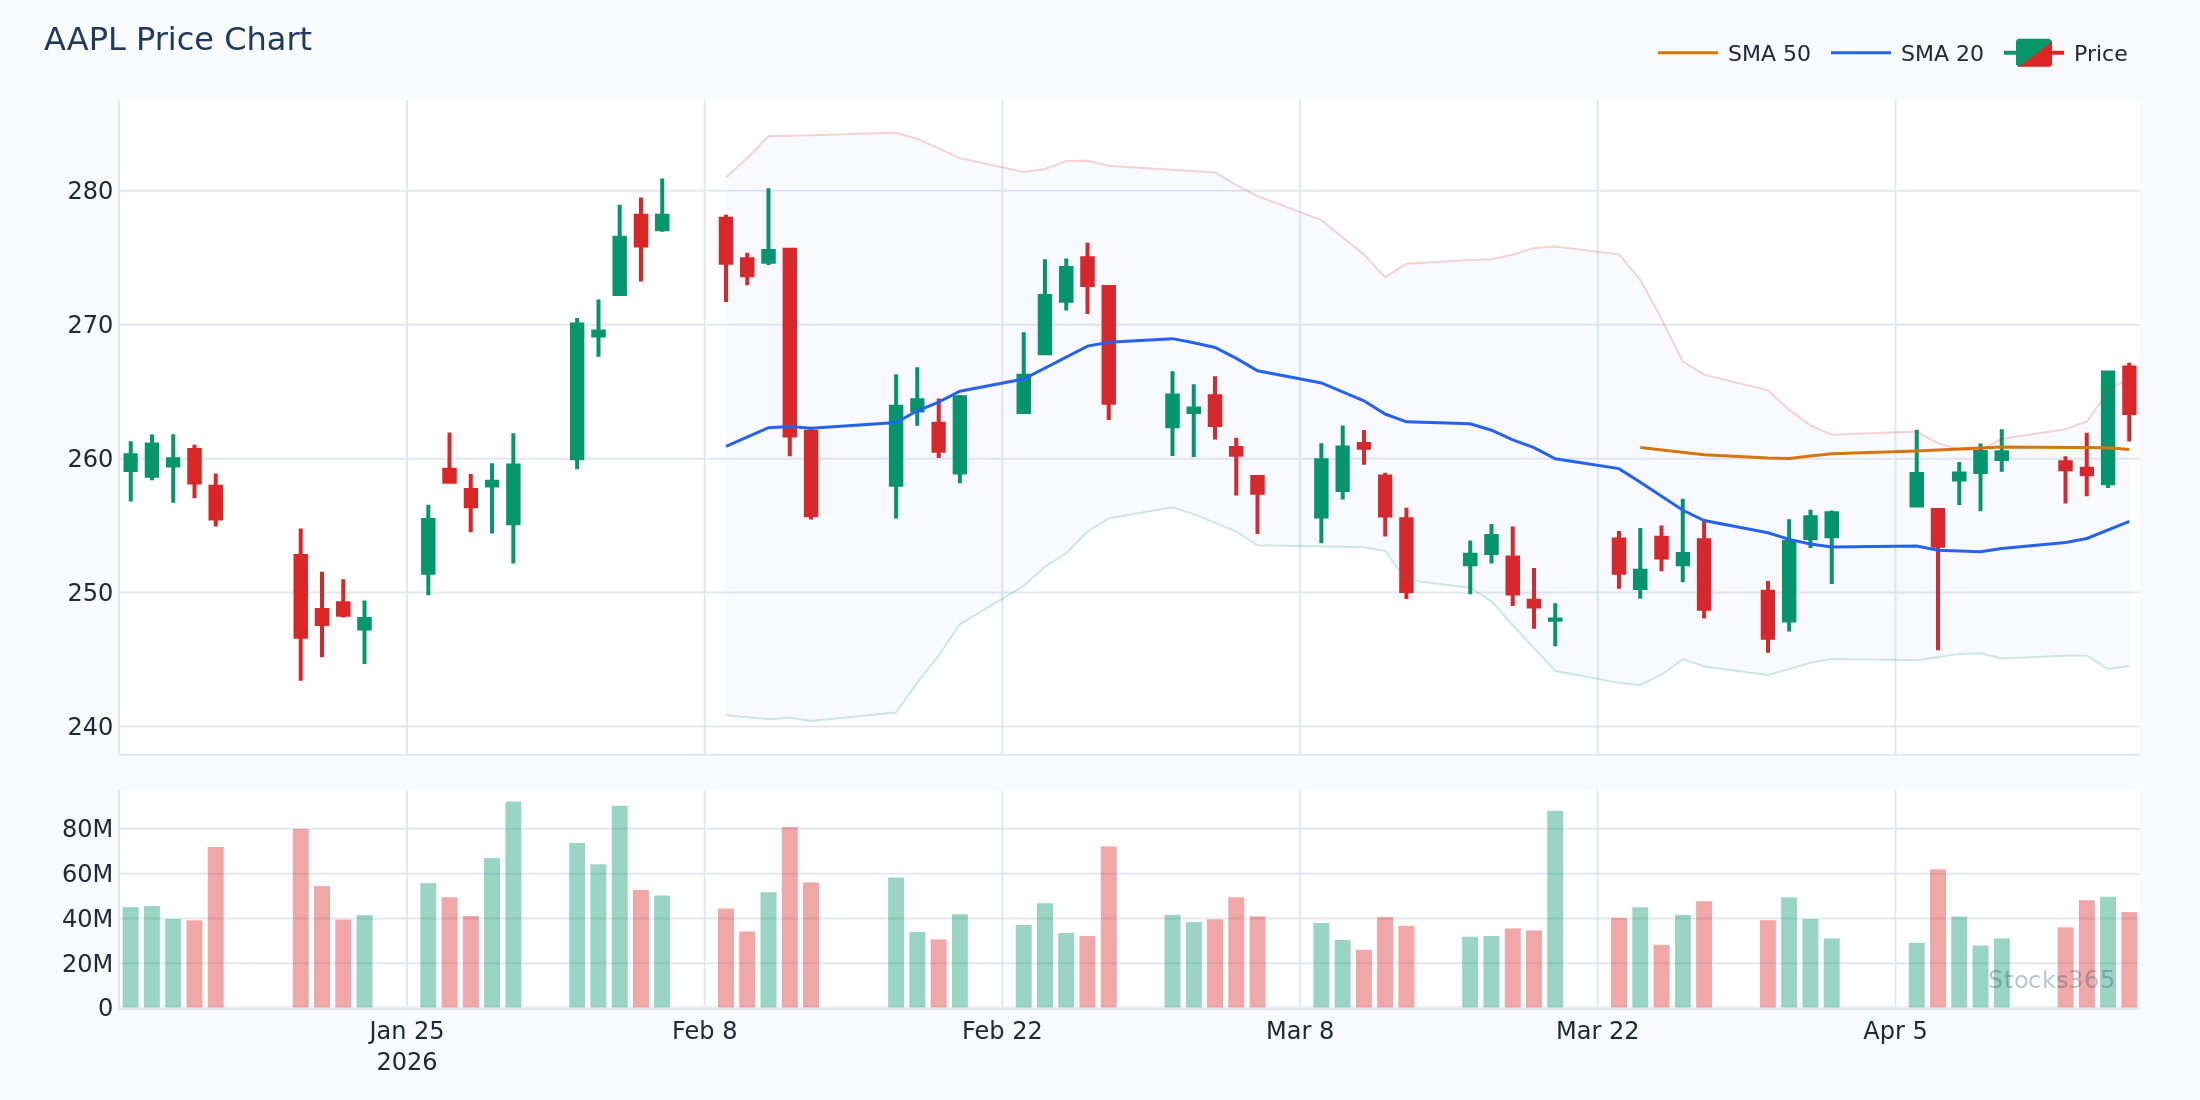
In this AAPL setup, bandwidth expands steadily as price trends higher along the upper Bollinger Band — a classic 'riding the band' pattern. The bandwidth peaks, then begins declining while price continues making marginal new highs. This divergence between bandwidth and price (bandwidth falling, price still rising) often precedes a pullback. Confirmation of a reversal comes when price closes back below the 20-SMA with rising volume.
Ranging Markets
In a sideways, choppy market, bandwidth stays low and relatively stable. There's no squeeze — just persistent low volatility. These are the worst conditions for breakout strategies. In ranges, mean-reversion approaches work better: selling near the upper band, buying near the lower band. Bandwidth helps you identify these regimes immediately rather than chasing false breakouts.
Post-Breakout Expansion
After a major breakout, bandwidth surges. This is the release of compressed energy. Bandwidth readings in the 80th percentile or higher suggest the market is in full expansion mode. New positions in the breakout direction can still work, but risk management tightens — high bandwidth means high volatility means larger swings in both directions.
Combining Bollinger Bandwidth With Other Indicators
Bandwidth is most powerful when used alongside complementary tools. It measures volatility but doesn't tell you about momentum, trend strength, or overbought/oversold conditions. That's why combining it with momentum oscillators creates high-quality setups.
Bandwidth + RSI
This is one of the most effective pairings in technical analysis. Use bandwidth to identify the squeeze (when to expect a big move), then use RSI to confirm the direction and strength of the breakout.
- Squeeze breakout to the upside + RSI crossing above 50 from below = bullish confirmation
- Squeeze breakout to the downside + RSI dropping below 50 = bearish confirmation
- Squeeze breakout upward + RSI already above 70 = caution, may be overextended immediately
Understanding how RSI is calculated helps you interpret its readings in context rather than treating it as a black box.
Bandwidth + Volume
Volume is the truth serum of technical analysis. A squeeze breakout with 2x average volume or higher is far more reliable than a breakout on thin volume. Low-volume breakouts fail at a much higher rate — the market hasn't genuinely committed to the new direction yet.
Bandwidth + Stochastic Oscillator
For identifying exhaustion at extremes, the Stochastic Oscillator pairs well with bandwidth. When bandwidth is high (volatility elevated) and Stochastic reaches overbought or oversold territory, it often signals the tail end of a volatile move. Understanding the differences between RSI and Stochastic helps you choose the right tool for each context.
Our analysis of 14,266 Bollinger Squeeze Breakout signals found a profit factor of 1.03 over a 10-day holding period — with crypto performing best at 51.8% win rate and forex performing worst at 47.1%. These numbers are modest on their own, but combining the squeeze breakout with volume confirmation and RSI alignment significantly improves selection quality. See the full dataset at Stocks365 Insights.
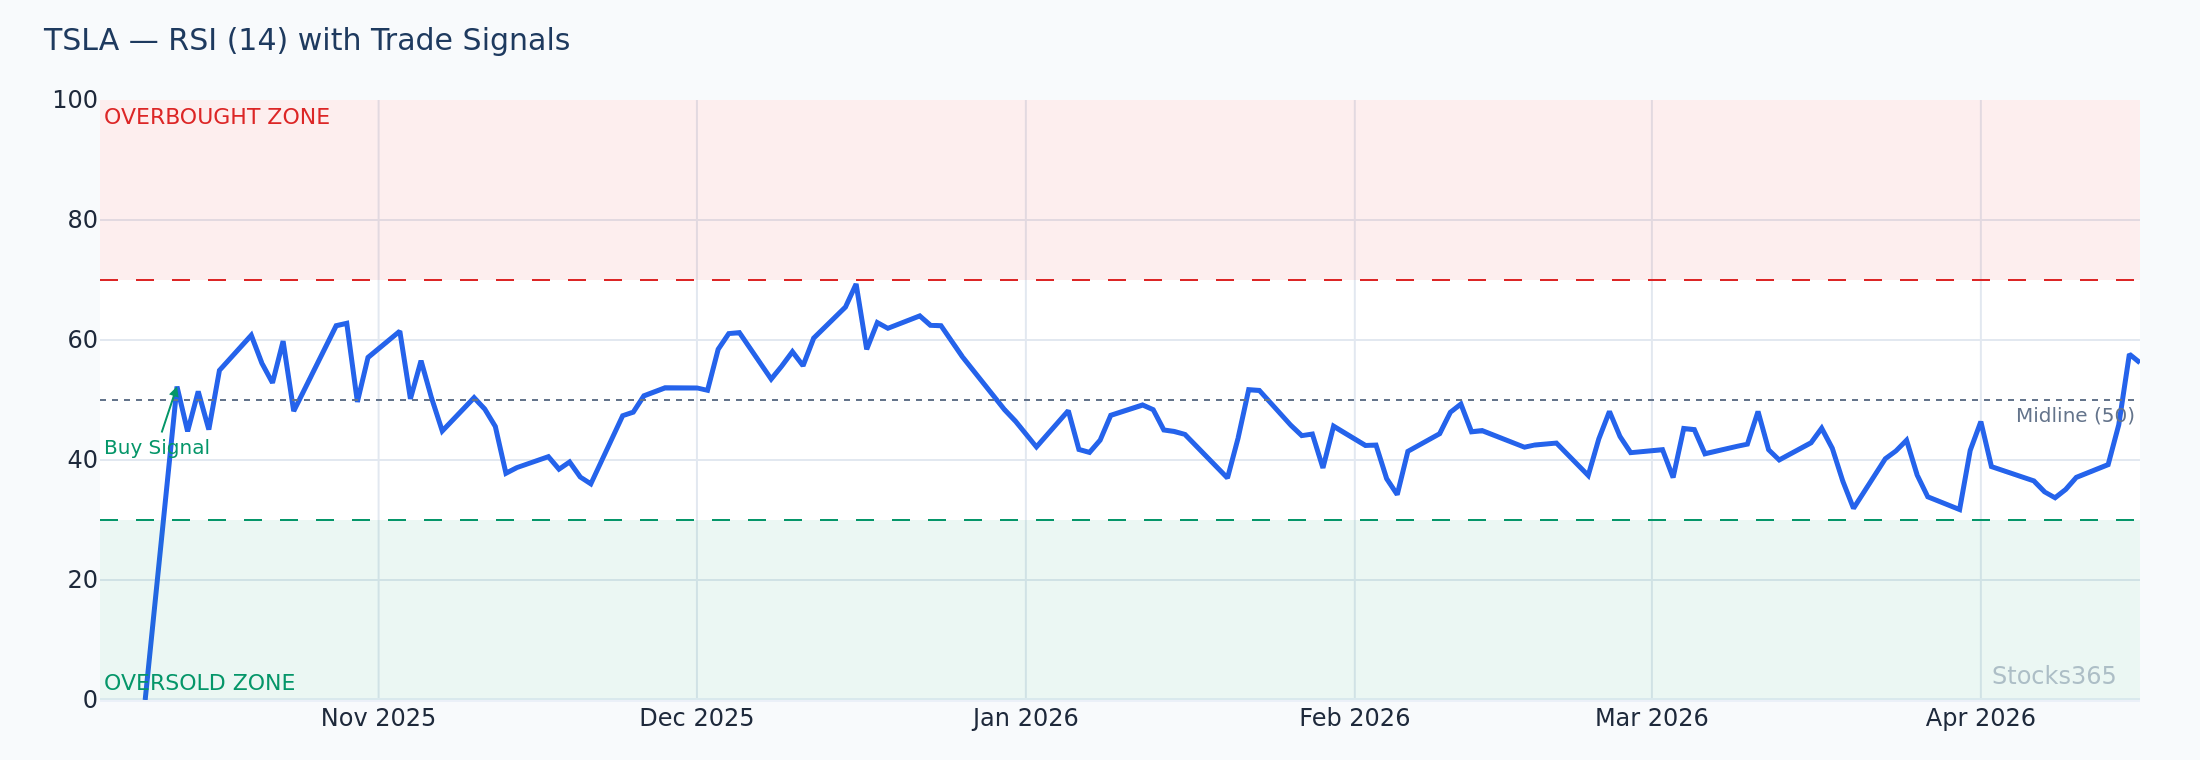
This chart shows a TSLA squeeze breakout where bandwidth expands sharply as price breaches the upper Bollinger Band. The RSI simultaneously crosses above the 55 level, confirming bullish momentum behind the move. When both signals align — bandwidth expanding from a squeeze and RSI confirming directional strength — the setup has materially higher conviction. The pattern is invalidated if RSI reverses back below 50 within the first two sessions of the breakout.
Practical Bollinger Bandwidth Trading Setups
Setup 1: The Classic Squeeze Breakout
Conditions: Bandwidth below 20th percentile of 125-day range. Price consolidating in a tight range. Volume declining. 20-SMA flat.
Entry trigger: Candle closes outside the Bollinger Band (upper for long, lower for short) with above-average volume.
Confirmation: Next candle continues in the breakout direction. RSI aligns with momentum (above 50 for longs, below 50 for shorts).
Exit signal: Bandwidth returns to its 60th percentile or higher, or price closes back inside the bands.
Setup 2: Bandwidth Divergence
This is an advanced pattern. Price makes a new high, but bandwidth is lower than during the previous high — meaning this new high was made on less volatility. That's a warning sign. It often precedes a pullback or reversal, especially when paired with RSI divergence signals.
Double divergence — bandwidth declining and RSI declining while price makes new highs — is one of the highest-quality reversal signals in technical analysis. Rare. Powerful when it appears.
Setup 3: Bandwidth Mean Reversion After Extremes
When bandwidth reaches extreme highs (above 80th percentile), markets often revert toward lower volatility. This creates a fading opportunity: sell strength near the upper band when bandwidth is at extremes and momentum shows signs of exhaustion. This is not a trend-following setup — it's a counter-trend, mean-reversion play and requires tighter risk management.
Stocks365 research across 3,255 Bollinger Upper Band Touch signals found only a 49.6% win rate with a profit factor of 0.88 over a 10-day holding period — crypto leads at 56.7% while commodities lag at 41.5%. This confirms that mechanically fading upper band touches without additional filters is a losing strategy. The edge comes from selectivity: pairing band touches with extreme bandwidth readings and momentum exhaustion signals. Full data available at Stocks365 Insights.
Bollinger Bandwidth Across Asset Classes
Bandwidth behavior varies meaningfully across different markets.
- Equities: Squeezes around earnings announcements are particularly powerful. Bandwidth compresses in the days before a report as traders wait for the catalyst, then explodes on the release.
- Crypto: Higher baseline volatility means bandwidth readings are naturally elevated compared to stocks. Squeezes in crypto tend to resolve faster and more violently. Check individual signals for real-time bandwidth readings on specific instruments.
- Forex: Major pairs during London/New York overlap hours see bandwidth spikes. Overnight sessions produce natural compressions. The squeeze breakout has historically been weakest in forex, consistent with the research data above.
- Commodities: Seasonal patterns and supply shocks drive volatility. Bandwidth tends to spike around major inventory reports or geopolitical events.
Common Bollinger Bandwidth Mistakes to Avoid
Low bandwidth doesn't mean a breakout is imminent. Markets can stay in low-volatility compression for weeks or even months. Patience is non-negotiable.
- Anticipating direction during the squeeze: Wait for the breakout candle. Every time.
- Ignoring volume on the breakout: A bandwidth expansion without volume is a warning sign, not a green light.
- Using bandwidth in isolation: Combine it with at least one momentum indicator and one volume confirmation before committing.
- Forgetting timeframe context: A squeeze on the daily chart is far more significant than a squeeze on a 5-minute chart. Higher timeframe squeezes produce larger moves.
- Overtrading after a breakout: Once bandwidth expands significantly, the easy money is made. Chasing entries deep into an expansion is low-probability.
What to Watch For
- Bandwidth approaching multi-month lows on high-cap tech stocks: When bandwidth drops below the 20th percentile of its 125-day range on stocks like those in the Stocks365 signals dashboard, monitor closely for the first candle that closes outside the bands on volume 1.5x above the 20-day average — that's your entry trigger.
- Double divergence setups: When price makes a new swing high but both bandwidth and RSI are lower than their previous swing highs, a reversal setup is forming. Watch for a close back below the 20-SMA to confirm the pattern is activating.
- Pre-earnings squeezes: In the five to seven sessions before a major earnings release, bandwidth naturally compresses. The post-earnings expansion is one of the most reliable volatility events of the year — but direction requires fundamental alignment, not just bandwidth analysis.
- Crypto bandwidth squeezes during weekend consolidation: Crypto markets frequently enter low-bandwidth compression during weekend sessions. When the Monday open brings a bandwidth expansion candle above the 20th percentile, that often sets the directional tone for the week.
- Bandwidth rollover after trend highs: In extended uptrends, watch for bandwidth to peak and decline while price makes marginal new highs. Pairing this with hidden RSI divergence creates a high-quality trend exhaustion signal.
How Stocks365 Uses Bollinger Bandwidth
Bollinger Bandwidth is one of 12+ indicators integrated into the Stocks365 Trust Score system. Specifically, it feeds into the volatility regime scoring component — one of the core dimensions the platform uses to assess signal quality.
When bandwidth is in a squeeze (below the 20th percentile), Stocks365 flags instruments as being in a volatility compression regime. Breakout signals generated during or immediately after this regime receive higher weighting in the overall Trust Score, because the evidence supports an upcoming expansion. Conversely, signals generated when bandwidth is already at extreme highs receive lower weighting — the easy part of the move has likely already occurred.
This means when you browse signals on the Stocks365 dashboard, the Trust Score already incorporates whether the current bandwidth environment supports or undermines each signal's probability of success. You're not just seeing a raw indicator reading — you're seeing it contextualized against regime, momentum, and historical performance. That's the difference between a signal and an edge.
| # | Strategy | Type | Win Rate | Sharpe | PF | N | Status |
|---|---|---|---|---|---|---|---|
| #1 | Bollinger Squeeze Breakout | volatility | 49.5% | 0.04 | 1.03 | 14,266 | TEST |