
Full Stochastic Oscillator vs Slow Stochastic: The Real Difference That Matters
Most traders pick one and never look back. That's a mistake.
The full stochastic oscillator and the slow stochastic are not interchangeable tools — they serve different trading styles, different timeframes, and different market conditions. Knowing which to use, and when, separates reactive traders from deliberate ones. Stocks365 backtested 9,257 stochastic overbought signals across multiple asset classes and found a 48.8% win rate overall — with massive variance depending on configuration and asset type. That gap is where your edge lives.
Let's break this down properly.
Understanding the Stochastic Oscillator Family
Before you can compare full vs. slow, you need to understand where they both come from. For a deep dive into the underlying math, read our guide on how the stochastic oscillator works and its formula explained.
The stochastic oscillator, developed by George Lane, measures where the current closing price sits relative to the high-low range over a set lookback period. It produces two lines — %K (the fast line) and %D (the signal line, a moving average of %K).
There are three versions:
- Fast Stochastic: Raw %K with a simple 3-period SMA as %D. Extremely reactive. Generates a lot of noise.
- Slow Stochastic: The fast %D becomes the new %K. A second smoothing is applied. Reduces noise significantly.
- Full Stochastic Oscillator: A fully customizable version where you control the %K period, %K slowing, and %D period independently. Maximum flexibility.
The slow stochastic is essentially a preset version of the full stochastic. When you set the full stochastic to (14, 3, 3) — 14-period lookback, 3-period internal smoothing, 3-period %D — you get the same output as the slow stochastic. That's the default most platforms ship with.
Full Stochastic Oscillator: What Makes It Different
Control. That's the answer.
The full stochastic oscillator gives you three independent parameters:
- %K Period: The raw lookback window (how many bars you examine)
- %K Slowing: Internal smoothing applied before %D calculation
- %D Period: The signal line smoothing
This matters because different markets require different sensitivity. Forex pairs during a trend phase need a smoother, more patient signal. Crypto during a volatile breakout phase might reward a tighter, more reactive configuration. The full stochastic lets you tune for both.
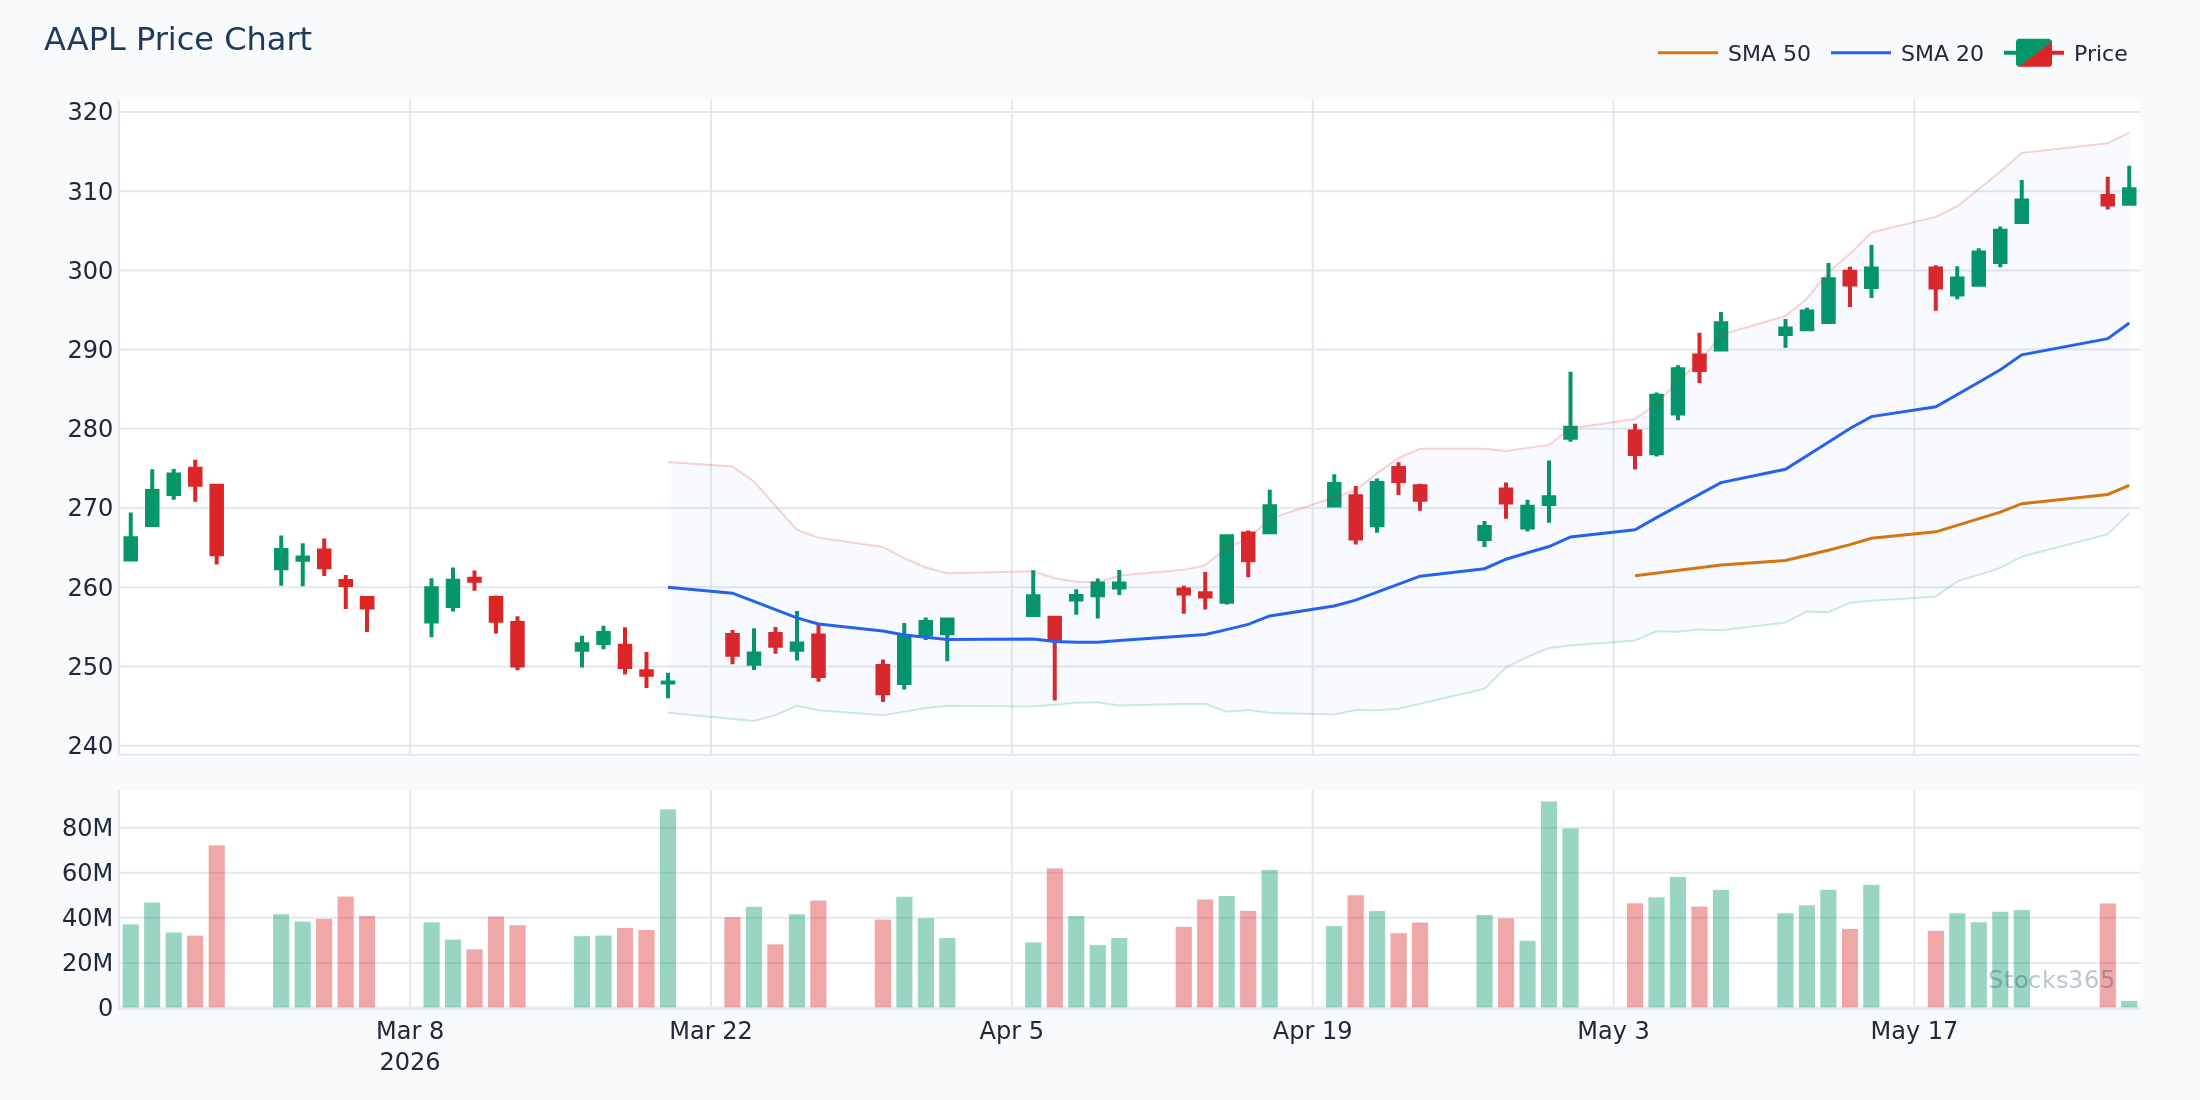
This chart compares a standard full stochastic configuration against a faster variant on the same price action. Notice how the tighter %K slowing produces earlier crossovers — sometimes catching the move sooner, sometimes whipsawing into false signals before the real move begins. When price is consolidating near a support zone and the slower configuration crosses up from below 20, that alignment with price structure is the confirmation. A move back below the %K crossover invalidates the setup.
Slow Stochastic: Simplicity as a Feature
The slow stochastic isn't inferior — it's opinionated.
By fixing the smoothing parameters, the slow stochastic removes a decision point. For traders who want consistency, that's valuable. The slow stochastic (14, 3, 3) has been validated across decades of market data. It's the lingua franca of stochastic analysis. When you read about stochastic signals in most textbooks or see them discussed in market commentary, they're almost always referencing the slow stochastic default settings.
The practical upside: no optimization creep. Every time you tweak parameters to match recent historical data, you risk overfitting — the signals look great in the past but fail forward. The slow stochastic's fixed parameters act as a forcing function against that habit.
For a step-by-step guide to reading stochastic signals regardless of version, see how to read the stochastic oscillator.
Here's What Most Traders Get Wrong
Most traders treat any stochastic reading below 20 as an automatic buy signal. In a downtrend, stochastics can grind below 20 for days — sometimes weeks — while price continues lower. The real edge isn't the oversold reading itself. It's watching for the %K line to cross back above %D while both are still below 20, combined with a higher-low structure in price. That combination — momentum inflection plus price structure — is what actually signals the turn. The oversold number alone is just noise in a trending environment.
When the Full Stochastic Oscillator Outperforms
The full stochastic wins in specific conditions. Recognize them.
Ranging, Mean-Reverting Markets
When price is oscillating between defined support and resistance, a tighter full stochastic configuration captures turns faster. Using a shorter %K slowing — say (14, 1, 3) — you get near-fast-stochastic sensitivity without the full noise penalty. In a well-defined range, that early signal translates to a better entry price.
Multi-Timeframe Analysis
The full stochastic shines when you're aligning signals across timeframes. On the weekly chart, run a slower configuration (21, 5, 3) to identify the macro momentum state. On the daily, run the standard (14, 3, 3). On the 4-hour, run a tighter (9, 2, 3). When all three align — weekly above 50, daily crossing up from oversold, 4-hour already rising — you have a layered, high-conviction setup that no fixed-parameter indicator can replicate as cleanly.
Adaptive Volatility Environments
Markets change character. A full stochastic oscillator configured with an ATR-scaled %K period can adapt as volatility expands and contracts. This is advanced usage, but it's why professional algorithmic traders almost exclusively use the full stochastic over the slow version.
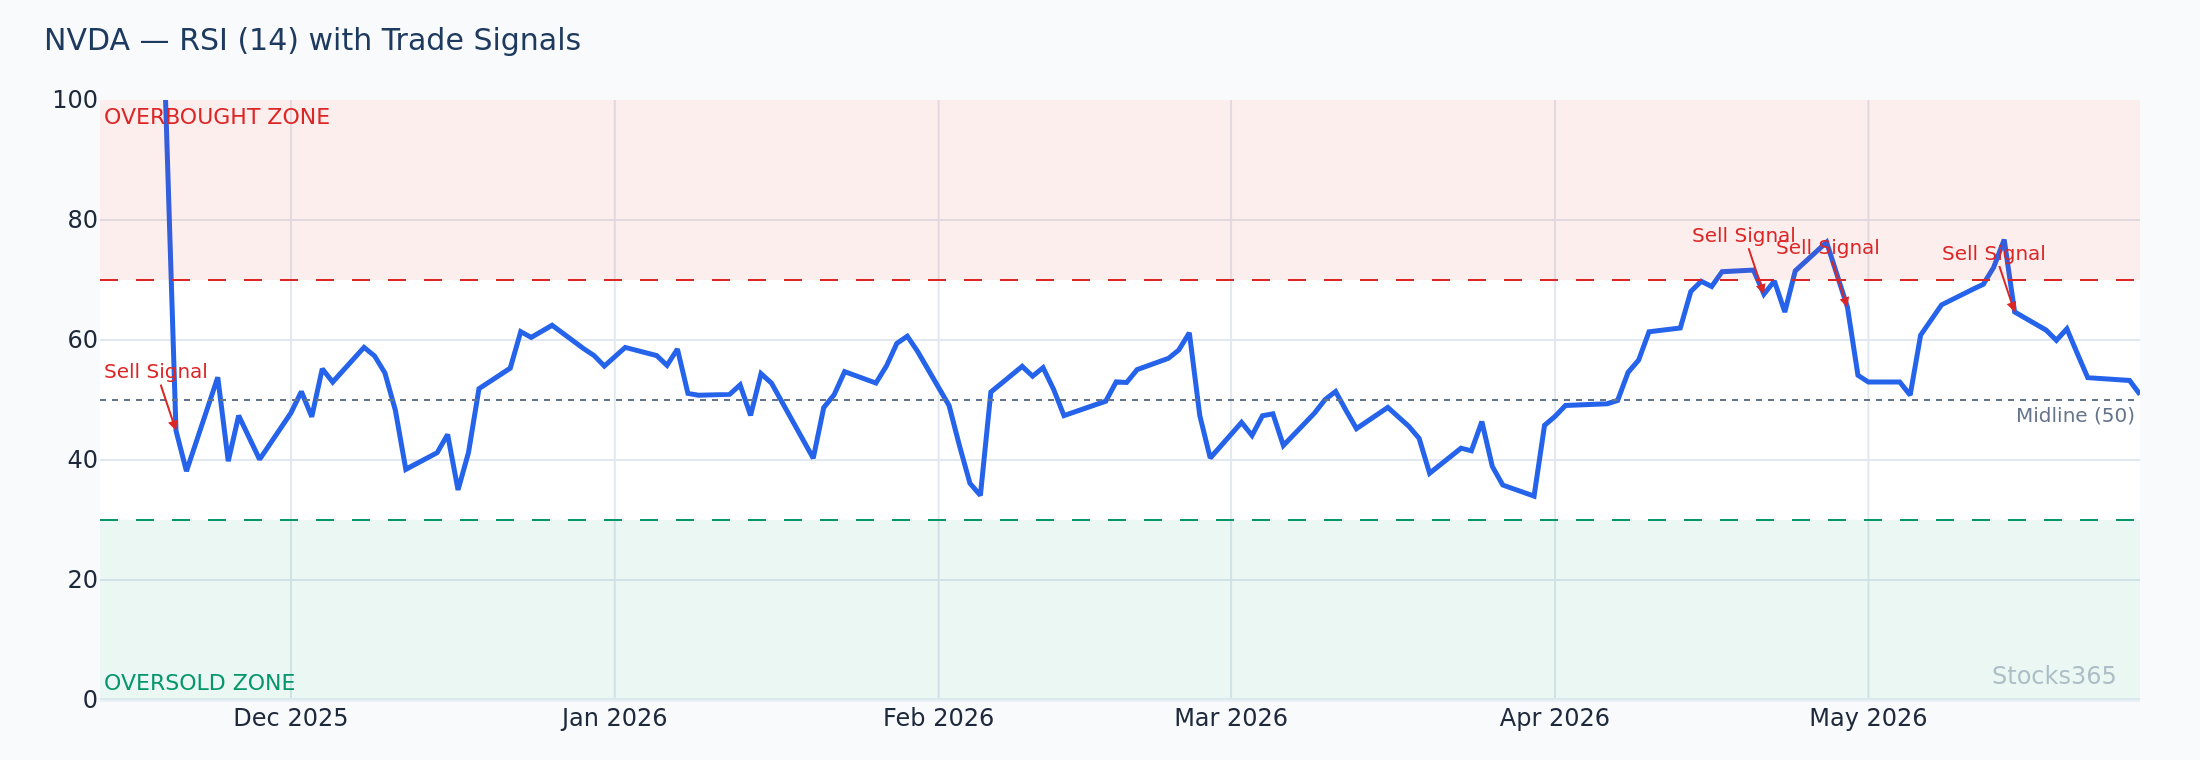
This setup shows a full stochastic %K crossing above %D from below 20 at the same time RSI is recovering from the 30 level. When both momentum indicators confirm recovery simultaneously, the probability of a sustained bounce increases substantially. Price breaking back above the 20-period SMA after this dual confirmation is the entry trigger. If the stochastic crosses back below %D before price clears the 20-SMA, the setup fails — exit immediately.
When the Slow Stochastic Holds Its Own
Don't dismiss the slow stochastic. It earns its keep.
Trending Markets With Pullbacks
In a strong uptrend, the slow stochastic's built-in smoothing prevents premature entries during shallow pullbacks. The slow version stays oversold longer, giving trend-following traders a better-defined low-risk entry zone rather than chasing the first flicker of recovery. Combined with a triple moving average strategy for trend confirmation, slow stochastic pullback entries in trending conditions are among the most reliable setups in technical analysis.
Beginners and Systematic Traders
Consistency beats optimization for most retail traders. If you're building a rule-based system, the slow stochastic's fixed parameters mean your backtests are honest — there are no parameter choices to second-guess after a losing streak. That psychological simplicity has real value.
Higher Timeframe Swing Trades
On weekly charts, the slow stochastic's smoothing is appropriate by default. The chart noise that makes fast settings problematic on daily or intraday charts is already filtered by the higher timeframe itself. The slow stochastic on a weekly stock chart has an almost clean, clinical look — clear oversold zones, clear crossovers, clear divergences.
The Numbers: What Backtesting Actually Shows
Our research dashboard surfaces something important about stochastic signals that most traders never examine: the direction of the signal matters far more than the indicator version.
Stocks365 backtested 8,204 stochastic oversold signals across a 10-day holding period and found a 54.7% win rate with a profit factor of 1.24. Stochastic overbought signals — the same setup in reverse — showed only a 48.8% win rate with a profit factor of 0.86 across 9,257 signals. Same indicator family. Dramatically different edge.
The asset class breakdown sharpens this further. For oversold signals, forex led at 57.0% win rate — consistent with the mean-reverting nature of currency pairs. Crypto lagged at 48.9%, reflecting the tendency of crypto assets to stay oversold during sustained capitulation phases. For overbought signals, the results flip: crypto performed best at 58.9%, driven by momentum-heavy breakout rallies where overbought readings persist far longer than in other markets.
The takeaway: the full stochastic vs. slow stochastic debate matters less than understanding which direction of signal you're trading, in which asset class, under which market regime.
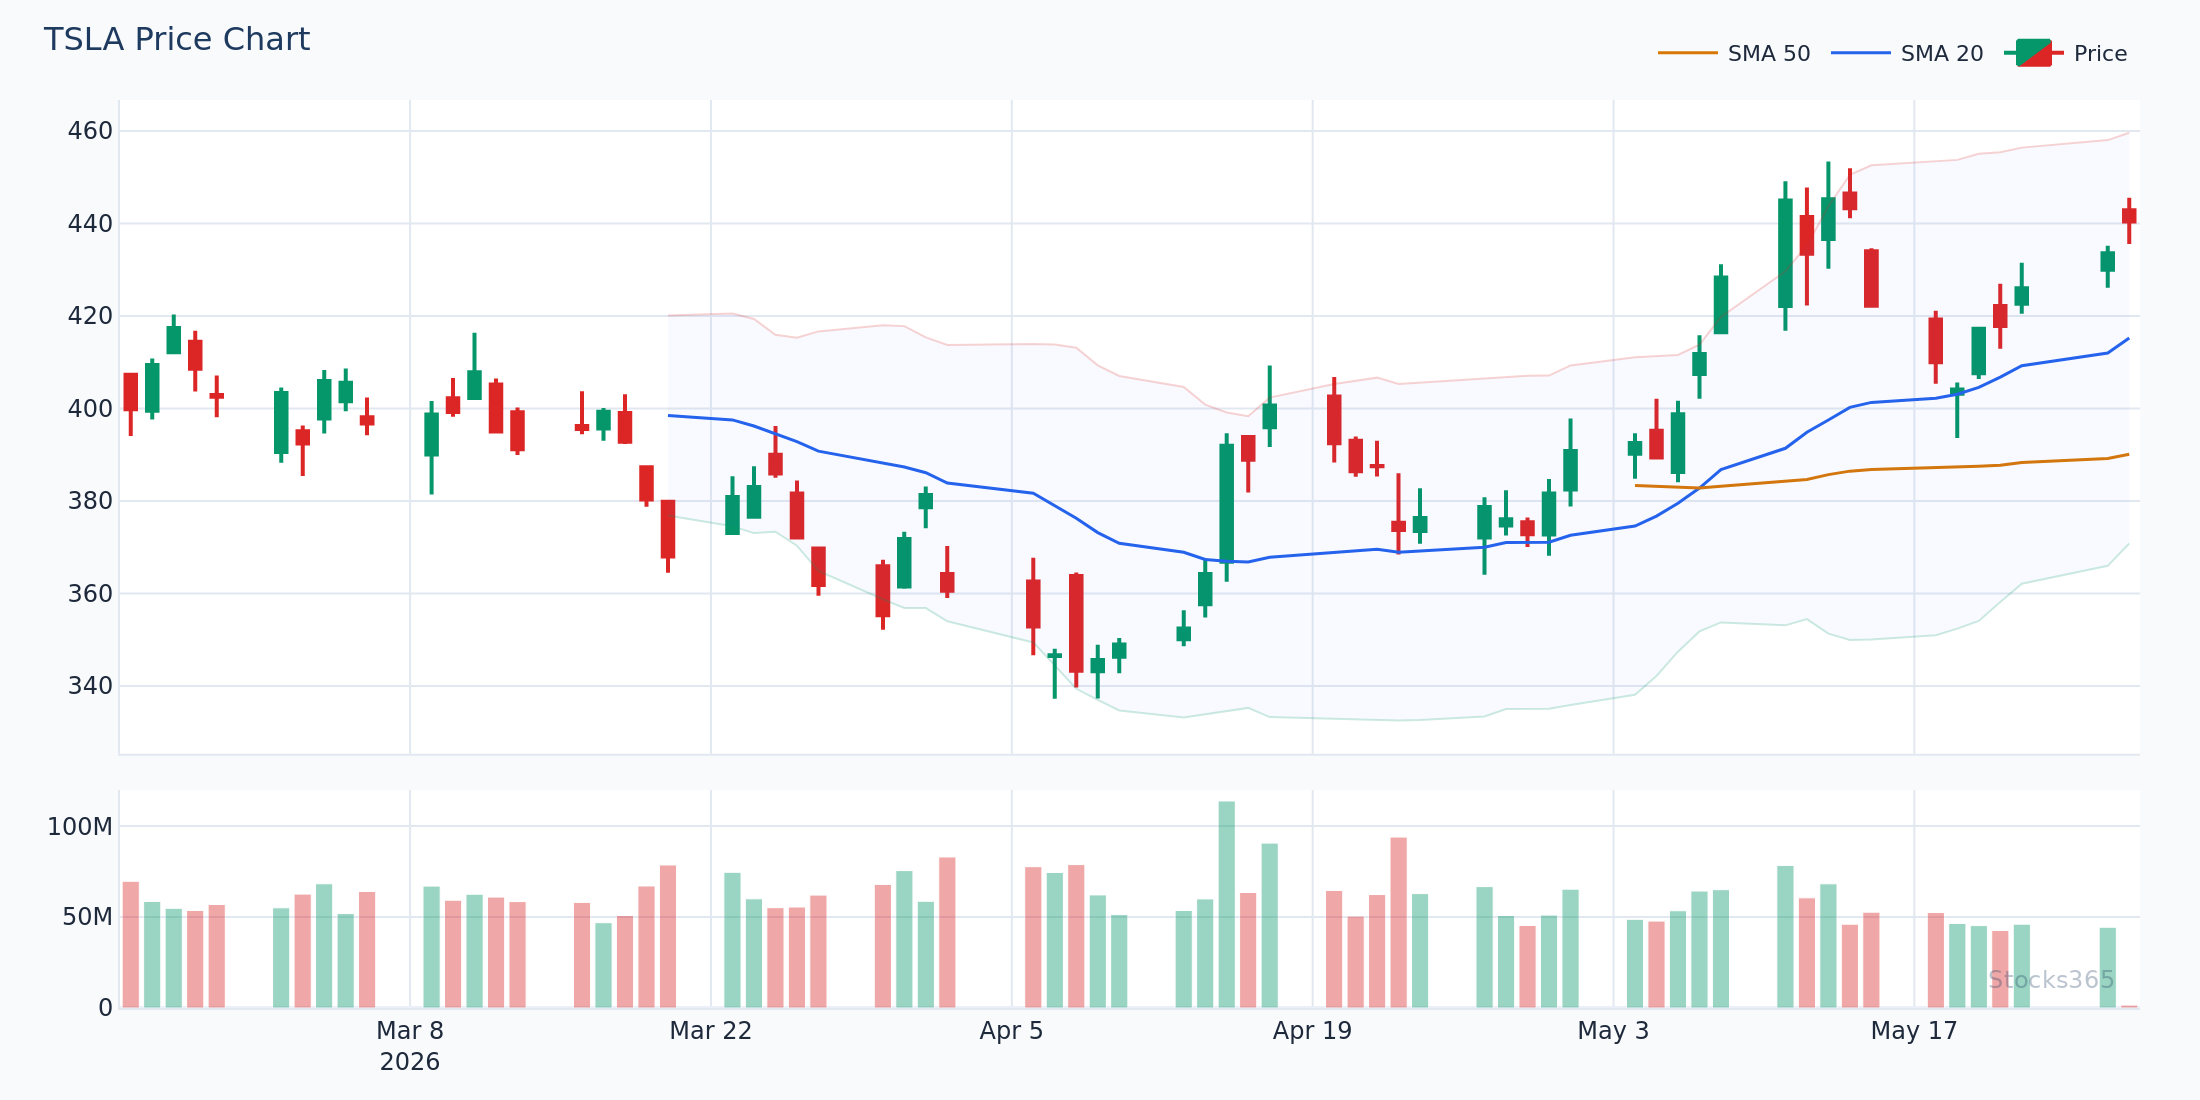
This pattern shows price pulling back into a prior support zone while the slow stochastic drops below 20 and then prints a bullish %K/%D crossover. Volume declining on the pullback and then picking up on the recovery bar is the volume confirmation pattern. If price breaks below the prior swing low after the crossover, the setup is invalidated — the 'support zone' was not genuine demand.
Full Stochastic Oscillator Parameters: A Practical Guide
If you're switching to the full stochastic, start here.
Standard Settings (Equivalent to Slow Stochastic)
- %K Period: 14
- %K Slowing: 3
- %D Period: 3
Use this as your baseline. Don't deviate without a clear reason.
Faster Configuration (Range-Bound Markets)
- %K Period: 9
- %K Slowing: 1
- %D Period: 3
More responsive. More false signals. Works well in tight, defined ranges with high-probability support and resistance levels.
Slower Configuration (Strong Trend Environments)
- %K Period: 21
- %K Slowing: 5
- %D Period: 5
Significantly fewer signals. Higher quality in trending markets. Pairs naturally with moving average crossover strategies for trend confirmation.
Combining Stochastics With Other Indicators
Neither version works best in isolation.
The most powerful stochastic setups come from confluence. When a full stochastic oversold crossover aligns with an RSI trendline break, a Bollinger Band touch, or a moving average support level, the signal quality improves substantially. Our analysis of BB + Stochastic double oversold combinations — where price touches the lower Bollinger Band while stochastics are simultaneously below 20 — found a 58.9% win rate across 2,501 signals with a profit factor of 1.61. That's meaningfully better than either indicator alone.
For building these confluence setups, explore the Moving Average + Bollinger Bands Complete Strategy Guide. For understanding how momentum indicators interact, the RSI trendline strategy guide covers pattern recognition that transfers directly to stochastic analysis.
Stochastics also complement MACD well on longer timeframes. When stochastics signal oversold in the direction of a MACD histogram that's turning up, you have momentum confirmation at two different cycle lengths. See how this plays out in currency markets in the MACD in Forex Trading guide.
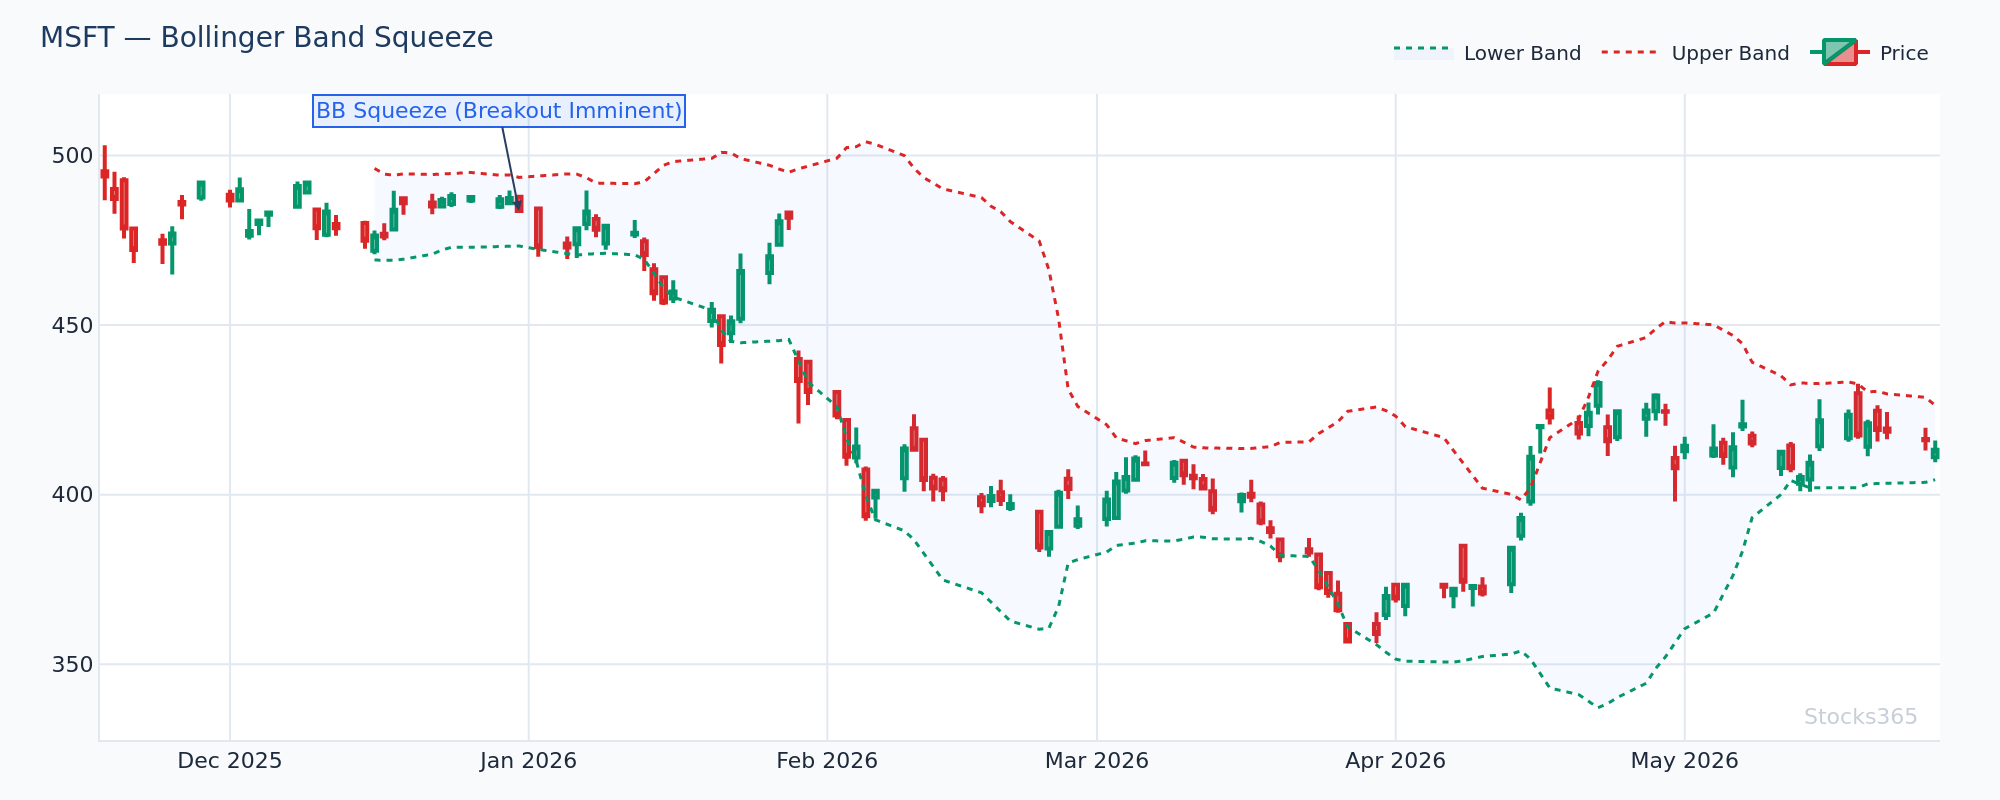
This confluence setup shows price touching the lower Bollinger Band while the full stochastic prints a %K crossover above %D from below 20. The Bollinger Band provides the price-based exhaustion signal; the stochastic provides the momentum recovery confirmation. Both must be present simultaneously. If price touches the lower band but the stochastic crossover doesn't materialize within 2-3 bars, the band touch alone is insufficient — wait for momentum to confirm.
What to Watch For
- Full stochastic oversold crossovers in forex pairs during Asian session consolidation: When a (14, 3, 3) full stochastic crosses up from below 20 during low-volatility consolidation before the London open, the subsequent session expansion frequently aligns with the stochastic direction — especially when price is holding above a key session VWAP.
- Slow stochastic divergence on weekly charts after a 15%+ equity drawdown: When price makes a lower low but the slow stochastic makes a higher low on the weekly timeframe, this positive divergence has historically preceded multi-week recovery sequences. Require a confirmed weekly close higher before acting.
- Full stochastic overbought persistence in crypto momentum regimes: When crypto assets enter strong trend phases and the full stochastic stays above 80 for three or more consecutive periods on the daily chart, fade signals are dangerous — watch for the first definitive cross back below 80 as the regime-change alert rather than acting on the overbought reading itself.
- Dual-timeframe full stochastic alignment in stock breakouts: When both the daily and 4-hour full stochastic oscillators cross above 50 simultaneously — not just from oversold, but mid-range — and price is breaking above a multi-week consolidation, the move tends to extend further than single-timeframe signals suggest.
- Stochastic + RSI double oversold on large-cap stocks after sector rotation: When a sector experiences rapid rotation-driven selling and both stochastic and RSI hit extreme oversold simultaneously on the same bar, the recovery tends to be sharp. Check the Stocks365 signal page for real-time confluence alerts on large-cap names.
How Stocks365 Uses This
Stocks365 Trust Score Integration
The full stochastic oscillator is one of 12+ indicators feeding the Stocks365 Trust Score system. Specifically, stochastic readings contribute to the momentum agreement component of the score — measuring whether multiple momentum indicators (stochastic, RSI, MACD histogram) are pointing in the same direction at the same time.
When the full stochastic oscillator (14, 3, 3) generates an oversold crossover signal while the Trust Score's momentum agreement component is above the 60th percentile, the signal is flagged as high-confidence. When stochastic and RSI diverge — one oversold, one not — the Trust Score reflects that disagreement and reduces the signal confidence weighting accordingly.
You can see these live confluence ratings on the Stocks365 signals dashboard, where every signal displays its momentum agreement score alongside the raw stochastic reading.
Key Takeaways
Full Stochastic Oscillator vs Slow Stochastic — Summary
- The full stochastic oscillator is a customizable version; the slow stochastic is a fixed preset of the same family
- At default settings (14, 3, 3), both produce identical output — the difference only emerges when you change parameters
- Full stochastic wins in multi-timeframe analysis, adaptive volatility environments, and range-bound markets where tighter settings improve entry timing
- Slow stochastic wins for consistency, simplicity, trend-pullback trading, and avoiding optimization bias
- Oversold signals carry a meaningful edge (54.7% win rate, 1.24 profit factor) — overbought signals do not (48.8%, 0.86 profit factor) across Stocks365 backtesting
- Asset class matters: oversold signals work best in forex (57.0%); overbought signals work best in crypto (58.9%)
- Confluence with Bollinger Bands significantly improves performance — double oversold setups hit 58.9% win rate with a 1.61 profit factor
- Neither version works reliably in isolation — always seek confluence with price structure and at least one additional indicator