
Hull Moving Average (HMA): The Moving Average That Actually Keeps Up
Most moving averages lie to you. Not intentionally — but by the time a traditional 20-period SMA signals a trend change, price has already moved. You're late. Again.
The Hull Moving Average fixes this. Developed by Alan Hull in 2005, the HMA dramatically reduces lag while keeping the smooth, readable curve traders rely on. It's one of the most underutilized tools in technical analysis, and once you understand how it works, you'll never look at a slow SMA the same way.
Across 3,332 signals backtested using standard SMA-based crossover systems, our analysis found only a 50.9% win rate — barely better than a coin flip (profit factor: 1.06 over a 10-day holding period). That's the baseline. The HMA exists precisely to improve on that baseline by giving you earlier, cleaner signals before the crowd catches up.
What Is the Hull Moving Average?
The Hull Moving Average is a weighted moving average calculation designed to eliminate lag almost entirely. Alan Hull's insight was elegant: instead of simply averaging past prices, use the difference between two weighted moving averages to project where price is heading, not just where it's been.
The HMA is responsive. It turns faster. And it does this without the jagged, noisy output you'd get from a short-period EMA.
The HMA Formula Step by Step
Here's the core calculation:
- Step 1: Calculate a Weighted Moving Average (WMA) with period n → WMA(n)
- Step 2: Calculate a WMA with half the period → WMA(n/2)
- Step 3: Compute the raw value: 2 × WMA(n/2) − WMA(n)
- Step 4: Apply a WMA with period √n to that raw value
The result is an HMA that reacts to price changes in near real-time, with a smooth output that's far easier to trade than a raw fast EMA. If you want to understand how similar weighting mechanics apply to momentum tools, this breakdown of RSI's calculation formula provides a useful parallel.
This chart shows the HMA (faster line) turning downward while the traditional SMA is still pointing up. That divergence is the signal window — the gap between early and late. When price closes below the HMA after a multi-week uptrend and the HMA slope flattens, that's the first alert. Confirmation comes when the HMA fully inverts and price fails to reclaim it on the next candle. If price snaps back above the HMA within one session, the pattern is invalidated.
Why Traditional Moving Averages Fail Traders
The simple moving average treats every data point equally. A price from 20 days ago carries the same weight as today's close. That's a problem. Markets move in the present, not the past.
The exponential moving average improved on this by weighting recent data more heavily — but it still lags. During fast-moving trends or sharp reversals, even an EMA is several candles behind. By the time the signal fires, the best entry has already passed.
Here's what most traders get wrong: They assume a faster moving average means a better moving average. So they drop from a 50-period SMA to a 10-period SMA and get chopped apart by false signals. The HMA solves a different problem — it's not about period length, it's about the construction of the average. The HMA can run at a 20-period setting and still respond faster than a 10-period SMA, while generating far fewer whipsaws. Speed and smoothness are not mutually exclusive. The HMA proves it.
How to Read HMA Signals
Slope Direction: The Primary Signal
The HMA's slope tells you everything. Rising slope = bullish regime. Falling slope = bearish regime. Flat slope = stay out.
Unlike a crossover system that requires two lines, a single HMA gives directional bias instantly. When the HMA turns up after a downtrend, that's an early long signal. When it turns down from a high, that's the exit.
Price Position Relative to HMA
Price above a rising HMA: trend is intact, stay long. Price below a falling HMA: trend is down, stay short or flat. Simple. Clean. Actionable.
The HMA also acts as dynamic support and resistance. In a healthy uptrend, pullbacks to the HMA line often find buyers. That's your entry zone — not chasing breakouts, but waiting for price to retrace to the HMA and then confirm with a bullish candle.
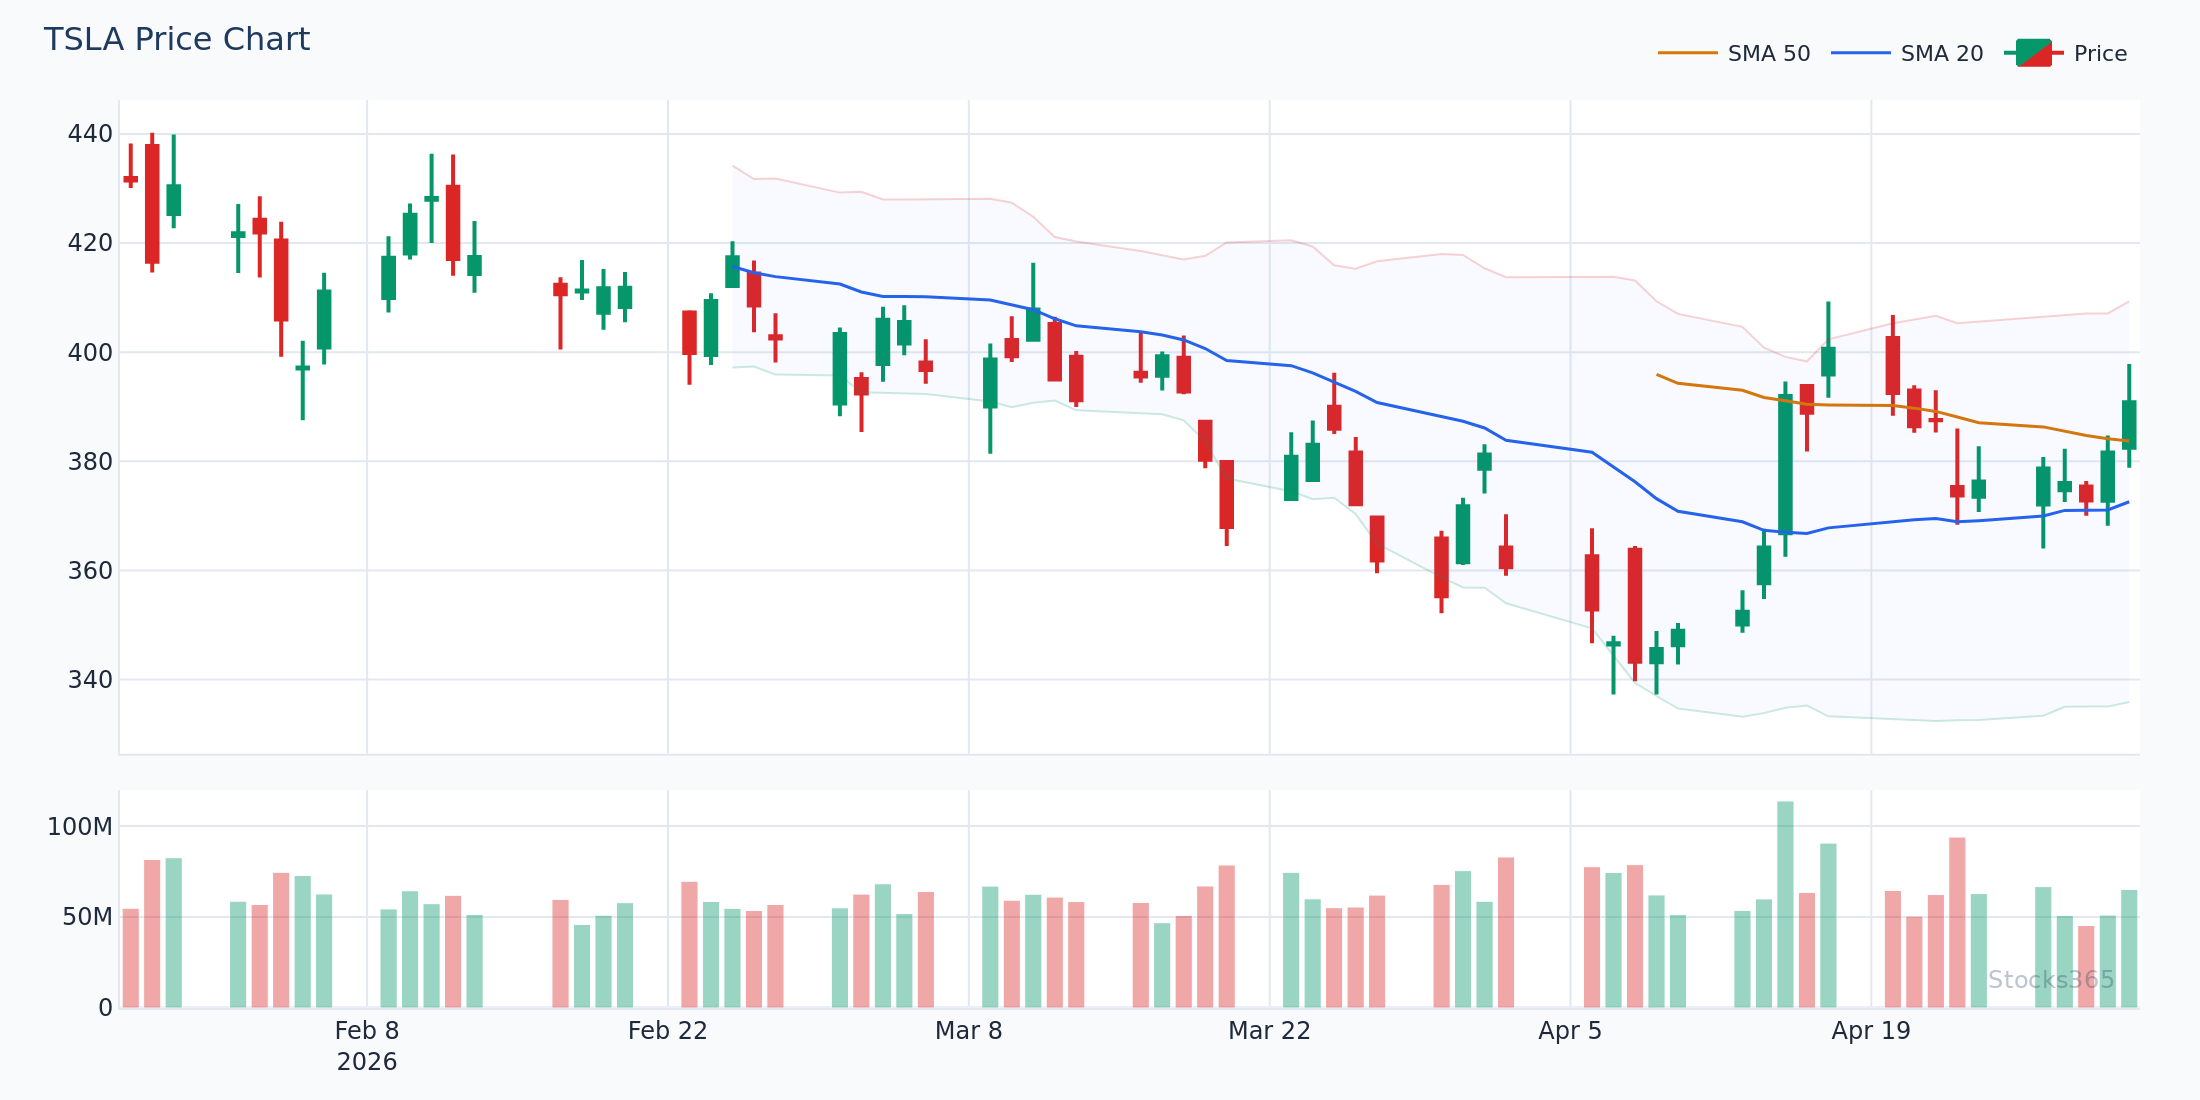
This setup on TSLA shows price pulling back to the HMA during an established uptrend. The HMA slope remains positive throughout — that's the key. When price touches the HMA line and produces a bullish engulfing or hammer candle, the high-probability long setup triggers. If the HMA slope turns negative during the pullback, the setup is off the table entirely.
HMA Color Changes as Trade Signals
Most charting platforms color the HMA green when it's rising and red when it's falling. Watch the color flip. A green-to-red transition is a sell signal. Red-to-green is a buy signal. This visual simplicity is one reason traders who discover the HMA rarely go back to traditional averages.
HMA Settings: Choosing the Right Period
Period selection depends on your timeframe and trading style:
- HMA 9–14: Scalping and short-term momentum trades. Very sensitive. More signals, more noise.
- HMA 20–21: Swing trading on daily charts. The sweet spot for most retail traders. Balances responsiveness with reliability.
- HMA 50–55: Position trading. Slower, fewer signals, but higher conviction trend identification.
- HMA 200: Macro trend filter. When price is above the 200 HMA, only take longs. Below it, only take shorts or stay flat.
Start with HMA 20 on the daily chart. Learn how it behaves. Then adapt.
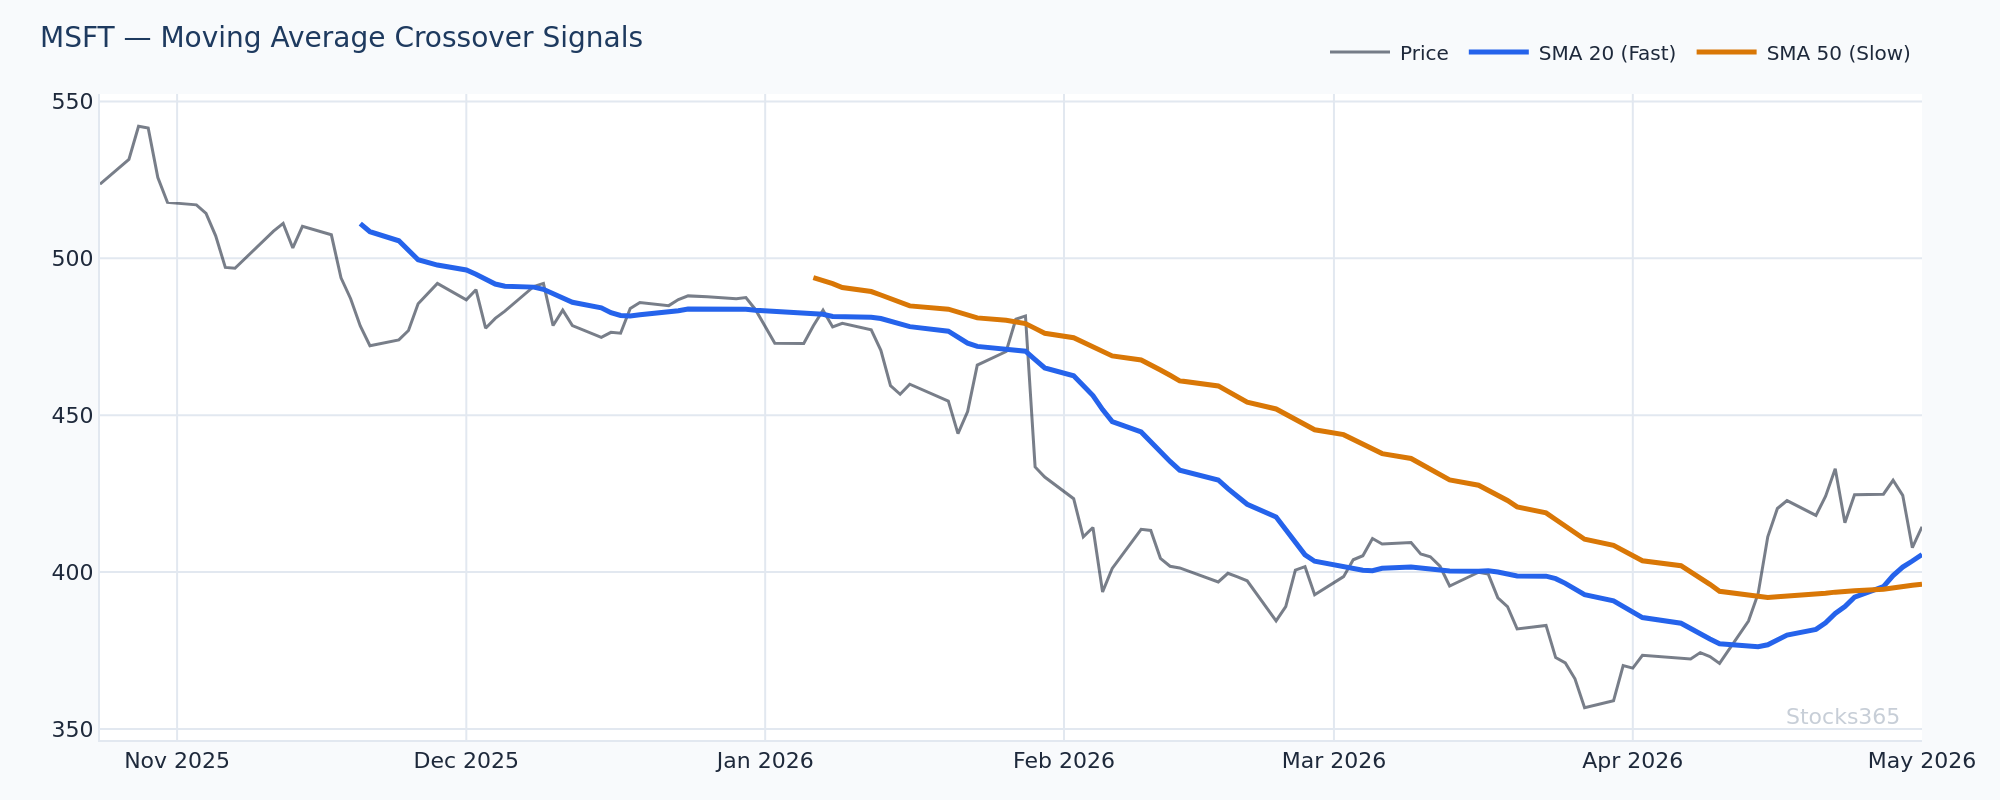
The dual HMA setup here shows HMA 20 crossing above HMA 50 on MSFT — a stronger trend signal than a single line alone. When the faster HMA crosses above the slower HMA while both slopes point up, the trend confirmation is high quality. The pattern fails if the HMA 20 immediately reverses back below the HMA 50 within two to three sessions after the cross.
HMA Trading Strategies
Strategy 1: HMA Slope Reversal Entry
Wait for the HMA to turn from red to green (downtrend to uptrend). Enter at the open of the next candle after the color change. Place your stop below the most recent swing low. This is clean, mechanical, and repeatable.
Works best on trending instruments — equities, major crypto pairs, commodity ETFs. Avoid using this in choppy, range-bound environments. The HMA will flip back and forth and generate losses.
Strategy 2: HMA Pullback Entry
In an established uptrend (HMA rising, price above HMA), wait for price to pull back and touch the HMA. Look for a reversal candle at the touch point — hammer, bullish engulfing, morning star. Enter on the next candle's open. Stop below the HMA touch candle's low.
This is a higher-quality setup than the slope reversal because you're entering with the trend confirmed, not just turning. Patience is the skill here.
Strategy 3: HMA + RSI Confluence
The HMA identifies trend direction. RSI identifies momentum extremes within that trend. Combine them.
Setup: HMA is rising (green). Price pulls back to the HMA. RSI simultaneously drops toward the 40–45 zone (oversold within an uptrend, not the classic 30 level). That dual confluence — price at HMA support AND RSI at momentum low — produces the highest-probability long entries.
For deeper RSI mechanics, this complete RSI trading guide covers the full framework. And if you want to spot divergence between RSI and price during HMA pullbacks, understanding RSI divergence signals adds another confirmation layer to this setup.
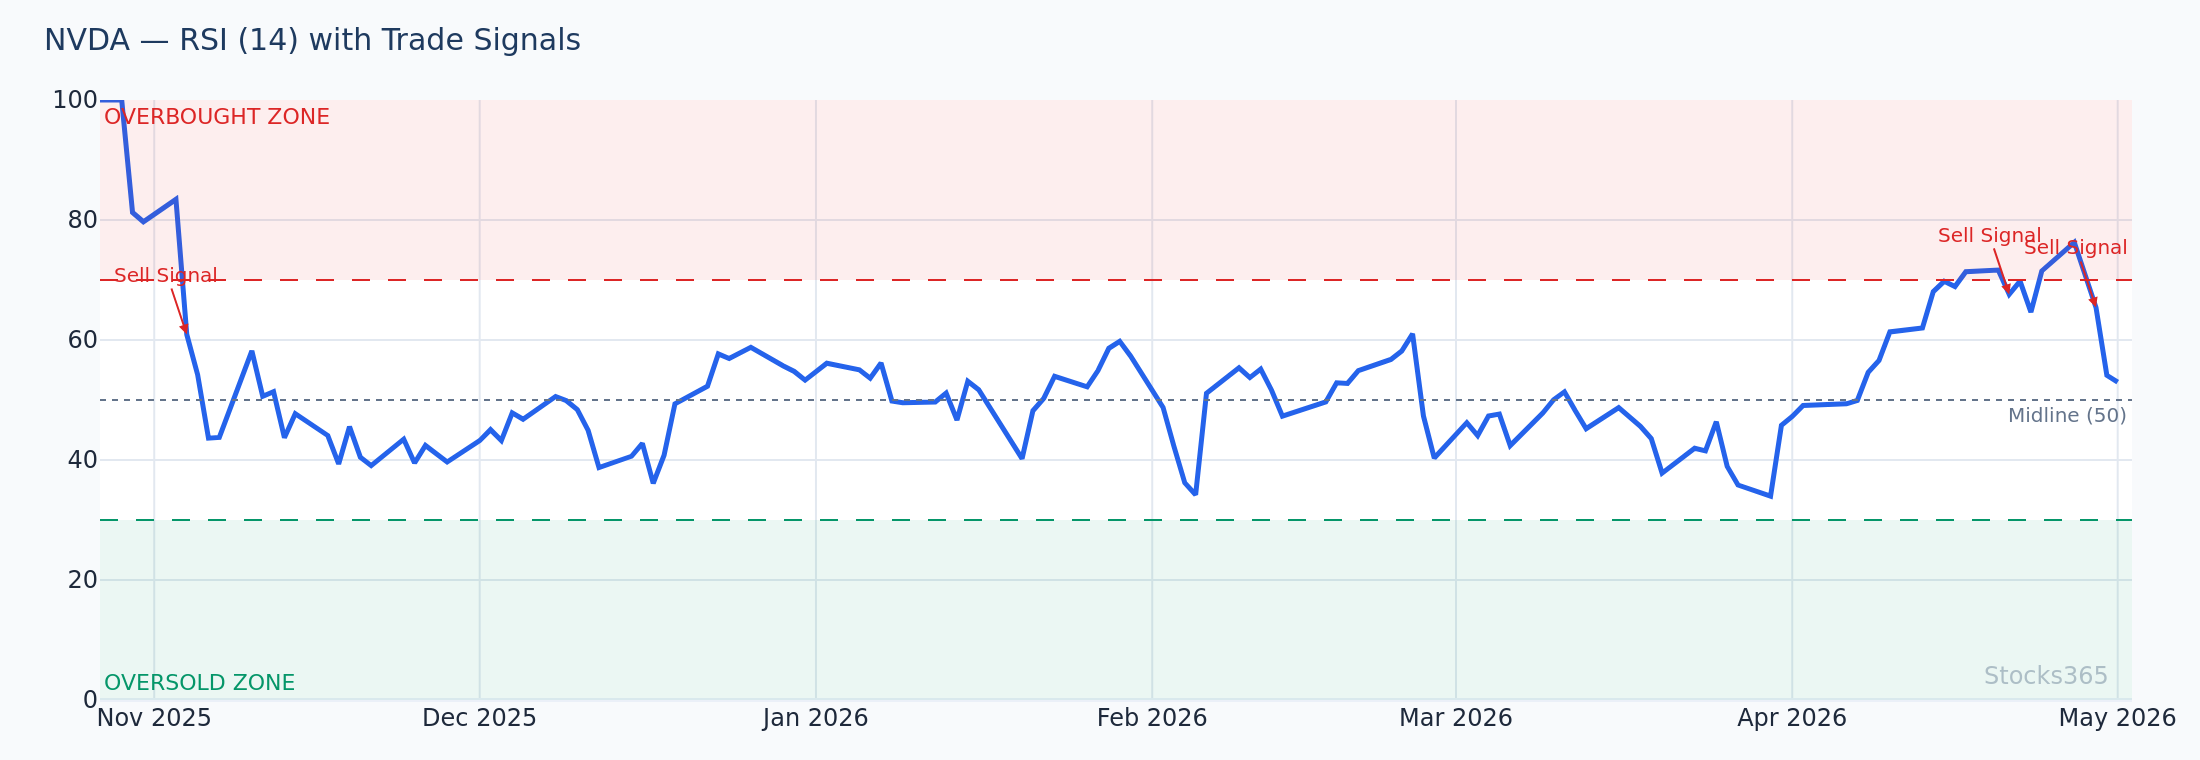
This NVDA chart shows the HMA pullback + RSI confluence setup in action. Price retraces to the rising HMA while RSI dips into the 40–45 zone. The combination signals that sellers are exhausted within an ongoing uptrend. The setup is confirmed when the next candle closes back above the HMA with RSI turning back up. If RSI continues falling below 35 during the pullback, the trend may be weakening — reduce position size or skip the trade entirely.
When the HMA Works — and When It Doesn't
The HMA is a trend-following tool. This means it excels in trending markets and struggles in sideways, choppy conditions. Know the difference before entering.
HMA performs best in:
- Strong trending equities during earnings-driven momentum phases
- Crypto in clear bull or bear cycles
- Commodities and commodity ETFs during supply/demand driven trends
- Major forex pairs during macroeconomic trend regimes — though even here, results vary significantly. MACD in forex often complements HMA for confirmation in currency markets.
HMA struggles in:
- Range-bound markets with no directional bias
- Low-volume, thinly-traded instruments
- News-driven gaps where price jumps over the HMA with no gradual transition
Our research dashboard tracks live strategy performance across asset classes. The data consistently shows that trend-following tools like the HMA produce their best results during high-ADX (Average Directional Index) regimes — when the ADX is above 25, trend signals are significantly more reliable than in sub-20 ADX environments.
It's also worth noting: Stocks365 backtested 3,289 Price Crosses Above SMA 20 signals and found only a 48.3% win rate (profit factor: 0.88) — with crypto performing worst at just 36.9% for that setup. Standard SMA crossovers in crypto are particularly unreliable. The HMA's reduced lag gives it a meaningful structural advantage in these volatile environments, where late signals are punished most severely.
HMA vs EMA vs SMA: Which Wins?
Direct comparison:
- SMA: Slowest to react. Most lag. Best for identifying macro trend direction on weekly/monthly charts. Least useful for entries.
- EMA: Faster. Better for entries. Still lags. Widely used, which means it gets gamed at obvious levels.
- HMA: Fastest response with smoothness preserved. Best for entries and exits. Less widely used, which means less manipulation at HMA levels.
The HMA doesn't replace the SMA or EMA for every purpose. Use an SMA 200 for macro trend context. Use the HMA 20 for timing entries. Layer them together for a complete picture.
What to Watch For
- HMA color flip on high volume: When the HMA transitions from red to green (or green to red) on a candle with volume surging 1.5–2x the 20-day average, the trend change is far more reliable. Low-volume HMA flips are frequent false signals — volume confirms conviction.
- HMA 20 crossing above HMA 50 while both slopes rise: This dual-period alignment on the daily chart historically marks the early phase of extended uptrends in equities. Watch for this setup on large-cap stocks after a period of consolidation.
- HMA pullback confluence with RSI trendline breaks: When price pulls back to a rising HMA and RSI simultaneously breaks above a descending trendline drawn across recent RSI highs, the momentum shift confirmation is powerful. Drawing RSI trendlines is a skill worth developing specifically for this purpose.
- HMA flattening after a strong trend: A flattening HMA (color still green but slope approaching horizontal) signals trend exhaustion before price confirms it. Tighten stops, reduce position size, or prepare for exit. Don't wait for the full color flip — the HMA flat is the warning.
- HMA rejection in crypto after a 15–20% rally: In crypto markets, watch for price tagging the HMA from below after a failed breakout. When price can't reclaim a falling HMA after two or three attempts, the next leg lower tends to be sharp. This pattern pairs well with hidden RSI divergence for high-confidence short setups.
How Stocks365 Uses This
🔬 How Stocks365 Integrates the HMAThe Hull Moving Average is one of 12+ indicators that feed into the Stocks365 Trust Score system. Specifically, HMA slope direction and price-to-HMA positioning contribute to the Trend Agreement Score — a sub-component that measures how many indicators align in the same directional bias.
When the HMA slope, MACD histogram, and RSI momentum all point in the same direction simultaneously, the Trust Score reflects high agreement. High agreement scores correlate with stronger follow-through in our backtesting. The Trust Score doesn't just flag whether a signal exists — it quantifies how much of the indicator stack is behind it.
You can see live Trust Scores for individual stocks directly in our Signals Dashboard, or check symbol-specific signals like AAPL's current signal page to see exactly how HMA and other indicators are scoring in real time.
Key Takeaways
📌 Hull Moving Average — Key Takeaways
- The HMA dramatically reduces lag compared to SMA and EMA by using weighted moving average differencing plus a square-root period smoothing step
- HMA slope direction is the primary signal — rising = bullish bias, falling = bearish bias, flat = stay out
- The most reliable HMA setups occur in trending markets; choppy, range-bound conditions produce false signals
- HMA 20 on the daily chart is the most versatile default setting for swing traders
- Combining HMA with RSI confirmation significantly improves signal quality — particularly HMA pullbacks with RSI at trend-oversold levels
- Volume confirmation on HMA color flips separates high-quality signals from noise
- The HMA is one of 12+ indicators in the Stocks365 Trust Score — high agreement across indicators produces the strongest setups